A FLEXIBLE METHODOLOGY FOR OUTDOOR/INDOOR BUILDING
RECONSTRUCTION FROM OCCLUDED POINT CLOUDS
M. Previtali a , M. Scaioni b, L. Barazzetti a, R. Brumana a
a
Politecnico di Milano, Department of Architecture, Built Environment and Construction Engineering Via G. Ponzio 31, Milan, Italy – [mattia.previtali, luigi.barazzetti, raffaella.brumana,]@polimi.it
b
Tongji University, College of Surveying and Geo-Informatics 1239 Siping Road, 200092 Shanghai, P.R. China – [email protected]
Commission III
KEY WORDS: Façade modelling, Indoor Reconstruction, Terrestrial laser scanning, Pattern Recognition, Urban Scene Analysis
ABSTRACT:
Terrestrial Laser Scanning data are increasingly used in building survey not only in cultural heritage domain but also for as-built modelling of large and medium size civil structures. However, raw point clouds derived from laser scanning generally not directly ready for the generation of such models. A time-consuming manual modelling phase has to be taken into account. In addition the large presence of occlusion and clutter may turn out in low-quality building models when state-of-the-art automatic modelling procedures are applied. This paper presents an automated procedure to convert raw point clouds into semantically-enriched building models. The developed method mainly focuses on a geometrical complexity typical of modern buildings with clear prevalence of planar features A characteristic of this methodology is the possibility to work with outdoor and indoor building environments. In order to operate under severe occlusions and clutter a couple of completion algorithms were designed to generate a plausible and reliable model. Finally, some examples of the developed modelling procedure are presented and discussed.
1. INTRODUCTION
In the last years terrestrial laser scanning (TLS) has become a major source for the generation of complex digital 3D models of building façades. This achievement has been motivated by some significant advances in scanning technology, by the increased automation of acquisition and registration processes of laser scans, along with a reduction of instrumental cost. In addition, the improvements in mobile laser scanning (MLS) systems and processing techniques allowed rising up the productivity of ground-based point-cloud acquisition, despite of a slightly lower precision than static scanning.
At the same time the demand of as-built building models has been also fostered by a major attention in energy saving policies fixed by national and over-national authorities. Indeed, to increase the energy efficiency of existing buildings as-built models are necessary both for thermal assessment/simulation and for the design of retrofitting interventions.
To faithfully capture a building model, especially in the case of large premises, an extensive acquisition process is often required to guarantee a complete coverage of the entire external surface. Once preliminary processing of laser point clouds is accomplished and laser scans are aligned and edited to remove background objects, the process to derive a complete and consistent 3D vector model is still a tedious job that may easily take several hours or few days, even for an experienced user. Significant manual assistance is often required for tasks such as data cleaning, hole filling, object classification, and model extraction. To improve this process, the topic of increasing automation in the building reconstruction pipeline has been paid a lot of attention in the literature, see Pu et al. (2011) and Haala and Kada (2010). However, the 3D reconstruction is generally complicated by some missing parts in the scans. Indeed, due to time and accessibility limitations, a complete acquisition setup is not always affordable for large buildings and often the surface has to be recovered from rather imperfect scans, i.e., noisy, incomplete and corrupted with outliers. While
in static TLS applications occlusions may be reduced by carefully planning the acquisition scheme, in MLS datasets generally a significant shadowing effect cannot be avoided due to pieces of urban furniture, trees, poles and other vehicles on the roads.
In this paper we focus on the automatic generation of building models and in particular on the enhancement and consolidation of imperfect and missing parts due to the poor quality of input data. The applications under consideration belong to Level-of-Detail (LoD) 4, being such as-built building models requested for planned maintenance, thermal retrofitting, preservation and documentation, as well as in other engineering applications. In such cases the geometric accuracy of the model is of primary relevance and objects have to be completed in an accurate and reliable way. In particular, since the primary application devised for the developed method is thermal analysis of existing buildings, we are mainly focusing on premises dated between 1950 and 1975. Indeed, those constructions were built up in an era when little or no consciousness was on taking care of energy efficiency performance. Although some differences exist in different countries, the most buildings at this epoch feature a prevalence of orthogonal intersections between walls. Such kind of scenes may be referred to as ‘legoland’ scenes (Foerstner 2010).
In particular, the developed solution is flexible and can deal both with indoor and outdoor scenes. The availability of a single reconstruction method dealing with both building façade and indoor rooms gives the chance to exploit redundant information, e.g., in the case an element (like a window) is occluded from outside, this may be recovered from indoor data or vice versa. In addition, the integration between outdoor and indoor data is fundamental for generation of building information models at LoD 4. On the other hand, indoor and outdoor scenes present different architectural peculiarities and tailored solutions for modelling have to be designed. In particular, two main completion strategies are presented here: ISPRS Annals of the Photogrammetry, Remote Sensing and Spatial Information Sciences, Volume II-3, 2014
(i) Repeated Pattern Detection and Completion (RPDC) and (ii) Visibility Analysis Completion (VAC).
The former (i) has been primarily designed for building outdoor. Indeed, façades of urban buildings generally exhibit a high degree of self-similarity and redundancy that is due to presence of repeated, regular patterns. In the developed methodology we explicitly make use of this characteristic of urban scenes to enable the recovery of missing geometry. In contrast to other methods based on procedural modelling (Ullrich et al. 2013), instead of making strong prior assumptions about the models and blindly recreating geometry using predefined procedural rules, we attempt to extract the maximum information from real scans. The challenge lies in the automatic determination of which elements repeat in the façade and the pattern they form.
On the other hand, VAC (ii) is primary intended for completion of indoor environments. Indeed, in such cases, repetitive patterns of walls and windows are more unlucky to be identified and ad-hoc algorithms robust to clutter are needed. In the developed procedure to understand the nature of occlusions, a ray-tracing algorithm (see Alsadik et al. 2014) is used to identify regions that are occluded from every viewpoint and to distinguish them from openings in the surface (e.g., due to doorways or windows). Even if this second completion strategy is primarily designed for indoors it can be used also in outdoors regions were no repeated patterns can be found, for example in MLS data sets.
1.1 Related work
Several methods have been proposed in the recent literature for production of building models generated from TLS data. However, they are generally specifically designed for separately modelling of building façades (e.g., Pu and Vosselman 2009; Ripperda and Brenner 2009) or indoor rooms (Budroni and Boehm 2005; Okron et al. 2010; Adan and Huber 2011). No reconstruction methods have been developed for simultaneous modelling of both kinds of environments. In addition, several methodologies operate under the assumption that the surface being modelled is relatively unobstructed. To recover missing parts a few research works focused on the detection of regularity directly on 3D geometry (e.g., Pauly et al. 2008; Bokeloh et al. 2009). These state-of-the-art techniques focus on detecting repeating elements in 3D models, but do not investigate how to use the detected structures for extensive data improvement or completion.
Similarly, also the indoor modelling based on TLS data was investigated in different works (Hahnel et al. 2003; Dumitru et al. 2013; Khoshelham and Díaz-Vilariño 2014). However, they do not considered the occlusion problem because they focused on modelling of hallways with no furniture or other potentially occluding objects. More attention to this problem is given in Díaz-Vilariño et al. (2014), where laser data are integrated to images.
2. METHOD OVERVIEW
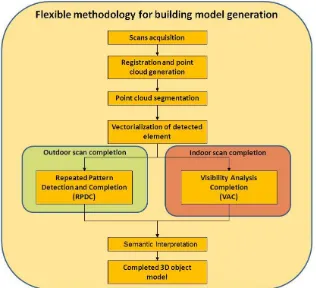
The presented approach follows the workflow reported in Figure 1. The modelling methodology can be applied to unstructured point cloud of tens of millions points. This means that each point is parameterized by its spatial coordinates and may also feature some related attributes (e.g., intensity, colour, normal vector), but does not share any topological relationships with other points in the neighbourhood. The input point cloud can be generated by a single or multiple laser scan station(s).
Indeed, after scan registration/geo-referencing, scans are merged together without needing any reorganization into a specific data structure. Once all scans are acquired and registered together to output a non-structured point cloud, the main architectural elements of the building are identified by means of a segmentation process based on a modified RANSAC implementation (Previtali et al. 2014). In particular, the standard RANSAC approach (Boluaassal et al. 2008) for point cloud segmentation is modified by including topology into the process to minimize problems connected to under- and over-segmentation, respectively (Sect. 3).
Once planar clusters constituting the building object are detected, their vectorization is performed. During this phase some constraints related to building geometry, like the prevalence of straight lines and orthogonal intersections, are enforced to obtain a regularization effect (Sect. 4).
A differentiation in the developed pipeline takes place for the completion phase, which mainly relies on RPDC and VAC for outdoor and indoor modelling, respectively. To achieve completion of these parts, the developed algorithm incorporates some architectural priors on indoor scenes, notably the prevalence of orthogonal elements which is typical of legoland scenes (Sect. 5). Finally, all pieces of information are merged together to obtain the complete 3D object model enriched with semantics (Sect. 6).
In Tables 1 and 2 all input parameters needed for outdoor/indoor reconstruction pipelines are outlined.
Figure 1. The flowchart of the developed flexible methodology for building model generation.
Parameters for outdoor reconstruction Point cloud
segmentation
RANSAC plane threshold ε RANSAC normal threshold α
Bitmap cell size β
Vectorization RANSAC dominant line threshold ε
Gap filling length L
Scan completion Voxel cell size β
Minimum similarity SMmin
Table 1. Parameters for outdoor reconstruction.
Parameters for indoor reconstruction Point cloud
segmentation
RANSAC plane threshold ε RANSAC normal threshold α
Bitmap cell size β
Vectorization RANSAC dominant line threshold ε
Gap filling length L
Scan completion Bitmap cell size β
Occluding distance
Table 2. Parameters for indoor reconstruction. ISPRS Annals of the Photogrammetry, Remote Sensing and Spatial Information Sciences, Volume II-3, 2014
3. POINT CLOUD SEGMENTATION
A first step towards the segmentation of the building object is to detect all its planar features. Detection of façade objects is accomplished by using a specifically modified RANSAC-based algorithm (Fig. 2). This implementation is aimed at reducing spurious results obtained by the standard sequential RANSAC segmentation as reported in the literature (Boulaassal et al. 2009; Awwad et al. 2010). Those bad-segmentation problems can be categorized into under- and over-segmentation. Under-segmentation is generally due to the fact that points resulting in the maximum consensus to RANSAC may belong to different façade objects. A typical example is represented by windows. Indeed, even if they belong to the same geometrical plane, each window represents a different architectonical component. Over-segmentation is generally associated with noise or irregularities in the data set. Many façades presents irregularities, like out-of-plumbs that are not evaluated in the RANSAC estimation of inliers. This may result in a wrong subdivision of a single façade element into several objects.
Figure 2. Workflow of the developed segmentation process.
To partially overcome the limitations enlisted above, a new automatic approach is presented for the segmentation of planar surfaces based on the combination of RANSAC and region-growing techniques. The aim of this strategy is to derive ‘meaningful’ segments from building point clouds. This means that extracted segments would correspond to objects of interest (e.g., roofs, walls, doors, etc.) instead of being simply those which best fit some mathematical models. This hybrid strategy allows combining the robustness of RANSAC with the spatial proximity used in region growing methods. Indeed, in contrast to standard region growing methods (Tóvári and Pfeifer 2005; Rabbani 2006) the segmentation results are not affected by selection of ‘seed’ points because the estimation of planar segment is performed by using RANSAC. In addition fewer parameters (see Table 1) are required with respect to the region-growing implementation presented in Vosselman et al. (2004) where the selection of slightly different values of control parameters may result in a large variety of bad-segmentation problems. On the other hand the developed segmentation procedure is able to solve those critical situations reported in Boulaassal et al. (2009).
In particular, under-segmentation is reduced by introducing knowledge about point topology. Indeed, even if points are not usually related by any topological relationship in an unorganized point cloud, we can assume that points belonging to the same object should be sufficiently close to one another while groups of points belonging to different objects should be separated by a spatial gap. For this reason, point cloud proximity is evaluated by using a 2D binary point occupancy raster map. First, any points belonging to the same plane are projected orthogonally to a raster bitmap. All pixels in the bitmap containing at least one projected point are assigned the value 1, while others are given value 0. This raster map allows finding connected regions of pixels featuring value 1. Then all points whose projection belongs to the same connected component can be clustered.
Once all planar elements are detected, the extracted planes are clustered together to reduce over-segmentation problems. Object clustering is performed by evaluating three parameters: (i) similarity of normal vectors; (ii) perpendicular distance between planes; and (iii) intersection between clusters.
An example of the results achieved by using the presented method is presented in Figure 3.
Figure 3. Building’s façade segmentation results: (a) original point cloud; and (b) segmentation results, each detected segment is represented using a different colour.
4. VECTORIZATION
The most important aspect for vectorization of elements detected in the previous step is the detection of breaklines. In TLS domain Boulaassal et al. (2009) presented a contour extraction algorithm for building façades. After façade segmentation and detection of planar clusters in a façade, the extraction of their contour is carried out. The main idea exploited in this algorithm is based on the hypothesis stipulating that contour points belong to the long sides of Delaunay’s triangles for detected clusters. This algorithm proved to be able to detect contour points. However, due to noise in the data set and the random nature of points acquired by TLS systems, the derived contours may feature a very irregular and jagged shape. Becker and Haala (2007) presented a procedure for extraction of breaklines from point cloud of building façades combining two different phases. In a first step a cell decomposition of the façade is accomplished by identifying contour points using a raster representation. Then, façade edges are refined by means of an edge matching procedure combining photos and TLS data. However, problems may arise when the laser point density is too low with respect to resolution of digital images. Pu and Vosselman (2006) presented an automatic approach to extract building façade features from a terrestrial point cloud. The method first defines several important building features. Then the point cloud is segmented into planar segments. Finally each segment is ISPRS Annals of the Photogrammetry, Remote Sensing and Spatial Information Sciences, Volume II-3, 2014
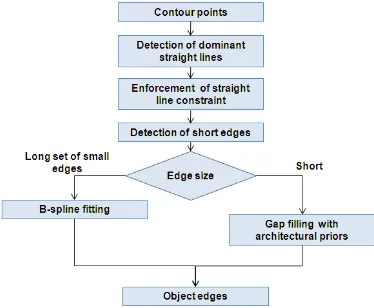
compared to building features. However, the procedure presents a high number of control parameters that are difficult to select. To cope with the previously listed limitation of the state-of-the-art algorithm a new methodology has been developed (Fig. 4). The developed procedure does not require RGB images so that the problem of image registration can be avoided. In addition the obtained breaklines are enforced to fit some architectural priors.
The first step of vectorization is the identification of contour points, which are detected by using the procedure presented in a previous paper (Previtali et al. 2014). However, as previously discussed, contour points define quite irregular and jagged profiles showing a characteristic ‘saw-tooth’ shape due to the noise and random measurement errors of laser scanning data. However, this is in contrast with the characteristic building geometry where straight lines are predominant. For this reason, the achieved edges cannot be directly used for building modelling. Smoothing is still needed to define a regular shape of each object. This process has to consider the different typologies of possible edges. In particular, edges can be usually split into different basic entities (linear or curved parts). Then line and the curve equations are fitted with Least Squares by using the dominant point information, while the whole edge can be finally reconstructed by merging these entities together. As previously noticed, an important aspect of the façades targeted in this research is given by the fact that the straight lines are predominant. In addition, such straight lines generally intersect in orthogonal way. For this reason, once the contour points are found, the dominant edge directions are identified by using a sequential RANSAC implementation aimed at extracting linear features similar to the one presented for the detection of planes (see Sect. 3). Once dominant lines are extracted, inlier points are removed and replaced with a straight line. The remaining contour edges are then evaluated. Indeed, sometimes, small occlusions on a façade or segmentation errors may cause irregular edges on the generated outline.
Figure 4. Workflow of the developed edge smoothing and regularization process.
These irregular edges should be removed by observing that they form short segments, which result in a gap on the outline. If the left long edge (w.r.t. the gap) and the right long edge belong to the same line, the gap will be filled by connecting a line segment. If both edges are parallel, a line segment which is perpendicular to both will be generated, and the edges extended to reach the perpendicular segment. Finally, in the case the two initial edges are orthogonal, they will be extended or shortened
until they intersect at a point to fill the gap (Fig. 5). Edge filling intersection constraints not only re-establish the topology between objects but also increase the accuracy of detected breaklines. Indeed, by means of surface intersection constraints, breaklines are calculated as the intersection of planes which are estimated from a large set of points.
Figure 5. Filling of boundaries for different edge configurations.
5. SCAN COMPLETION
As previously discussed, TLS devices often produce noisy and incomplete data sets due to occlusion, unfavorable surface reflectance properties, or geometric restrictions in the scanner setup. This problem is even more serious in the case of MLS where there is a lower flexibility in the choice of the scanning position.
Model-based approaches are used to cope with occlusions in façade modelling (Becker and Haala 2009; Koutsourakiset al. 2009). In particular, they assume that the occluded region is part of a repeated pattern. However, while in recent years many techniques have been developed to detect repeated parts in models (Mitra et al. 2006; Pauly et al. 2008), most of these research works do not investigate how to optimize the use of strong regularity in 3D scans, specifically in urban buildings. Moreover, most techniques are applied in image space by analyzing photometric 2D images sampled over an underlying regular domain. Only few attempts have been made towards detection of regularity directly on 3D geometry (e.g., Pauly et al. 2008; Bokeloh et al. 2009). These state-of-the-art techniques focused on detecting repeated elements in 3D models, but do not investigate how to use the detected structures for extensive data improvement or completion.
Even though the occlusion problem is more severe in indoor scan, few approaches exist to cope with this situation. In Okron et al. (2010) and Adan and Huber (2011) a method for dealing with occlusions on the basis of a ray-tracing approach is presented. However, a quite coarse voxelization of the room space and a long voxel labelling is carried out.
To cope with occlusions both for indoor and outdoor scenes we present a novel approach which allows obtaining a complete and consistent 3D model representation from such incomplete surface scans. As previously anticipated, two main completion strategies have been designed: RPDC (Subsect. 5.1) and VAC (Subsect. 5.2).
5.1 Repeated Pattern Detection and Completion
Once façade elements are detected and vectorized the scan completion procedure is based on the identification of repeated ISPRS Annals of the Photogrammetry, Remote Sensing and Spatial Information Sciences, Volume II-3, 2014
patterns in the building façade (see Previtali et al. 2013). Indeed, façades of buildings are generally built in a modular way: a set of few basic elements is organized into a regular pattern which generally sets up a regular grid. The recognition of these patterns can be used to recover missing elements and complete the final building model. However, the identification of repeated patterns in a point cloud features at least two main problems: (1) to define a measure to identify similarity between detected objects in the point cloud; and (2) to set up a procedure to identify the regular grid formed by objects, which is robust against lacks, outliers and noise.
These problems are overcome along with two different stages. First, similarity is evaluated between pairs of patches derived from the previous segmentation and vectorization steps. Once two different patches are aligned by means of a standard Iterative Closest Point procedure (Besl and McKay, 1992) similarity between them is evaluated in a quantized space in order to tolerate poor quality input data. In particular, each point cloud patch is embedded into a volumetric grid composed of voxels whose size is fixed a little bit larger than the mean sampling distance of the point cloud. In each resulting voxel the number of points contained in it is stored. Then the similarity adopted measure defined in Eq. (1) represents a local similarity measure of point distributions in the overlapping region between the two considered objects. In particular, SM may range from -1 (full inverse correlation) to 1 (full direct correlation). For this reason we can assume that SM values close to 1 indicate high similarity between patches while in the case SM is close to zero or negative, these are assumed to be different. Once the similarity is measured for each pair of slices, the ones having the maximum similarity are automatically clustered by using a bottom-up method as far as no more clusters can be created.
Once similar objects are detected in the point cloud, the regular grid they form has to be estimated in a robust way. The unknown grid position for a lattice structure of M rows and N columns are represented by the row coordinates Xgi(i=1,2,…,M) and column coordinates Ygj(j=1,2,…,N). The input data are the centres cij(Xci,Ycj) of the similar object clusters detected in the previous step.
To find the unknown grid positions gij, we applied an optimization scheme combining two energy terms. The first one takes into account the distance between the grid location gij to
The continuous variable αij is a weight measuring how reliably a grid location is mapped to a façade object and vice versa. They are included as additional unknowns in the optimization process accounting for holes and outliers. Indeed, values of αij close to
zero indicate a hole or an outlier, while values close to 1 represent a reliable matching between a façade element and a grid location.
The second energy term is aimed at maximizing the number of valid correspondences between grid location and façade elements:
The final objective function to be minimized is defined as:
α
γ
γ E E
E= ⋅ C+(1− )⋅ (5)
where γ balances the two energy terms. In order to find repeated similarity in the grid structure, the spacing between consecutive columns and rows is calculated and clustered. In the case repetitive spacing are found some additional constraint equations are added in the minimization.
In Figure 6 results of RPDC algorithm for both façades of building in Figure 3 are reported.
a. b.
Figure 6. Results of RPDC algorithm for both façades of the building in Fig. 3: the repeated pattern for the two analysed façades superimposed to the point cloud (a-b). Each recognized pattern is represented by a different colour.
5.2 Visibility Analysis Completion
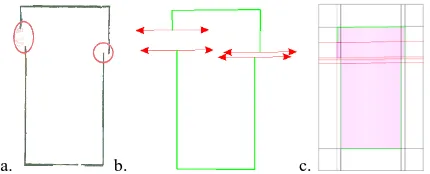
In the case of indoor scans some walls may have not been sensed during scanning and may miss in the point cloud. For this reason a proper completion procedure is necessary to reconstruct in a plausible way these pending walls and derive the floor plan. Indeed, in indoor modelling applications a single pending small wall may jeopardize the entire reconstruction of the floor plan. In the developed strategy, such gaps are filled by incorporating additional, unseen ‘pending’ walls (Chauve at al. 2010). In particular, in indoor environment it is possible to observe that generally walls intersect orthogonally. For this reason ‘pending’ walls are guessed to be orthogonal to detected walls and are derived from the boundary of detected walls (Fig.7a-b).
To obtain a continuous floor plan from ‘detected’ and ‘pending’ walls, a procedure based on cell complex labelling is applied. A 2D arrangement (Edelsbrunner et al. 1986) is set up, which generates a partitioning of the original space domain into convex polygonal cells (Fig. 7c). Once the cell complex is derived, the floor plan reconstruction problem can be formulated as an optimal binary labelling of cells in the complex. Each cell is labelled as ‘empty’ or ‘occupied,’ and the floor plan can be extracted as the union of all facets separating an occupied cell to an ‘empty’ one, obtaining this way an intersection-free boundary. This labelling problem is handled within the framework of minimum s-t cut (Reif 1983) on the ISPRS Annals of the Photogrammetry, Remote Sensing and Spatial Information Sciences, Volume II-3, 2014
cell-adjacency graph G = (V,E) of the partitioning, where the vertices V are the cells of the polygonal cell complex and the edges E link adjacent cells, i.e., they correspond to the facets of the complex. Starting from the available data some cells can be directly categorized as ‘occupied’. In particular, all cells occupied by points belonging to the ceiling can be directly assigned as ‘occupied’. Weights of remaining edges between cells are fixed equal to the length of the edge between the cells. This means that the s–t cut problem is aimed at minimizing the length of guessed walls segments. Once all surfaces of the room ‘box’ are detected, the presence of openings is investigated. Indeed, occlusions and clutter produce significant holes in the point cloud which may be erroneously classified as openings. To identify these situations the ray-tracing labelling is applied and an occupancy map is generated (Adan and Huber 2011). The idea behind this method is that if a surface is occluded, this means that there is another object closer to the scanner resulting in a shadowing effect. For this reason, each wall element detected in the previous step is discretized into cells of size β x
β. Then each cell is tested to verify if it is occupied, occluded or represent an opening (e.g., window or door). In order to scrutinize between these different situations, the ray tracing method is used for every scan position in the room. A first occupancy map (denoted as M0) is generated on the basis on whether inlier points are detected at each cell location or not. Starting from this map for each scan position, a labelling Lk is generated by tracing a ray from the scan location to each pixel Pi(x,y,z) labelled as ‘empty’ in M0. Having defined the cell location in spherical coordinates, the 20-nearest neighbour points for Pi can be easily defined. As a measuring distance between Pi and other points, vertical or nadir angle α and horizontal or azimuth angle θ measured by the scanning instrument are used. In the case the 20-nearest neighbour points have angular distance (θ, α) far larger than the predefined angular scanning resolution, this would mean that no reflected signal returned back to the laser scanner due to the presence of an opening. In this case, the pixel Pi is labelled as ‘empty.’ Conversely, if the angular distance is compatible with the predefined scanning resolution, the mean distance of the nearest neighbours is evaluated dmean = mean (d1, d2,..., d20). In particular, in the case the mean distance is lower than the distance from cell Pi, this would mean that Pi is occluded by some points in the scan and the cell is consequently labelled. On the other hand, if the mean distance is larger than the distance from Pi, the cell is labelled as ‘empty.’ After ray-tracing labelling for any scans, K labels for each pixel are obtained (Fig. 7d). Then all labels are combined together in a final occupancy map LF adopting the following labelling rule:
a. b. c.
Figure 7. Results of VAC algorithm: some wall portions are missing (red circles) due to occlusions (a) and missing walls are added (b); induced ‘cell complex’ (c).
occluded i
L K j occluded i
L and empty i L
If 0()= j()= ,∀ =1,2,..., => F()=
In other words, a cell is considered as ‘occluded’ if it is occluded in any scans. Having obtained the occupancy map,
openings can be easily detected by identifying the labels of the cells (Fig. 9).
a. b.
Figure 8. Occupancy map for a wall: reflectance image (a) and cell labelling results (b).
6. SEMANTIC INTERPRETATION
Once all objects are detected and completed, building’s architectural elements need to be further classified according to their functionalities (e.g., walls, windows, doors, etc.). This step is important to add semantic content to the geometric model. In order to perform this task some attributes for each object are defined and a set of classification rules are formulated and organized in a hierarchical classification tree. For a detailed description the reader is addressed to Silla and Freitas (2011). In particular for outdoors (Fig. 9a), the classification starts with evaluating both area and position of any detected objects. First, the ground is detected because it is the horizontal (or pseudo-horizontal) object at the lower level. Then the main façade planes are extracted since they are objects perpendicular to the ground and have the largest area with respect to any other objects. Indeed, the wall area in a façade is generally much larger than the one covered by other objects like windows or doors. Then flat-like objects over walls protruding out of the façade are classified as roof. For all non-classified objects their position with respect to the main façade plane is evaluated. Objects in front of the façade are extrusion objects and classified in a general way as wall attachments, while others are classified as intrusions. These can be further distinguished in sidewalls, windows and doors. Sidewalls differ from other intrusions because their orientation is perpendicular to the frontal face of the walls and for this reason they can be easily recognized. In order to distinguish between doors and windows it is assumed that doors are only at bottom floor. In addition in correspondence of a door the main façade plan has a characteristic gap having an inverted ‘U shape’ while in correspondence of windows the gap has an ‘O shape.’ Starting from these considerations, doors are sought for only at the ground floor and in correspondence of inverted ‘U shape’ gaps in the main wall face. Other intrusions parallel to the façade plane are classified as windows.
a. b.
Figure 9. Hierarchical classification tree for building’s outdoor (a) and for indoor rooms (b).
For indoor environments five semantics features extracted are defined, i.e., wall, window, door, floor and ceiling. In this case the ceiling can be designed as the non-vertical plane having the lower height while the roof is the one at higher height. Then openings are classified as doors when they intersect with ground floor, otherwise they are defined as windows. The corresponding classification tree is shown in Figure 9b.
7. APPLICATIONS
Two examples are illustrated here to present possible applications of the developed modelling procedure. The first test concerns an outdoor scene including two façades facing a courtyard, while the second an office room. A phase-shift TLS FARO-FOCUS 3D (www.faro.com) was adopted.
In the first experiment, the scanned scene presents a quite high number of clutters generating occlusions on the building façades and resulting in large missing parts (Fig. 10a). First step of the developed methodology is façade segmentation (Fig. 10b). Adopted input parameter values are reported in Table 3.
‘Courtyard’ ‘Office’
RANSAC plane threshold ε 1 cm
RANSAC normal threshold α 20 °
Bitmap cell size β 1 cm
RANSAC dominant line threshold ε 0.7 cm
Table 3. Parameters used for segmentation of outdoor data set.
In Figure 10c the detected repeated patterns are shown. In particular, it is possible to observe that the developed algorithm can efficiently detect missing objects (like windows) also in the case of severe occlusions. Detected regularities are used to complete the building model (Fig. 10d). The results achieved by the proposed approach were checked in order to quantify the geometric accuracy of the obtained vector models. In order to do that a manual reconstruction of the same data set was performed, which is considered in the literature as the most precise method to extract a vector model from a point cloud (Nex and Rinaudo, 2009). The ‘manual’ model was compared to the automatically generated. In particular, for each edge the absolute modelling error is defined as the absolute magnitude of the difference between the ground truth and the model position. An edge is considered as correctly detected if the distance between the manually generated edge and the closest automatically generated edge is lower than a predefined threshold T. As expected, the numbers of correctly detected edges decreases as the tolerance increases. However, this drop presents a significant discontinuity in correspondence of T = 3.0 mm. In particular, up to this tolerance the correspondence between automatic and manual derived breaklines is close to 98%. This means that the accuracy of the detected edge is about this order of magnitude. However, an important factor needs to be observed. Manual modelling of a point cloud is indeed influenced by human interpretation and the definition of breaklines with accuracy higher than 2.0 – 3.0 mm is almost impossible also for a skilled operator.
The second example consists in the modelling of an office-room characterized by a complex ground plane contour. The segmentation parameters adopted in the previous example have been used here again (Tab.3). In Figure 11 a summary of the main processing step for this data set are shown. Also in this case the derived model was compared to the output of ‘manual’ modelling. In particular, the accuracy of the wall and opening
boundaries is similar to the one obtainable with manual modelling of the point cloud up to a tolerance (T) of 2 mm, confirming the previously discussed results.
a. b.
c.
d
Figure 10. Outdoor data set: original point cloud (a); segmentation results (b); detected repeated patterns (c); and final completed model (d).
a. b.
c. d.
Figure 11. Geometric reconstruction of indoor data set: (a) segmentation results; (b) induced cell complex; (c) wireframe model with overlaid the original point cloud; and (d) final 3D model.
8. CONCLUSIONS AND FUTURE WORKS
This paper presented a novel automated method to derive 3D vector model of building indoors and outdoors from massive unstructured point clouds affected by occlusions and clutter. ISPRS Annals of the Photogrammetry, Remote Sensing and Spatial Information Sciences, Volume II-3, 2014
In particular a flexible completion strategy was presented in order to obtain a final model completed in reliable way. The major advantage of this methodology is given by the fact that outdoor and indoor reconstruction can be performed in a single framework giving this way the chance to generate in an automatic way a building model at LoD 4. Up to now indoor and outdoor modelling, even if they are performed simultaneously, proceed in a quite independent way. However, in our future works we are planning to share information between the two process in order to exploit in an efficient way data redundancy, e.g. in the case an element (like a window) is occlude from outside this can be recovered from inside data or vice versa. Moreover, the automatic integration of indoor and outdoor models needs further investigations in order to provide LoD 5 models.
Finally, the proposed procedure has been successfully validated on different buildings but all of them followed a Legoland structures. Extension of the methodology to deal with a larger number of building geometry is devised.
Acknowledgements
Funding was partially provided by National Key Basic 973 Research Program of China (Id 2013CB733204).
REFERENCES
Alsadik, B., Gerke, M., and Vosselman, G., 2014, Visibility analysis of point cloud in close range photogrammetry. ISPRS Ann. Photogramm.
Remote Sens. Spatial Inf. Sci., Vol. 2(5), pp. 9-16.
Adan, A. and Huber, D., 2011, 3D reconstruction of interior wall surfaces under occlusion and clutter. In: Proc. Int. Conf. on 3D Imaging, Modeling, Processing, Visualization and Transmission (3DIMPVT’11), Hangzhou (P.R. China), 16-19 May, pp. 275-281. Awwad, T.M., Zhu, Q., and Li, Q., 2009. An Extension of RANSAC. In: Proc. Int. Conf. on Information Engineering and Computer Science (ICIECS2009), Wuhan (P.R. China), 19-20 Dec., pp. 1-4.
Becker, S., and Haala, N., 2009. Grammar supported façade reconstruction from mobile LIDAR mapping. Int. Arch. Photogramm.
Remote Sens. Spatial Inf. Sci., Vol. 38(3), pp. 229-234.
Besl, P.J., and McKay, N.D., 1992. A method for registration of 3-D shapes. IEEE Tans. Pattern Anal. Mach. Intell., 14: 239-256.
Bokeloh, M., Berner, A., Wand, M., Seide,l H.-P., and Schilling, A. 2009. Symmetry detection using line features. In: Proc. Eurographics 2009, Munich (Germany), 30 March-3 April.
Boulaassal, H., Landes, T., and Grussenmeyer, P., 2009. Automatic extraction of planar clusters and their contours on building façades recorded by terrestrial laser scanner. Int. J. Archit. Comp., 7(1):1-20. Budroni, A., and Boehm, J., 2009. Toward automatic reconstruction of interiors from laser data. Int. Arch. Photogramm. Remote Sens. Spatial
Inf. Sci., Vol. 38(5-W1), 7 pages (e-doc).
Chauve, A.L., Labatut, P., Pons, J.P., 2010. Robust piecewise-planar 3D reconstruction and completion from large-scale unstructured point data. In: Proc. Int. Conf. CVPR 2010, San Francisco (CA-USA), 13-18 June, pp. 1261-1268.
Díaz-Vilariño, L., Martínez-Sánchez, J., Lagüela, S., Armesto, J., and Khoshelham, K., 2014, Door recognition in cluttered building interiors using imagery and lidar data. Int. Arch. Photogramm. Remote Sens.
Spatial Inf. Sci., Vol. 40(5), pp. 203-209.
Dumitru, R.C., Borrmann, D., and Nüchter, A., 2013. Interior Reconstruction Using the 3d Hough Transform. Int. Arch.
Photogramm. Remote Sens. Spatial Inf. Sci., XL-5/W1, 65-72.
Edelsbrunner, H., O’Rourke, J., and Seidel, R., 1986. Constructing arrangements of lines and hyperplanes with applications. SIAM J.
Comput., 15(2):341-363.
Foerstner, W., 2010. Optimal vanishing point detection and rotation estimation of single images from a Legoland scene. Int. Arch.
Photogramm. Remote Sens. Spatial Inf. Sci., Vol. 38(3A), pp. 157-162.
Haala, N., and Kada, M., 2010. An update on automatic 3D building reconstruction. ISPRS J. Photogramm., 65(6):570-580.
Hähnel, D., Burgard, W., and Thrun, S., 2003. Learning compact 3D models of indoor and outdoor environments with a mobile robot. Robot.
Auton. Syst., 44(1):15-27.
Khoshelham, K., and Díaz-Vilariño, L., 2014. 3D Modelling of Interior Spaces: Learning the Language of Indoor Architecture. Int. Arch.
Photogramm. Remote Sens. Spatial Inf. Sci., Vol. 40(5), pp. 321-326.
Koutsourakis, P., Simon, L., Teboul, O., Tziritas, G., and Paragios, N., 2009. Single view reconstruction using shape grammars for urban environments. In: Proc. ICCV 2009, 27 Sept.-4 Oct., Kyoto (Japan), pp. 1795-1802.
Mitra, N.J., Guibas, L.J., and Pauly, M., 2006. Partial and approximate symmetry detection for 3D geometry. ACM T. Graphic., 25(3): 560-568.
Nex, F. and Rinaudo, F., 2009. New integration approach of Photogrammetric and LIDAR techniques for architectural surveys. Int. Archives Photogrammetry, Remote Sens. Spatial Inf. Sci, 38, 3. Okorn, B., Xiong, X., Akinci, B., and Huber, D., 2010. Toward automated modeling of floor plans. In: Proc. Symp. on 3D Data Processing, Visualization and Transmission (3DPVT’10), Vol. 2, Paris (France).
Pauly, M., Mitra, N.J., Wallner, J., Pottmann, H., and Guibas, L., 2008. Discovering structural regularity in 3D geometry. ACM T. Graphic., 27(3), paper No. 43, 11 pages.
Previtali, M., Scaioni, M., Barazzetti, L., Brumana, R., Roncoroni, F., 2013. Automated detection of repeated structures in building facades. ISPRS Annals of Photogrammetry, Remote Sensing and Spatial Information Sciences, 1(2), 241-246.
Previtali, M., Barazzetti, L., Brumana, R., Cuca, B., Oreni, D., Roncoroni, F., Scaioni, M., 2014. Automatic façade modelling using point cloud data for energy-efficient retrofitting. Applied Geomatics, 6(2), 95-113.
Pu, S., Rutzinger, M., Vosselman, G., and Oude Elberink, S., 2011. Recognizing basic structures from mobile laser scanning data for road inventory studies. ISPRS J. Photogramm., 66(6):S28-S39.
Pu, S., and Vosselman, G., 2006. Automatic extraction of building features from terrestrial laser scanning. Int. Arch. Photogramm. Remote
Sens. Spatial Inf. Sci., Vol. 36(5), pp. 25-27.
Pu, S., and Vosselman, G., 2009, Knowledge based reconstruction of building models from terrestrial laser scanning data. ISPRS J.
Photogramm., 64(6):575-584.
Ripperda, N., and Brenner, C., 2009. Application of a Formal Grammar to Façade Reconstruction in Semiautomatic and Automatic Environments. In: Proc. 12th AGILE Int. Conf., Hannover (Germany), 2-5 June.
Rabbani, T., 2006. Automatic reconstruction of industrial installations using point clouds and images. Ph.D. thesis, Delft University of Technology, Delft (The Netherlands), 154 pages.
Reif, J.H., 1983. Minimum s-t Cut of a Planar Undirected Network in O(n\log^2(n)) Time. SIAM J. Comput., 12(1):71-81.
Silla Jr, C. N. and Freitas, A. A., 2011. A survey of hierarchical classification across different application domains. Data Mining and Knowledge Discovery, 22(1-2), 31-72.
Tóvári, D., and Pfeifer, N., 2005. Segmentation based robust interpolation-a new approach to laser data filtering. Int. Arch.
Photogramm. Remote Sens. Spatial Inf. Sci., Vol. 36(3/W19), pp.
79-84.
Ullrich, T., Schinko, C., Schiffer, T., and Fellner, D.W, 2013. Procedural descriptions for analysing digitized artifacts. Applied
Geomatics, 5(3):185-192.
Vosselman, G., 2004. Fusion of Laser Scanning Dara and Aerial Photographs for Building Reconstruction. Int. Arch. Photogramm.
Remote Sens. Spatial Inf. Sci., Vol. 34(3).