SYNTHETIC APERTURE RADAR (SAR) BASED CLASSIFIERS FOR LAND
APPLICATIONS IN GERMANY
G. Suresh*, R. Gehrke, T. Wiatr, M. Hovenbitzer
Federal Agency for Cartography and Geodesy (BKG), Richard-Strauss-Allee 11, 60598 Frankfurt am Main, Germany (gopika.suresh, ralf.gehrke, thomas.wiatr, michael.hovenbitzer)@bkg.bund.de
SpS9: GALILEO and COPERNICUS
KEY WORDS: LBM-DE, Land cover, polarimetry, SAR, Sentinel-1, Sentinel-2
ABSTRACT:
Land cover information is essential for urban planning and for land cover change monitoring. This paper presents an overview of the work conducted at the Federal Agency for Cartography and Geodesy (BKG) with respect to Synthetic Aperture Radar (SAR) based land cover classification. Two land cover classification approaches using SAR images are reported in this paper. The first method involves a rule-based classification using only SAR backscatter intensity while the other method involves supervised classification of a polarimetric composite of the same SAR image. The LBM-DE has been used for training and validation of the SAR classification results. Images acquired from the Sentinel-1a satellite are used for classification and the results have been reported and discussed. The availability of Sentinel-1a images that are weather and daylight independent allows for the creation of a land cover classification system that can be updated and validated periodically, and hence, be used to assist other land cover classification systems that use optical data. With the availability of Sentinel-2 data, land cover classification combining Sentinel-1a and Sentinel-2 images present a path for the future.
* Corresponding author
1. INTRODUCTION
Information regarding land cover and land monitoring is essential for physical planning, updating land statistics and for quantifying information regarding foliage and biomass. While field surveys are time consuming and expensive, remote sensing techniques offer an efficient and fast alternative. With the initiation of the Copernicus programme, the whole world, and in our case, German federal agencies, have access to free, global and periodic data that can be exploited to extract land cover and land monitoring information. Since the Federal Agency for Cartography and Geodesy (BKG) is responsible for the land monitoring services of the Copernicus programme, three projects have been initiated, one of which is described in this paper. More information regarding the other projects is provided in a simultaneous publication (Wiatr et al. 2016). Sentinel-1a, launched in 2014, was the first satellite to be launched within the Copernicus programme. It is equipped with a C-band (5.6cm) Synthetic Aperture Radar (SAR) that provides weather independent images of the Earth taken during the day and night. A SAR sensor is a coherent, active sensor that transmits a pulse in the microwave frequency onto the Earth’s surface and measures the backscattered signal. The strength and phase of the backscattered signal depends on the physical properties of the target such as geometry or roughness, as well as the electric properties like dielectric composition or permittivity. Thus, a SAR image is a 2D grayscale representation of the imaged Earth surface, where targets of high backscatter intensity will correspond to bright pixels, and vice versa. While modelling land cover, three dominant scattering mechanisms are responsible for the backscattered signals: Surface or odd bounce scattering by the vegetation layer, double bounce scattering originating from the ground trunk interactions attenuated by the vegetation cover (in forests) and volume scattering from the canopy. With C-band frequency, the main interaction of the wave occurs within the top layer of
the canopy and the strength of the backscattered signal is primarily dependent on the properties of the small branches, needles and twigs in the tree crown (Toan et al., 1992). The advantages of using SAR images acquired by Sentinel-1a is not just the high resolution and independence from daylight and weather conditions, but also the periodic imaging of the Earth. While Sentinel-1a has a 12 day repeat cycle, Germany is mapped every 3-4 days during the satellite’s five ascending and six descending orbit tracks. These SAR images can, thus, be used to extract land cover information in Germany, especially in cases where optical sensors fail due to unavailability of cloud-free data (Bruzzone et al. 2004).
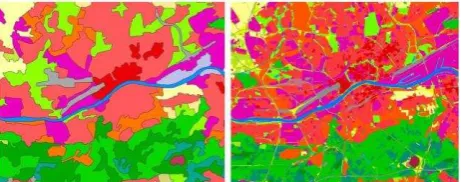
Figure 1. Land cover classes in Frankfurt am Main as seen in the CLC 2006 (left) with a coarser resolution and LBM-DE 2012 (right) The LBM-DE (LBM-DE for Land-Bedeckungs Modell- Deutschland), a product of the BKG, integrates the Basic Digital Landscape Model of the Authoritative Topographic-Cartographic Information System (ATKIS® Basis-DLM) with the Corine Land Cover (CLC) to create a new land cover and land use product. The CLC, first established in Germany in 1990, is a well-known and widely used European land cover product (Hovenbitzer et al. 2014). However, nationwide applications in Germany required a higher spatial and temporal resolution than what the CLC can offer. This prompted the German Federal Agency for Cartography and Geodesy (BKG) to create a national land cover product, titled LBM-DE,
formerly titled DLM-DE (Digital Landbedeckungs Modell- Deutschland) (Fig. 1). The LBM-DE is verified and updated with respect to land cover information using a semi-automated analysis and interpretation of multi-temporal satellite images from medium to high resolution. The LBM-DE uses the CLC
While methods for land cover and land monitoring using optical satellite data exist, and are in use, they are regularly affected by the lack of cloud-free dataset. Though cloud-free, SAR image classification techniques for land cover classification are not so common mainly due to the challenges posed by the special SAR imaging geometry, the complicated SAR scatter process and the presence of speckle noise (Oliver and Quegan 1998). This paper illustrates our first results of land cover classification using Sentinel-1a images. Our aim is to analyse and verify the methods and approaches required to implement a classifier that can provide the land cover classes such as in the LBM-DE implementation of a supervised rule-based land classification system that uses a single SAR image backscatter intensity and differentiates between the various land cover classes. For the second method of classification, a composite image is created from the VV and VH SAR image polarisations and a supervised Support Vector Machine (SVM) based classification is conducted. The results of the two modes of classification shows the scope of land cover classification using Sentinel-1a data when used in combination with open source software and programming languages. We have also provided an example of how more land cover classes can be detected and extracted by combining SAR data with optical images from Sentinel-2. The combination of the German public administration products like the LBM-DE2012 with the products and services of the Copernicus programme provides a cost effective and up-to-date solution for land cover and monitoring applications.
2. TEST SITE AND DATA USED
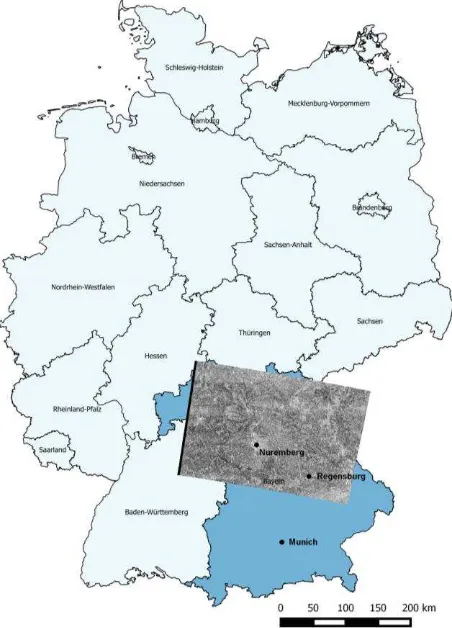
Sentinel-1a images in Interferometric Wideswath mode (IW) and Ground Range Detected (GRD) product type can be downloaded from the Sentinel data hub. The provided GRD products contain amplitude and intensity images in each polarisation (VV and VH) with level 1 processing which includes data projected to ground range using an Earth ellipsoid model, elevation antenna pattern and range spreading loss corrections and thermal noise removal. An IW and GRD image from the 20 Jul. 2015, acquired from a descending orbit, was chosen as maximum foliage is expected around this time, and hence, maximum land cover. The chosen Sentinel-1 image encloses the northern part of the state of Bavaria, in Germany, and covers the cities of Regensburg and Nuremburg. The SAR image and the area enclosed is visible in Fig. 2. The original IW image had a scene size of 250 x 170 km in range and azimuth, respectively, with incidence angle varying from 30° to 45° and pixel spacing of 10m in both range and azimuth.
Typical SAR IW GRD products are not radiometrically corrected which means that the pixel values of the SAR image
do not truly represent the radar backscatter of the reflecting surface, which is important for land cover classification. Hence, the SNAP toolbox, provided by ESA, was used to conduct radiometric calibration after which the sigma nought values were extracted. The sigma nought values of the SAR image were then converted to Decibels and the images were georeferenced to UTM32 to keep consistency with the coordinate system used by the LBM-DE.
Figure 2. Spatial coverage of the Sentinel-1a image from 20 Jul. 2015. Background map © BKG open data maps
Speckle is a multiplicative noise, caused due to the presence of many elemental scatterers with a random distribution within a resolution cell (Moreira et al. 2013) and causes strong fluctuations of the backscattering from one resolution to another. Although it is a noise, it cannot be removed by increasing transmit power because of its multiplicative nature. To reduce speckle, one technique that can be used is multi-looking where a non-coherent averaging of the intensity in an image is conducted (Moreira et al. 2013). Multi-looking causes a reduction in the image resolution, but also reduces speckle and increases information content in the image. Hence, multi-looking with looks of 2 x 2, in range and azimuth respectively, was conducted for the SAR image reducing the pixel spacing to 20m.
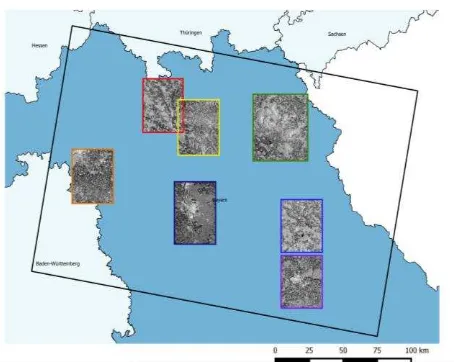
After the post-processing steps were completed, seven test sites were chosen, and subsets for each test site were created (Fig. 3). These sites were selected based on the foliage and the land cover classes visible at each test site. These subsets are approximately 2500 x 2000 pixels or 45 x 35 km in size, in range and azimuth, respectively. The purpose of selecting subsets from the master image was to analyse the LBM-DE classes in each subset, and the corresponding SAR backscatter for each class. These values would then be used to train the classifier.
Figure 3. Spatial coverage of the seven subsets chosen as training for the classifier. The black rectangle represents the extent of the original SAR image from Fig. 2. The test sites numbers are represented by the colour of the subset border, varying as per the rainbow from Violet to Red. This means the border for e.g. Test site No.1 is Violet and Test site No. 7 is Red. Background map © BKG open data maps
3. METHODS
3.1 SAR Land cover classification using a rule-based decision classifier applied on intensity SAR images
The LBM-DE2012, from the year 2012, is used in our training dataset. It contains 36 land cover and 15 land use classes where different attributes are given to polygons fitting into one feature class, and contains a minimum object size of 1ha. Since we are working with land cover information, we utilise only the 36 land cover feature classes in the LBM-DE2012. These classes are named similar to the CLC classes, where each land cover type is given a distinct three digit number, e.g. B211 is used to denote land cover specific to agriculture and B311 to broad leaved trees etc. (Bundesamt für Kartographie und Geodäsie 2012). For the 36 land cover classes, the LBM-DE2012 groups together classes that are closely related to each other and each ‘main theme’ (containing 3-6 sub-classes), is named with an alphabet from A to E. As a brief introduction, the LBM-DE2012 theme A corresponds to objects with features corresponding to urban settlements, B: Agriculture land cover, C: Green pastures, D: Mixed vegetation, E: Sparse vegetation, state of Bavaria, only the LBM-DE2012 for the state of Bavaria was used. Using QGIS (“QGIS Development Team Version 2.1.4 ‘Essen’, 2014), the LBM-DE2012 for Bavaria was clipped further for the extent of the SAR image. Thereafter, the LBM-DE2012 shape files for each test site was clipped from the bigger shapefile, and a vector to raster conversion was conducted to create a rasterised version of the LBM-DE2012 that can be compared with the SAR images. The raster file was assigned numbers from 1 to 8, 1 representing urban settlements, or the LBM-DE main theme A, and 8 representing water, or the LBM-DE main theme H.
Since the LBM-DE2012 raster and the SAR image are now in the same coordinate system and pixel spacing, a mutual comparison and analysis can be conducted. In Python, the LBM-DE2012 raster is, thereafter, compared to only SAR
amplitude image in VV polarisation for each test site. For each LBM-DE main theme, a binary image is created where 1 represents the pixels of belonging to a LBM-DE2012 main theme and 0 to the other pixels. The result of the product of this binary image and the SAR VV amplitude image produces a raster containing the pixels in the SAR image that belong to that LBM-DE2012 land cover theme. Every test site was analysed and SAR backscatter intensities of the pixels in each LBM-DE main theme were extracted. By analysing the backscatter intensities of the pixels corresponding to each LBM class and each test site image, and combining the mean and standard deviations for all the test sites, thresholds were established by determining the upper and lower limit backscatter intensities of pixels within each LBM-DE2012 land cover class. Thereafter, a supervised rule-based classification of the pixels in the SAR image is implemented, where pixels in each land cover class are extracted, grouped together into objects and finally a raster image consisting of the classified land cover classes are obtained (Fig. 5).
3.2 SAR land cover classification using a semi-automatic supervised SVM classifier on a polarimetric composite SAR image
With this method, we aim to evaluate the potential of a single radar image for land cover classification by investigating the correlation between the two SAR polarised images with the single land cover classes corresponding to the main themes of the LBM-DE (Classes A-H).
The GRD data with VH and VV polarizations are used to set up a two-dimensional feature space. It is important to note that these images are raster images while the LBM-DE2012 used is a vector shape file. A pixel-wise supervised classification is performed using the Support Vector Machines (SVM) algorithm provided by the OTB (Chang and Lin 2011) and implemented in QGis (“QGIS Development Team Version 2.1.4 ‘Essen’, 2014). The training areas for the supervised classification are extracted from the LBM-DE2012 after it is modified as follows: An inward buffer of 50 m is applied to the polygons to eliminate errors caused by poor georeferencing (between the raster and vector polygons) and due to transition regions between the different land cover classes Small polygons less than 6,000m² are also removed. Thereafter, a manual inspection of the polygons is carried out to investigate the homogeneity of the training areas. From the remaining areas that cover the test site evenly, 50% of these areas are selected randomly for the training of the SVM classifier. The validation of the classification result is performed by setting up the confusion matrix as described in any standard literature, e.g. Richards, 2013. The LBM-DE2012 polygons with an inward buffer of 50m are used as ground truth. The correlation between single land cover classes can be identified by the matrix values in the confusion matrix.
4. RESULTS AND DISCUSSION
The results of the land cover classification using the two methods described in section 3 are discussed here. Only the classification results for Test site no.1 will be reported.
4.1 Rule based-SAR backscatter dependent Land cover classification.
The rule-based classifier was chosen because of its speed and ease in implementation. The classifier has been programmed and implemented in the programming language Python. Our
analysis of the backscatter intensities of the pixels within each LBM-DE defined main themes, shows that it is difficult to separate some classes from others purely based on backscatter intensities. It is important to note that our test sites do not contain a very significant quantity of pixels corresponding to the LBM-DE main themes of wetlands (G) and sparse vegetation (F). Thus, a quantitative threshold could not be set for these classes. Also, based on our analysis, there is an overlap between the backscatter intensities of the agricultural fields and green pastures, and hence, we grouped all these classes together to form a new class called open land. A similar correlation was seen to exist in the backscatter intensities of the forest regions in SAR images (green in Fig. 4) and mixed vegetation (Cyan in Fig. 4) and hence these two classes were merged into one class named Forest. This is similar to the classification scheme of four classes used by Strozzi et al., 2000.
Figure 4. Trend of SAR backscatter intensities of pixels belonging to each LBM-DE2012 land cover class with respect to the test site analysed. The colours represent the 8 LBM-DE2012 land cover themes shown in the legend
Therefore, we have designed the classifier to only classify and discriminate pixels into four main classes. These are: Urban (corresponding to the land cover theme ‘Urban’ in the LBM -DE2012), open land (combining three LBM-DE2012 land cover themes, mainly ‘agriculture’, ‘sparse vegetation’ and ‘wetlands’), forests (combining two LBM-DE2012 land cover themes, mainly ‘forest’ and ‘mixed vegetation’ class of the LBM-DE) and water (corresponding to the LBM-DE2012 land cover theme ‘water’).
Table 1. SAR land cover classification rules
Once the thresholds for classification are determined (Table.1), the classifier is designed to first classify pixels belonging to the land cover class ‘Urban’, by checking to see which pixels in the SAR image lie within the set threshold. The classifier then produces a binary image where 1 represents the pixels that are within the limits for this class (Fig. 5 top right). Morphological operations, like binary closing, are then used to connect neighbouring pixels into objects and to fill holes in objects (Fig. 5 bottom left). A binary closing, consisting of a dilation (where holes are removed) followed by an erosion of the pixels
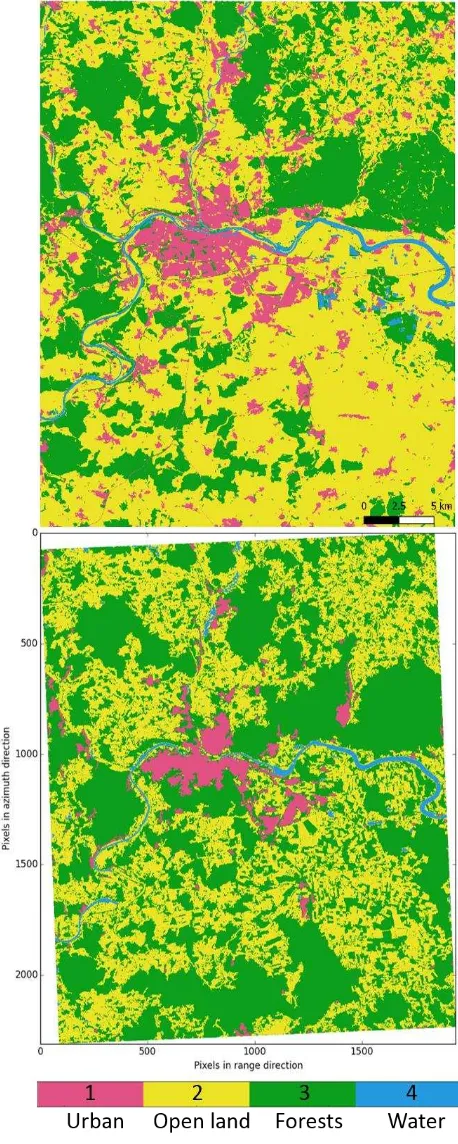
in the image ensures that small individual objects and pixels are removed, and that objects are connected without holes within. Thereafter, the pixels that have satisfied the thresholds set for urban pixels are assigned the class designation 1 in the final image. These pixels are not considered for classification thereafter. The rest of the pixels in the original image are then classified in a similar manner, where the pixels that have been classified into one class are not considered for classification for the next. Fig. 6 shows the SAR land cover classification results on the image covering Test site 1. Our rule-based classifier processed one subset image of 2000 x 2000 pixels in 2s and produced an image of the four major land cover classes that can be visually compared to the LBM-DE raster image.
Figure 5. SAR rule based classification results for the land cover class ‘Urban’ in Test site no.1 (Fig. 3 subset with violet border) Top left: SAR image of test site no. 1 where backscatter intensity varies in dB. Top right: pixels classified in the land cover class ‘urban’, bottom left: objects formed from the classified pixels, bottom right: final classification results for the land cover class ‘Urban’.
The pixels have values from 1-4 where 1 represents the pixels classified with Urban land cover, 2 represents the pixels classified with open land as the predominant land cover, 3 pixels classified with Forest as the predominant land cover and 4, pixels where water is the predominant land cover. The end result of the classification is an image colour coded with the same colours as the LBM-DE so that a visual analysis can be conducted along with the quantitative analysis. The percentages of correctly classified pixels is also obtained in order to quantify the efficiency of the classifier. Quantitative analysis of the number of pixels that were correctly classified, falsely classified and missed is also conducted by comparing with the LBM-DE raster image. The number of pixels correctly classified by the SAR classifier is reported in Table.2. These only correspond to the pixels in each class that have been correctly classified.
Table 2. Classification efficiency for test site no.1
Figure 6. Top: LBM2012-DE colour coded with 4 land cover classes. Bottom: SAR-backscatter based classifier results with the same four classes and colour coding.
4.2 Supervised classification on polarimetric SAR
The supervised classification described in section 3.1.2 was applied to the test sites no.1 and no.6. As this approach has to be transferable to the whole area of Germany to support the production of LBM-DE, no further site-specific modifications of the training areas have been made. Fig. 7 shows the
LBM-DE2012 for test site no. 1 and the classification result of the VV-VH composite. The table 3 presents the confusion matrix of the classification results. The ratios between correctly classified pixels in a class (elements on the diagonal) and the sums of pixels in a class on the map (or reference) is different on both test sites, but the correlations between classes highlighted in the table 3 is common for both test sites. The class water is the only class that can be separated very well from all other classes except for agriculture. All other classes have strong correlations with each other, for example urban with agriculture and forest, green fields with agriculture and forests and, hence, cannot be separated efficiently using this approach.
Figure 7. LBM-DE2012 source data (top) and supervised SVM classification results from the VH-VV composite of the SAR image from 20 Jul. 2015 (bottom) colour coded as eight classes
Table 3. Covariance matrix for the supervised land cover classification
5. DISCUSSION AND FUTURE WORK
Two methods of land cover classification using SAR amplitude images have been tested and the results have been reported in this paper. It is important to note that the LBM-DE2012 used for training and as validation for this study is from the year 2012, whereas our SAR image is from 2015. Land cover changes between the years 2012-2015 is to be expected, and this might provide a justification for some falsely classified pixels in our SAR classification results in places where the LBM-DE2012 is not up to date. This problem will be eliminated in the future by comparing the SAR classification results with the LBM-DE2015, planned to be released by the end of 2016.
We will first discuss the results of the land classification using only the SAR backscatter acquired in a single polarisation. For the rule-based classification based on SAR amplitude image, we were able to classify the pixels into only four land cover classes, rather than the seven that are produced by the LBM-DE. This is similar to the technique used in Taubenboeck and Thiel, 2010 performed. Our classification results, even after merging the classes is still poor and, hence, it suffices to say that just a rule-based approach rule-based on a single image SAR backscatter is not sufficient for an efficient classification of land cover classes. By including texture features, or geometric features of objects as criteria for classification, our results may be further improved. However, the results of land cover classification using a rule-based classifier such as the one reported in this paper are promising to get an overview of land cover classes in the region. What is immediately visible in Fig. 6 is that many pixels have been mis-classified as the land cover class forest, especially the pixels close to urban areas. This was expected, as the backscatter intensities of pixels in the two classes were observed to be very similar when we conducted our backscatter analysis of the training dataset. It is important to note that the LBM-DE2012 has certain classes, like the B113 class, which consists of 30%-50% manmade structures, which comes under the ‘Urban’ main theme of the LBM-DE2012. These areas may be classified as ‘Forests’ by the SAR classifier, due to the presence of 50% vegetation in this area, causing mis-classification. This problem can be eliminated when using the LBM-DE2015 as it contains new class definitions to improve
the class separation in areas containing manmade-objects and vegetation. Another reason for high backscatter in a region mainly covered by forests could also be due to the incidence angle of the SAR sensor, and a way to eliminate this problem will be to use another image of the same region acquired in an ascending orbit. This must be analysed further in the near future.
Coming now to the second approach, where supervised classification of a VV-VH composite image is performed, we conclude that from only one radar scene poor classification results can be expected. The classes green fields and agriculture have a strong correlation due to their similar reflection characteristic of radar radiation (Taubenboeck and Thiel 2010). However, we attempted to classify the SAR polarimetric composite into seven land cover classes as our aim was to analyse and verify if such a classification technique could provide land cover classes consistent with the LBM-DE classes. We conclude, once again, that one SAR scene is insufficient for land cover classification and a large multi-temporal dataset needs to be used.
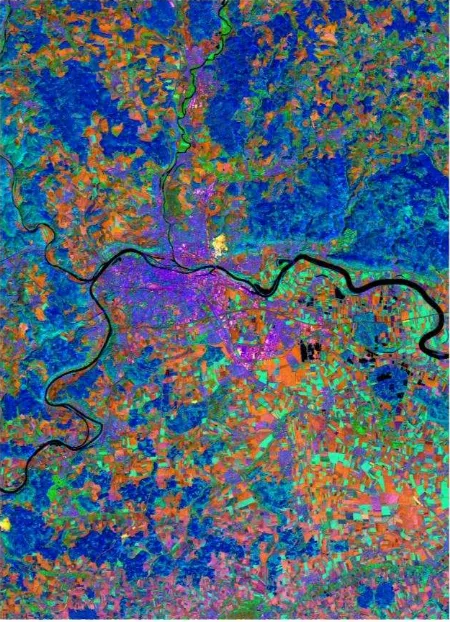
The main problem of land cover classification with optical data, is that we acquire limited cloud free coverage per year. This problem can be resolved by combining the optical dataset with SAR images acquired on other days in a year. This fusion between Optical and SAR images will enhance the classification process. Fig. 8 shows an example of a RGB composite of an optical image acquired by Sentinel-2 and a SAR image acquired by Sentinel-1a on a different day. Different types of land cover like urban, forests, agriculture can be clearly distinguished in this composite image. Classification of image composites such as the one shown in Fig. 8 will be the next step for the future.
Figure 8. RGB composite of Sentinel-2 (RED), Sentinel-2 (NIR), Sentinel-1a (VH). The Sentinel-2 image is from 16 Mar. 2016 and Sentinel-1a image is from 20 Jul. 2015. Urban areas are seen in pink-violet, Agriculture in orange-light green, Forests in light blue-dark blue and water in black. Man-made open pits are clearly visible in yellow.
ACKNOWLEDGEMENTS
We would like to thank the Copernicus programme for providing the data and ESA for the SNAP toolbox. Special thanks to Christine Wende, Friederike Emig, Katja Happe, Gabriele Runkel and Viola Brandel of the LBM-DE team at the BKG, for their support and encouragement. This work would not be possible without the developers of QGis and Python.
REFERENCES
Bruzzone, L., Marconcini, M., Wegmüller, U., and Wiesmann, A.,
2004. “An Advanced System for the Automatic Classification of
Multitemporal SAR Images.” IEEE Transactions on Geoscience and
Remote Sensing 42 (6): 1321–34.
Bundesamt für Kartographie und Geodäsie. 2012. “Digitales Landbedeckungsmodell Für Deutschland: LBM-DE2012.” Frankfurt am Main.
http://www.geodatenzentrum.de/geodaten/gdz_rahmen.gdz_div?gdz_sp r=deu&gdz_akt_zeile=2&gdz_anz_zeile=4&gdz_user_id=0.
Chang, C.-C., and Lin, C.-J., 2011. “LIBSVM: A Library for Support
Vector Machines.” ACM Transactions on Intelligent Systems and
Technology 2 (3): 1–27.
Hovenbitzer, M., Emig, F., Wende, C., Arnold, S., Bock, M., and Feigenspan, S., 2014. “Digital Land Cover Model for Germany -
DLM-DE.” In Land Use and Land Cover Mapping in Europe:Practices and
Trends, edited by Ioannis Manakos and Matthias Braun, 255–72.
Dordrecht. doi:10.1007/978-94-007-7969-3.
Moreira, A., Prats-Iraola, P., Younis, M., Krieger, G., Hajnsek, I., and Papathanassiou. K. P., 2013. “A Tutorial on Synthetic Aperture Radar,”
IEEE Geoscience and remote sensing magazine, March 2013.
Oliver, C.J., and Quegan. S., 1998. Understanding Synthetic Aperture
Radar Images. Norwood: MA: Artech House.
Python Software Foundation. “Python Language Reference, Version 2.7.” www.python.org.
“QGIS Development Team Version 2.1.4 ‘Essen’ , QGIS Geographic Information System. Open Source Geospatial Foundation Project.” 2014. http://qgis.osgeo.org.
Richards, J.A. 2013. Remote Sensing Digital Image Analysis: An
Introduction. Heidelberg: Springer-Verlag.
Strozzi, T, Dammert P.B.G., Wegmuller, U., Martinez, J. M., Beaudoin, A., Askne, J., and Hallikainen. M., 2000. “Landuse Mapping
with ERS SAR Interferometry.” IEEE Transactions on Geoscience and
Remote Sensing 38 (2): 766–775.
Taubenboeck, H., and Thiel, M., 2010. “Landbedeckungsklassifikation Der Stadt-Umland-Region Muenchen Und Analyse Ihrer
Raumzeitlichen Entwicklung.” In Fernerkundung Im Urbanen Raum,
45–51. Darmstadt: WBG.
Toan, T, Beaudoin, A., and Rioq, J., 1992. “Relating Forest Biomass to
SAR Data.” IEEE Transactions on Geoscience and Remote Sensing 2:
403–11.
Wiatr, T., Suresh, G., Gehrke, R., and Hovenbitzer, M., 2016.
“Copernicus- Practice of Daily Life in a National Mapping Agency?” In
ISPRS Congress Archives. Prague.
