AUTOMATIC EXTRACTION OF DUNES FROM GOOGLE EARTH IMAGES NEW
APPROACH TO STUDY THE DUNES MIGRATION IN THE LAÂYOUNE CITY OF
MOROCCO
D. Dakir1, H. Rhinane1, O. Saddiqi1, E. El Arabi1, L. Baidder1
1 Geosciences Laboratory, Faculty of Sciences Ain Chock, University Hassan II of Casablanca – [email protected]
KEY WORDS : Google Earth. Dune movements. Spatial analysis. Laâyoune. Morocco.
ABSTRACT:
In desert environments, the sandy dune movements are considered as the main threat to the livelihoods and productivity of people living in Laâyoune city, South of Morocco. Studying dunes at a large scale requires intensive fieldwork and a huge dataset. But this task is not always easy because of the high cost and the limited availability of data. In this paper we present a new approach to study and evaluate the dune dynamic using Google earth archive image acquired from 2005, 2011, 2012, and 2013. To achieve this goal, an area with 3577 meter square including 40 barchan dunes, were selected, and the barchan dunes were automatically extracted from these images using Geographic Information System (GIS) and spatial analysis techniques provided by image processing software. The result shows not only the dune shape but also direction of dunes movements, and distance separating dunes. The obtained direction is ranging from North east to South west. The average rate of movement of the extracted dunes between 2005 and 2013 was calculated and is estimated at 32m per year. Validation of these dunes movement of the Laâyoune city was confirmed by the field data and previous studies.
1. INTRODUCTION
Sandy dune movement is considered as one of the most serious environmental and socioeconomic problems in Morocco especially in the southern zone where the climate is dry and arid (Alalia and Benmohammadi 2013). However, infrastructures existing in its path (Sahraoui 2008; Niang 2008; Mahyou et al 2010; Benalla et al 2003; Alali et al many scientific studies have been undertaken in these desert environments. The descriptive study of these environments has qualified extensive sands located between Tarfaya in Morocco and Mauritania as Sand River (Clos-Arceduc 1967). Some authors have focused on the morphological study of dunes (Finkel et al. 1959; Elbelrhiti 2005; Guignier 2014; Sauermann 2000). The morphodynamic sand dune has been well studied since 2005 (Elbelrhiti 2005; Elbelrhiti and al speed and dune dynamics (Bagnold et al 1941; Twidale 1972; Tsoar et al 2004; Khatteli and Belhaj 1994; Hersen 2004).
To learn more about these vast and inaccessible areas, remote sensing has been widely used (robin and Bousquet 2002; Bodart and Ozer 2009). Thus, satellite images and aerial photographs were used to study the dune morphodynamics of the Moroccan Sahara (Elbelghiti, 2010). The satellite images are also often used to study and monitor desertification (Mainguet et al. 2001, Elhadi et al. 2009). Given the free accessibility of Landsat images, several researches have been focused on the potential of these data. So they were used to discriminate different classes of dunes in China (Liu, Haijiang et al. 2008). The Landsat Thematic Mapper (TM) and the Enhanced Thematic Mapper (ETM+) were also examined to understand the movement of the dunes (Parker 1999, Wang et al. 2007). The capabilities of ASTER, Quick bird and Lidar images have been tested to study sand source, transport, and pathways, morphology and migration of sand dunes (Bourke et al. 2009; Bubenzer and Bolten 2008; Bullard et al. 2011, Hesse 2009, Hugenholtz and Barchyn, 2010; Vermeesch, and Drake 2008). Multi-temporal Landsat TM images have been also explored to analyze dune dynamics at the dune-field scale (Ihab and Verstraeten 2012). From all these researches using low spatial resolution to analyze sandy dunes, there are few studies at high spatial resolution, some attempts started to map dunes of cap Juby Morocco using SPOT images (Mering and Oulehri 1994). SPOT images were also used for automated extraction of sand dune encroachment (Ghadiry et al. 2012; Hermas et al 2012). Despite the high spatial resolution of these images, their cost is very high, which has led some authors to exploit the potential of Google Earth images. Such images often used for visualization, have undergone a process of mathematical morphology in order to extract olive trees covered by small sand dunes (Venard et al. 2010).
In this paper we present a new approach to study and evaluate the dune dynamic using Google earth archive image of
This contribution has been peer-reviewed.
Laâyoune city South of Morocco acquired from 2005, 2011, wide opening on the Atlantic Ocean. Its area is over sq Km 142,865 which cover 20% of the national area.
Figure 1. Location of the study ar
The climate of the region is semi-arid Saharan climate, cold in winter, hot and dry in summer, marked by the scarcity of rainfall on the coastal strip. The temperatures are moderate and influenced by the proximity of the Atlantic Ocean. Rainfall amounts are generally low and unevenly distributed in space, with short thunderstorms. Wind is a climate factor which determines the most socio-economic patterns of populations of the Sahara. All their activities are programmed according this system, which is very well known to the nomads. Throughout the year, winds blow on the region. The average monthly maximum wind speeds are nearly constant. It varies between 15.4 to 19.2 m/s with an average of about 17.6 m/s (63.4 km/hour). A maximum was recorded in May 1982 with a speed of about 130 km/hour.
In Laâyoune city, four dune corridors extend over several tens of kilometers in the direction of prevailing winds (Hersen 2004). These corridors are well separated and their properties, density, average size of dunes and wid
different from one corridor to another. The most recognized dune form in the region is barchans (Elbelghiti 2008; Lekouch et al. 2010). These barchans are formed only in the desert where winds blow generally in one direction throughout the year. The dunes of the study area are characterized by at most a hundred meters both long and wide and ten metersheight. In our study area, the barchans move relatively quickly in the direction of the wind. This mobility is responsible for economic, ecologica
problems due to barchans, e.g. Figure 2.
These mobile crescent-shaped dunes are considered as the fastest in the world, with an average speed of about 30 meters/year for dunes with 9 meters height. As they are isolated objects, it is easy to observe their shape and study their contour.
Laâyoune city South of Morocco acquired from 2005, 2011,
STUDY AREA
The area covered by this study is the Laâyoune Sakia El ). It is the largest city in Moroccan Sahara and occupies the central part of the Sahara with a wide opening on the Atlantic Ocean. Its area is over sq Km 142,865 which cover 20% of the national area.
Location of the study area
arid Saharan climate, cold in winter, hot and dry in summer, marked by the scarcity of rainfall on the coastal strip. The temperatures are moderate and influenced by the proximity of the Atlantic Ocean. e generally low and unevenly distributed in space, with short thunderstorms. Wind is a climate factor economic patterns of populations of the Sahara. All their activities are programmed ell known to the nomads. Throughout the year, winds blow on the region. The average monthly maximum wind speeds are nearly constant. It varies between 15.4 to 19.2 m/s with an average of about 17.6 m/s (63.4 km/hour). A maximum was recorded in May
In Laâyoune city, four dune corridors extend over several tens of kilometers in the direction of prevailing winds (Hersen 2004). These corridors are well separated and their properties, density, average size of dunes and width, are very different from one corridor to another. The most recognized dune form in the region is barchans (Elbelghiti 2008; Lekouch et al. 2010). These barchans are formed only in the desert where winds blow generally in one direction r. The dunes of the study area are characterized by at most a hundred meters both long and height. In our study area, the barchans move relatively quickly in the direction of the wind. This mobility is responsible for economic, ecological and social
shaped dunes are considered as the world, with an average speed of about 30 meters/year for dunes with 9 meters height. As they are isolated objects, it is easy to observe their shape and study
Figure 2. Sandy dunes threatening Laâyoune region infrascture. a Dunes and urban area. b Sandy dunes crossing
the road.
The choice of images was conditioned by the availability and especially the quality of images during the processing. Indeed, the first Google Earth images available for this study area are from 2005.However, no Google Earth image was found from 2006 to 2008 and also the images quality from 2009 and 2010 were not too
images corresponding to the four dates (2005, 2011, 2012, and 2013) were extracted and processed in a GIS software.
3.2 Methodology
The implemented methodology for
of dune movements in Laâyoune on different dates is described in figure 4.
In this study, the images of the study area were geo referenced using the WGS 84 geographic coordinates four control points identified on Google Earth images. were then projected in the local system, the Lambert
Sandy dunes threatening Laâyoune region infrascture. a Dunes and urban area. b Sandy dunes crossing
road.
DATA USED AND METHODOLOGY
The delimitation of the study area was made from Google Earth images acquired at different times (2005, 2011, 2012,
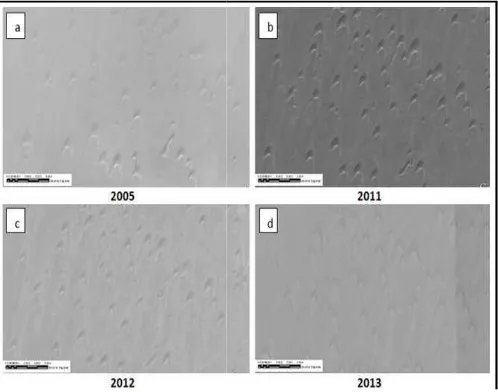
Google Earth images scene acquired in (a 2005, b 2011, c 2012, d 2013)
The choice of images was conditioned by the availability and especially the quality of images during the processing. Indeed, the first Google Earth images available for this study area are from 2005.However, no Google Earth image was found from 2006 to 2008 and also the images quality from satisfactory. Therefore, four images corresponding to the four dates (2005, 2011, 2012, and 2013) were extracted and processed in a GIS software.
implemented methodology for spatio-temporal analysis of dune movements in Laâyoune on different dates is
Conformal Conic, zone 3. The The mean square error is in the order of 0.2 pixels.
The operation performed by the Focal Statistics tool computes an output raster using the neighbourhood of each pixel (Figure 4). The value for each output cell is calculated from the values of all the input cells located in a specified neighbourhood around that cell of interest. A statistical function such as the maximum, average, or sum is performed on the input cell value and all values of cells in its neighbourhood. The neighbourhood can be defined as circle, rectangle, annulus or wedge with the number of cells to include. For our image, a 3x3 rectangular neighbourhood and average function were used to classify the image.
Figure 4. Focal statistic process
The focal statistics results in a raster of 15 classes where the dune shape is discerned and each class presented in a gray level (Figure 5).
Figure 5: Focal Statistics results (a 2005, b 2011,
c 2012, d 2013)
During this step, each class is affected either to a dune or a non-dune area using, primarly the photo interpretation, and secondly our knowledge of the study area. The reclassify tool under spatial analyst in ArcGIS allows obtaining from these 15 classes only 2 classes: sand dune was given the value 1, the other classes were given the value 0. Binary images were
created from the results of the previous classification leading to the distinction of two classes: non dunes and dunes (Figure 6).
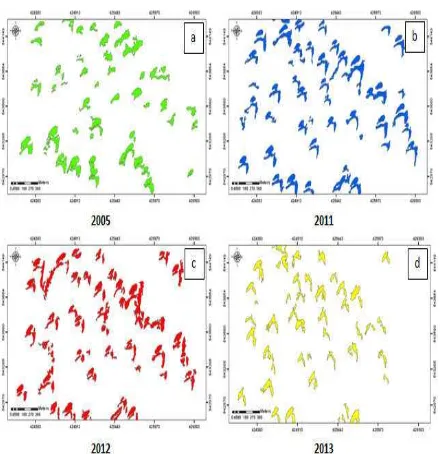
Figure 6: Binary images: dunes in yellow color (a 2005, b 2011, c 2012, d 2013)
Binary raster images were then converted to vector layers which result in polygons of dunes. The “smooth polygons” tool allowed us to improve the dune contours by enhancing the aesthetic and cartographic dune quality using polynomial approximation with exponential Kernel (PAEK) as polygon smoothing algorithm with a tolerance greater than zero. The aggregation operation consists in combining different parts of a polygon based on a distance greater than zero between the polygon boundaries to maintain the geometric characteristics of the entity. This step allowed us to combine the parts of the same dune that are not unified in the classification (Figure 7)
Figure 7: Aggregated dunes polygons (a 2005, b 2011, c 2012, d 2013)
This contribution has been peer-reviewed.
4. RESULT AND DISCUSSION
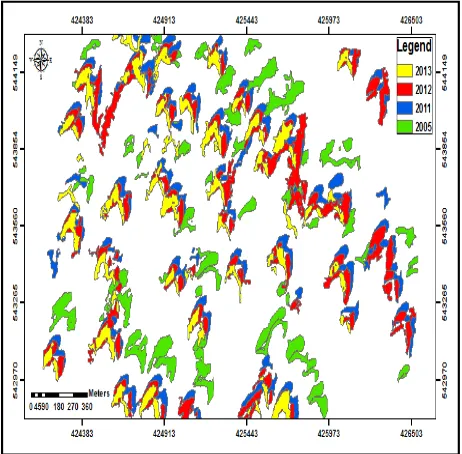
This study relied on the use of image resources available in the archives of Google Earth. The approach based on the automatic extraction of dunes covering a period of 8 years, allowed us to clearly identify the dunes in the study area. The most common form is barchans. The number of barchans studied is 40 covering an area of 3577m². The overlapped dune layers (Fig. IV- 45) resulting from different dates let us notice the dune migration. It should be noted the most important movement occurs from 2005 to 2011, whereas the movements during one year (from 2011 to 2012 or 2012 to 2013) are approximately the same.
Figure 8: Overlapped barchans dunes layers
Both characteristics sought in this study (movement speed and direction) were determined from the geographical position of the same barchan acquired at different dates. Thus, we calculated the coordinates of the centroid of each dune and then drew a line segment linking it to the centroid of the dune in the next date. This segment represents the distance traveled by the dune in an interval time between the two dates (Figure 9).
Figure 9: Determination of distance and direction of dune mobility
Where T0 is the date of acquisition of the first image (e.g.: 2005), T1 is the date of acquisition of the next image (e.g.: 2011), D is the distance covered by the dune between T0 and T1, α is the azimuth angle formed by the distance segment. The ratio of distance and time gives annual mobility rate of the dune. The results of this study lead to an average speed of moving dunes about 30 meters per year. The azimuth tell about the direction of dune movement which is the NE to the SW (Figure 10).
Figure 10: Rate of migration of the dune
by field observations and previous work and thus are satisfactory.
5. CONCLUSION
This study was conducted in the Laâyoune Sakia El Hamra region to contribute to the understanding of sand encroachment and monitoring of this destructive phenomenon. We performed a new approach based on the automatic extraction of dunes to study and analyze the dynamics of dune in Laâyoune from free Google Earth satellite images. In addition, the high spatial resolution of data was used to characterize the Saharan landscape of the region. This is then sufficient to identify specific dune shapes in our study area. These images provide valuable geographic information seeing if automatic GIS tools are available. The automatic analysis of these images has been implemented using GIS and spatial analysis techniques provided by image processing software.
The first results show that with the free Google Earth images, we obtained a fairly good spatio-temporal classification. This spatio-temporal evaluation then allowed us to map the dunes, monitor their evolution, deduce their mobility and determine the speed and direction of dune mobility.
It is obvious that the Saharan environment presents climatic and topographic constraints which sometimes make it an inaccessible territory. Therefore, any field study involves a huge investment of time, effort and money to make direct in situ measurements. However the proposed approach has proved limited when images of some dates are unavailable or of poor quality. Geographic objects with heterogeneous radiometry are also a handicap for this kind of approach. Despite these limitations, this study could constitute a decision-making support tool for local authorities in major development orientations in homogeneous desert areas and especially in terms of planning for the urban extension of the city.
ACKNOWLEDGEMENTS
The authors would like to acknowledge Hassan II academy of science Morocco for funding and support
REFERENCES
Alali A, Benmohammadi A (2013) l'ensablement dans la plaine de Tafilalet (Sud Est du Maroc) Larhyss Journal, ISSN 1112-3680, n°16, Décembre 2013, pp. 53-75.
Bagnold R (1941) The physics of blown sand and desert dunes. Methuren and company London (265).
Benalla M, Alem E.M, Rognon P, Desjardins R, Hilali A, Khardi A (2003), Les dunes du Tafilalet (Maroc) : dynamique éolienne et ensablement des palmeraies. Science et changements planétaires / Sécheresse. Volume 14, Numéro 2, 73-83, Avril 2003.
Bodart C, Ozer A (2009) Contribution of remote sensing in the study of the wind erosion processes in the Gouré region (southeast Niger). Geo-Eco-Trop, 2009, 33, n.s.: 57 – 68.
Bouchrafa S (2011) Le phénomène d’ensablement dans le sud-ouest la région d’Ain Sefra. Conditions, facteurs, et impact sur l’environnement. Mémoire de thèse de l’université d’Oran, Es Sénia. Algérie, 112 p.
Bourke M. C, Ewing R. C, Finnegan D, McGowan H. A (2009) Sand dune movement in the Victoria Valley, Antarctica. Geomorphology, 109, 148–160.
Bubenzer O, Bolten A (2008) The use of new elevation data (SRTM/ASTER) for the detection and morphometric quantification of Pleistocene megadunes (draa) in the eastern Sahara and the southern Namib. Geomorphology, 102, 221– 231.
Bullard J. E, White K., Livingstone I (2011) Morphometric analysis of aeolian bedforms in the Namib Sand Sea using ASTER data. Earth Surface Processes and Landforms, 36, 1534–1549.
Clos-Arceduc A (1967) Les fleuves de sables entre le Maroc et la Mauritanie, et la théorie des barkhanes. C. R. Acad. Sci., Paris, série D, vol. 261, p.3637- 3639.
Elbelrhiti H (2005) Morphodynamique des barkhanes Etude des dunes du Sud-Ouest Marocain, Mémoire de thèse de l’Université DENIS DIDEROT Paris VII, 160p.
Elbelrhiti H, Douady S (2010) Equilibrium versus disequilibrium of barchan dunes, Geomorphology xxx (2010) xxx–xxx, GEOMOR-03416; No of Pages 11.
Elbelrhiti H (2012) Initiation and early development of barchan dunes: A case study of the Moroccan Atlantic Sahara desert. Geomorphology 138 (2012) 181–188.
Elbelrhiti H, Andreotti B, Claudin P (2008) Barchan dune corridors: Field characterization and investigation of control parameters. Journal Of Geophysical Research, Vol. 113, F02S15, doi:10.1029/2007JF000767, 2008.
Elbelrhiti H, Claudin P, Andreotti B (2005) Field evidence for surface-wave-induced instability of sand dunes, Vol 437|29 September 2005|doi:10.1038/nature04058.
Elbelrhiti H (2015) Field evidence of appearance and disappearance of the brink line on barchans. Aeolian Research 18 (2015) 115–120.
Elbelrhiti H (2010) commentaire sur l’article intitulé “essai de morphométrie sur un système dunaire du sud-ouest marocain à partir d’une image LandSat d’Imad Lekouch et al. SÉCHERESSE 2010; 21(1):54-62].
Elhadi E M, Zomrawi N, Guangdao Hu 2009 Landscape Change and Sandy Desertification Monitoring and
This contribution has been peer-reviewed.
Assessment. American Journal of Environmental Sciences 5, 633–638.
El Ghannouchi A (2007) Dynamique éolienne dans la plaine de Souss: Approche modélisatrice de la lutte contre l’ensablement, Mémoire de thèse de l’Université Mohammed V – Agdal Faculté Des Sciences, Rabat, Maroc, 193p.
Finkel. H. J (1959) The barchans of southern Peru. Journal of Geology, vol. 67, p. 614-647.
Ihab N.L.M, Verstraeten G. (2012) Analyzing dune dynamics at the dune-field scale based on multi-temporal analysis of Landsat-TM images. Remote Sensing of Environment. 119 (2012) 105–117.
Ghadiry M, Shalaby A, Koch B (2012) A new GIS-based model for automated extraction of Sand Dune encroachment case study: Dakhla Oases, western desert of Egypt. The Egyptian Journal of Remote Sensing and Space Sciences 15, 53–65.
Guignier L (2014) Analyse physique du transport sédimentaire et morphodynamique des dunes, Mémoire de thèse de l’Université Rennes 1, 200p.
HermasE, LeprinceS, Abou El-Magd I (2012) Retrieving sand dune movements using sub-pixel correlation of multi-temporal optical remote sensing imagery, northwest Sinai Peninsula, Egypt Remote Sensing of Environment 121 (2012) 51–60.
Hersen P, Andersen K. H, Elbelrhiti H, Ndreotti B, Claudin P, Douady S (2004) Corridors of barchans dunes: Stability and size selection. Physical Review E 69, 011304 -2004.
Hesse R (2009) Using remote sensing to quantify aeolian transport and estimate theage of the terminal dune field Dunas Pampa Blanca in southern Peru. QuaternaryResearch, 71, 426–436.
Hugenholtz C. H, Barchyn T. E (2010) Spatial analysis of sand dunes with a new global topographic dataset: New approaches and opportunities. Earth Surface Processes and Landforms, 35, 986–992.
Khatteli H, Belhaj N (1994) La dynamique des dunes dans le Sud-Ouest Tunisie. Science et changements planétaires / Sécheresse. Volume 5, Numéro 4, 245-9, Décembre 1994, Note originale.
Lekouch I (2010) Essai de morphométrie sur un système dunaire du Sud- Ouest marocain à partir d’une image LandSat. Sécheresse 2010 ; 21 (1) : 54-62.
Haijiang L, Chenghu Z, Weiming C, En L, Rui L (2008) Monitoring sandy desertification of Otindag Sandy Land based on multi-date remote sensing images. Acta Ecologica Sinica. 28 (2), 627–635.
Mahyou H, Tychon B, Balaghi R, Mimouni J, Paul R (2010) Désertification des parcours arides au Maroc. Tropicultura, 2010, 28, 2, 107-114.
Mainguet M, Dumay F, Oould El Hacen M. L, Maefoudh A (2001) Diagnostic par la télédétection d’un changement de rythme de la dynamique éolienne : période d’amorce de la désertification en Mauritanie saharo-sahélienne. Télédétection, vol. 2, n° 2, p. 129-136.
Mering C, Oulehri T (1994) Cartographie Automatique des barkhanes à partir d’images SPOT panchromatique l’exemple du Cap Juby au Maroc. Actes du 2e Colloque Africain sur la recherche en informatique, Ouagadougou, pp. 605–628.
NIANG A J (2008) Les processus morphodynamique, indicateurs de l’état de la désertification dans le sud-ouest de la Mauritanie. Approche par analyse multi source. Mémoire de thèse de l’Université de Liège, 286p.
Nouaceur Z (2013) Nouakchott, une capitale au péril des vents de sable, de l’ensablement et des inondations. Sécheresse 2013 ; 24 : 182–93.
ROBIN M, Bernard BOUSQUET B, Apport de la télédétection optique et radar à l'étude de la région de Douch dépression de Kharga, Nouvelle Vallée, désert occidental d'Egypte. Science et changements planétaires / Sécheresse. Volume 13, Numéro 1, 27-36, Mars 2002.
Parker Gay S (1999) Observations regarding the movement of barchan sand dunes in the Nazca to Tanaca area of southern Peru. Geomorphology, 27, 279–293.
SAHRAOUI A (2008) Erosion éolienne et risque d’ensablement dans la région de Barika : Approche quantitative et cartographie automatique. Mémoire de thèse Université El Hadj Lakhder-Batna Faculté des Sciences Département des Sciences de la Terre, Algérie, 132p.
Sauermann, G, Rognon, P, Poliakov A, Hermann H. J(2000) The shape of barchan dunes of
Southern Morocco. Geomorphology, vol. 36, p. 47-62.
Tsoar H, Blumberg D. G, Stoler Y (2004) Elongation and migration of sand dunes. Geomorphology, 57, 293–302.
Twidale C. R (1972) Evoluation of sand dunes in the Simpson Desert, Central Australia,Transactions of the Institute of British. Geographers, 56, 77–106.
Vermeesch P, Drake N (2008) Remotely sensed dune celerity and sand fluxmeasurements of the world's fastest barchans (Bodele, Chad). Geophysical Research Letters, 35.
Wu W (2003) Application de la géomantique pour l’étude de la dynamique environnementale en zones arides, Exemple de la région de Nouakchott en Mauritanie, du Ningxia nord et du Shaanxi nord en Chine du nord-ouest. Mémoire de thèse en géographie, université de Paris I, 230 p.
Yao Z. Y, Wang T, Han Z.W, Zhang W. M, Zhao A. G (2007 Migration of sand dunes on the northern Alxa Plateau, InnerMongolia, China. Journal of Arid Environments, 70, 80–93.
This contribution has been peer-reviewed.