ON DATA QUALITY ASSURANCE AND CONFLATION ENTANGLEMENT IN
CROWDSOURCING FOR ENVIRONMENTAL STUDIES
D. G. Leibovici a,*, B. Evansb, C. Hodges b, S. Wiemann c, S. Meek a, J. Rosser a, M. Jackson a
a
Nottingham Geospatial Institute, University of Nottingham, UK - (didier, sam, julian, mike).lastname@nottingham.ac.uk b
Department of Geography and Earth Sciences, Aberythwyth University, [email protected], [email protected] c
Technische Universität Dresden, Germany, [email protected]
KEY WORDS: Data Curation, Data Quality, Data Fusion, Data Conflation, Citizen Science, Crowdsourcing
ABSTRACT:
Volunteer geographical information (VGI) either in the context of citizen science, active crowdsourcing and even passive crowdsourcing has been proven useful in various societal domains such as natural hazards, health status, disease epidemic and biological monitoring. Nonetheless, the variable degrees or unknown quality due to the crowdsourcing settings are still an obstacle for fully integrating these data sources in environmental studies and potentially in policy making. The data curation process in which a quality assurance (QA) is needed is often driven by the direct usability of the data collected within a data conflation process or data fusion (DCDF) combining the crowdsourced data into one view using potentially other data sources as well. Using two examples, namely land cover validation and inundation extent estimation, this paper discusses the close links between QA and DCDF in order to determine whether a disentanglement can be beneficial or not to a better understanding of the data curation process and to its methodology with respect to crowdsourcing data. Far from rejecting the usability quality criterion, the paper advocates for a decoupling of the QA process and the DCDF step as much as possible but still in integrating them within an approach analogous to a Bayesian paradigm.
1.! INTRODUCTION
Under the generic term of crowdsourcing, data collected from the public as volunteer geographical information (VGI), is becoming an increasingly hot topic in data sciences for its potential use in many disciplines. Social media and big data often supply geolocated information gathered from the web using dedicated API (e.g., Twitter data). Other more participative data collection is identified as citizen science where bespoke web services and mobile apps allow citizens to contribute to environmental observations (e.g., www.ispotnature.org, www.brc.ac.uk/irecord) and reporting events that can be used scientifically in research and policy making (Pocock et al., 2014; Haklay, 2015; Craglia and Shanley, 2015).
From providing timely information, cheap and densified observations, VGI brings opportunities for better understanding and monitoring of various societal and natural phenomena. This added value comes after merging, integrating and combining the VGI data into a single view while possibly reusing other data sources. This process is termed data conflation or data fusion (DCDF) in this paper with the idea of representing a range of methods according to the heterogeneity of the datasets used and the aimed result. A considerable body of literature has discussed the data quality issues attached to this type of data along with its spatial characteristics and a-spatial characteristics (Flanagin and Metzger, 2008; Fowler et al., 2013). Specificities of the quality assurance1 when collecting crowdsourced data or citizen science data (Alabri and Hunter, 2010; Goodchild and Li, 2012; Bordogna et al., 2014; Meek et al., 2014) are contributing to
*Corresponding author
1 Quality assurance (QA) is defined as a set of data policy, controls and tests put in place in order to be able to meet specific requirements. In our context quality controls (QC) are computational operations that ouputs quality values according to specified measures.
better designs on how to qualify the volunteered captured data as a single observation or as part of a dataset. What all the different approaches agree on is the multidimensional aspect of quality, essential in crowdsourcing and citizen science. Intrinsically this causes a tendency for QA and DCDF processes to be entangled. The European FP7 COBWEB project (www.cobwebproject.eu) is proposing a survey design tool including an authoring tool to combine different quality controls (QC) within a workflow that will serve as a QA for a particular case study (Meek et al., 2014; Jackson et al., 2014); the data collected is then made available for a DCDF within a completed data curation2 process (Wiemann and Bernard, 2010; Wiemann et al., 2015; Jackson et al., 2014).
In practice even though generic QCs, used within a complete workflow encapsulating the whole QA process, provide the logic and reasoning of attaching a quality that clarifies the uncertainty of data captured, the QA composition is mainly driven by the future use of the data. It can even happen that the quality elements are assessed within a DCDF workflow process or algorithm itself, either as part of the QA or completely independently. This is reminiscent of a statistical modelling approach in which after or during the model fitting, the error distribution is derived and attached to each observation. This paper discusses the different advantages or disadvantages that may arise when integrating or separating the QA and DCDF processes and proposes recommendations. Two examples, described below, of VGI data collection and usage serve as the basis of exploring these possible entanglements.
2 Data curation is defined as the collection of organised settings and
actions within a system that are in place along the data life cycle from its capture to its storage and management including during its usage.
1.1! Land Cover Validation Example quality (Foody et al., 2014), the 65 volunteers labelled 269 sites from a series of images and when attributing a land cover type, volunteers also declared how confident they were (sliding button with feedback to the user with a label, e.g., “sure”). The derivation of the land cover class-specific accuracies per volunteer (producer’s accuracies) and of the land-cover classes estimation from posterior probabilities were possible using a Latent Class Analysis (LCA) model estimation: see Van Smeden et al. (2014) for a recent review on LCA for medical applications as a means to assess accuracies of new ‘diagnostics tests’ without a gold standard.
1.2! Inundation Extent Estimation Example
This example concerns two slightly different inundation extent estimations from VGI data. One approach is purely crowdsourcing, using Twitter data (Smith et al., 2015) and the other more citizen science, derives from a case study as part of the COBWEB project. For the social media Twitter example, geo-tagged tweets are analysed to extract information of potential inundation and to look for inundated areas, e.g., “London road flooded!”, possibly combined with the geolocation of the tweets, then, a flood model (shock-capturing hydrodynamic simulations) using a terrain model (DEM) of the area is run to estimate an inundation extent.
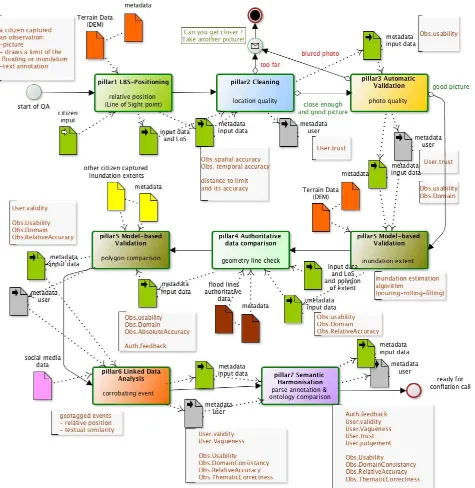
For the citizen science example, a mobile app has been designed to allow the capture of a geo-located estimation of a partial flood/inundation limit line (swipe-line) using the citizen’s drawing on the photo taken and the line of sight (LoS) position derived from the DEM and the citizen’s mobile phone orientations (Meek et al., 2013; Evans et al., 2015). This partial inundation limit (with its accuracy derived from LoS accuracy) is used within a pouring-rolling-ponding algorithm (Evans et al., 2015; Krupka et al., 2007) until the water level reaches that swipe-line therefore giving an estimation of the inundation extent from that observation with uncertainty from error propagation (using DEM and partial limit uncertainties). The QA put in place after each data capture is given in Figure 2, where after each QC (a ‘task’ in the workflow), metadata concerning quality are created or updated.
2.! SEMANTIC DISCOURSE
Entanglement can come from the common language when talking about quality. The word often refers to a level of quality: goodquality or badquality in relation to what the item is used for or how useful it is: “these tyres are of good quality as they will make 40 000 km” or “these tyres are of good quality as they reduce the braking distance by 20%”. The QA is then designed to test these particular features to decide the values given to the quality measures that in this case are completely linked to the usage. Note also that making 40 000 km may not be entirely compatible with reducing the braking distance by 20%, so a relative concept of good quality. For the spatial data quality standard, the ISO19157, the usability criterion will help to define and quantify this level of quality according to the usage but the requirements declared as being met are not necessarily using the other quality elements per se. Therefore the DCDF, considered as the immediate usage of the data,
appears determinant in the evaluation of the quality or at least it is implied in the usability quality element.
Looking at spatial data such as the Open Street Map data (www.openstreetmap.org) for a particular area, one could declare OSM of good quality if using the map a person didn’t get lost, say, between his/her house and the location of their dentist appointment. So the quality would be evaluated without consideration of completeness of OSM for the road network that is not directly used during routing (considered as a DCDF of a crow-fly line and the road network, and “didn’t get lost” considered as the quality or validity of using the DCDF), neither of absolute spatial accuracy. Only a relative accuracy and a topological consistency would be required in order “not to get lost”.
2.1! Data Quality of the End-Result
The QA should be concentrating on evaluating qualities of the measurements attached to that tyre. The conclusion “this is a good tyre” comes from estimating the “value” of a particular attribute after testing, e.g., testing how tender the rubber is. This will be a quality value that can mean good or bad for braking or mileage.
Note here the discourse is in danger of slipping away, as there is a mix between the value of the attribute itself, which may mean good quality or bad quality intuitively, the accuracy of that measure which is needed to be able to test the tenderness itself and the value of that testing. The data, a feature, a characteristic of the feature may imply a conformance or a usability met or not but only by knowing the accuracy attached it is possible to decide if the QA is met (in the sense of a requirement).
Mainly, the purpose of the QA is this a posteriori evaluation of the accuracy of the crowdsourced data. This is the control conformance to a set of requirements and is depending on both a priori and a posteriori types of quality assurance settings. So, when considering the fitness for purpose as driving the QA we would need to put this in plural among a range of plausible purposes. So the discourse can also be: I need this quality truth which has its own uncertainty. So, the (in)accuracy may be due to a bad measurement and/or to an imprecise measurement. The classification made by a volunteer for each land cover was attached with a self-assessment of the ‘precision’ of the attribution. For the inundation extent, the citizen may aim a bit too far over the edge of the water line and then shake a bit when taking the picture because of a cold wind.
Quality element
Definition
Vagueness Inability to make a clear-cut choice (i.e., lack of classifying capability)
Ambiguity Incompatibility of the choices or descriptions made (i.e., lack of understanding, of clarity) Judgement Accuracy of choice or decision in a relation to
something known to be true (i.e., perception capability and interpretation)
Reliability Consistency in choices / decisions (i.e., testing against itself)
Validity Coherence with other people’s choices (i.e., against other knowledge))
Trust Confidence accumulated over other criterion concerning data captured previously (linked to reliability, validity and reputability)
Table 1. Quality elements for the stakeholder quality model (Meek et al., 2014)
They represent types of inaccuracies that can be encoded using the thematicaccuracy elements of the ISO19157 standard but ambiguous definition may incline to pool all into one quality by asking, “how close this is to what is accepted or known to be true”. Section 4 will go further on this aspect.
Note that when using a DEM the accuracy of position for a particular elevation collapses with the accuracy of that elevation and in practice one considers only a vertical accuracy for a given resolution. This can have an impact on both the DCDF and on the QA for the inundation extent but is not of direct
concern here.
For the land cover type classification the potential confusion from the volunteer in understanding the different written descriptions of the land cover types may imply another type of uncertainty due to the user.
This can be reflected in the self-assessment (e.g., “sure”) but not entirely. In COBWEB three different type of qualities are looked for: the producer quality model (ISO1957 quality), the consumer quality model, i.e., feedback qualities, (Antelio et al., 2012; www.geoviqua.org), and the stakeholder quality model (Table 1).
These latter elements can be understood as qualifiers of a citizen as a sensor in its ‘functioning’ that will impact on information and observations captured by this citizen now and later. They will also impact on the other quality evaluations, i.e., a dependence sometimes precluding some other evaluations (Alabri and Hunter, 2010). An expert that we trust will be potentially by default attributed a lower uncertainty say on declaring the presence of a plant species in an unexpected area. It is also common sense that a large (‘bad’) position uncertainty of the point where a volunteer is standing may not be a problem when assessing a land cover type during a field session for a citizen science study (different from the example in 1.1), if the area was retrospectively considered homogeneous (say after an image segmentation). Similarly the vagueness of the annotation associated to the picture of the water line may not be too important. Nonetheless if the same citizen is capturing land cover classes, his/her past vagueness values may make this data
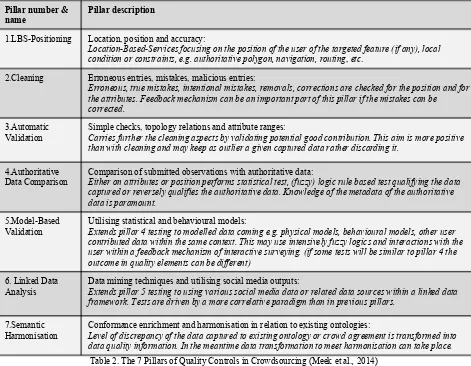
Pillar number & name
Pillar description
1.LBS-Positioning Location, position and accuracy:
Location-Based-Services focusing on the position of the user of the targeted feature (if any), local condition or constraints, e.g. authoritative polygon, navigation, routing, etc.
2.Cleaning Erroneous entries, mistakes, malicious entries:
Erroneous, true mistakes, intentional mistakes, removals, corrections are checked for the position and for the attributes. Feedback mechanism can be an important part of this pillar if the mistakes can be corrected.
3.Automatic Validation
Simple checks, topology relations and attribute ranges:
Carries further the cleaning aspects by validating potential good contribution. This aim is more positive than with cleaning and may keep as outlier a given captured data rather discarding it.
4.Authoritative Data Comparison
Comparison of submitted observations with authoritative data:
Either on attributes or position performs statistical test, (fuzzy) logic rule based test qualifying the data captured or reversely qualifies the authoritative data. Knowledge of the metadata of the authoritative data is paramount.
5.Model-Based Validation
Utilising statistical and behavioural models:
Extends pillar 4 testing to modelled data coming e.g. physical models, behavioural models, other user contributed data within the same context. This may use intensively fuzzy logics and interactions with the user within a feedback mechanism of interactive surveying. (if some tests will be similar to pillar 4 the outcome in quality elements can be different)
6. Linked Data Analysis
Data mining techniques and utilising social media outputs:
Extends pillar 5 testing to using various social media data or related data sources within a linked data framework. Tests are driven by a more correlative paradigm than in previous pillars.
7.Semantic Harmonisation
Conformance enrichment and harmonisation in relation to existing ontologies:
Level of discrepancy of the data captured to existing ontology or crowd agreement is transformed into data quality information. In the meantime data transformation to meet harmonisation can take place.
Table 2. The 7 Pillars of Quality Controls in Crowdsourcing (Meek et al., 2014)
more uncertain. So there may be entanglement due to the dependencies in the quality dimensions according to the data captured.
2.3! Evidence, Provenance and Confidence
These three terms are echoing the decision-making process and the necessary elements that are looked for in order to do it (Alabri and Hunter, 2010; Antelio et al., 2012; Chapman and Hodges, 2015). Providing evidence can be compared to the DCDF as contextualising different sources of information into compelling and intelligible unified new information. Implicitly the evidence conveys an improved quality as the process of gathering the evidence contains the idea of validating the information during the conflation, in fact: ‘confronting the evidences’. From this viewpoint, the DCDF would need the QA to have been operated but can be part of the QA process itself. Nonetheless the act of evidence making from confronting different pieces of information may appear distinct from the decision-making process and so of the DCDF too. This corresponds to the general approach chosen in COBWEB (Meek et al., 2014) with the seven pillars of quality controls (see Table 2): the data captured is successively confronted with other pieces of information in order to explore and improve the various dimensions of quality of the data.
Even though the order of chaining the controls can be different from the ordering in Table 2 (and more complex workflows can be used) it conveys the idea of refining the quality elements (see also Figure 2) and therefore increasing the confidence throughout the workflow. For example, in Pillar 3 ‘automatic validation’, an attribute value can be confronted to a range given by an expert and then in Pillar 4 ‘authoritative data comparison’, be confronted to a previously observed distribution in which the rejection or acceptation of the measurement as valid (and/or assign an accuracy) may take into account the previous assessments. The stakeholder authoring the QA will decide whether or not to chain these particular QCs that belong to Pillar 3 and Pillar 4.
The process of providing evidence is strongly linked to the quality assessment but also illustrates the entanglement of DCDF and QA, but only a weak entanglement, as the pieces of evidence are kept apart. The provenance of the data, entailing its data quality, encompasses the QA process as well: the choice of its workflow. Perhaps as discussed in the previous section the a priori QA, and therefore the design of experiment, is also part evidence by then perpetuating the metadata chain and therefore entangling now the quality information retrospectively. The traceability of quality using the provenance encoded using the QA workflow and the DCDF workflow may become quite complex with multiple entanglements, nonetheless providing the necessary information.
3.! DATA CURATION PROCESS
However entangled or not the QA and DCDF processes are, they take place as part of the data curation process (DCP). The data lifecycle can be very different depending on the
3 The QA workflow will produce quality elements from all of the three
quality models (see section 2.2) but relates itself to a metaquality
from a producer viewpoint.
crowdsourcing study and the potential reuse of the data at short term and longer term. Therefore, enabling easy data and metadata access at various stages is important. At this point some questions arise concerning the status of single data captured by a citizen and a collection of citizen captured data under the same or similar survey: a dataset. As an example of Quality Assurance used in biological monitoring, the National Biological Network in the UK (www.nbn.org.uk), has in place the ‘NBN Record Cleaner’4. This corresponds to some aspects in cleaning (Pillar 2 in Table 2) and conformance to (Pillar 7 in Table 2); quite a few of these ‘controls’ may be better seen as part of the data capture tool, e.g. mobile app, such as for the date format. These type of QCs are often relatively independent of the future usage and a potential DCDF at hand as either their aim are ‘correcting’ mistakes or using standards of encoding (including ontology of the domain and species thesaurus for example).
3.1! Design of Experiment
Crowdsourcing surveys are done for defined objectives; therefore the information to be collected is designed in a certain way. A protocol of experiment would contribute to identify sources of variability and quality with a number of constraints and requirements that can be implemented either at the data capture level, e.g., the mobile app, and would be part of a QA a priori, controllingwithin a preventing mannerand in the QA a posteriori controlling and assessing within a correcting and comparing manner. This is less true for social-media crowdsourcing where the data crawling and data mining extract the data according to relevance criteria, e.g., keyword matching and bounding box queries. This is the case for the inundation example using Twitter data (Smith et al., 2015) for which we may consider we are already in the DCDF depending on the completeness of the semantic matching put in place. Note that here the lack of control on the design of experiment is compensated by the intrusion of this DCDF and by the expected greater number of observations than in a citizen science study (see also Section 4.1), i.e., expecting to reach a quality level from say ‘averaging’ over a large sample.
For citizen science studies, a driver of the quality of the data will be reflected also from the simplicity or complexity of the study design and the design of the interface used (Pocock et al., 2014; Tweddle et al., 2012). A human factor is to be considered here and will be potentially captured using the quality elements in Table 1. A pilot study designed to capture these elements would help to minimise them in the real study.
A third type of QA occurs in between the a priori and a quality) and may ask the citizen to take another picture. As the defined objectives and the design of experiment may imply a range of DCDF already planned, the various QA can also be entangled with them, as described in Section 2. With the land cover classification example, the LCA can be performed
the top ten raters ranked say according to their achieved averaged accuracy (their producer’s accuracy, see Section 4.1 or Foody et al., 2013) obtained for the same study.
3.2! Storage, Usage, Re-usage
Data access at various stages of the DCP along with the evolution of the metadata including spatial data quality would be desirable. A provenance management may be facilitating this flexibility from which the potential entanglement of QA and DCDF can be identified. As mentioned in Section 2, this is of importance when reusing data along with its quality determinants under different contexts, therefore being aware of the already derived quality elements and associated metaquality, either to re-evaluate them or complete them under a new context. For citizen science it would be beneficial to be able to assess and have access to the quality elements listed in Table 1, which can be evaluated at data level from each individual. These elements can be conditioning a QA for a newly captured data or when conflating with the citizen data, e.g., in Pillar 5 or Pillar 6 but also the confidence in them after a DCDF.
In a similar modus operandi, DCDF and error propagation make use of a range of spatial data quality elements but DCDF is mostly interested in providing an end-result, an estimate, whereas error propagation focuses on the achieved accuracy of this end-result. Both make use of the initial quality evaluation provided by the QA process. Therefore, if disentangled, a Bayesian metaphor can be used to establish a prior quality from a QA that is then used in the DCDF to provide a conditional end-result dataset with error propagated. Potentially this can be used retrospectively to update the initial quality elements.
4.! IS A DISENTANGLEMENT POSSIBLE?
In the previous sections entanglement situations have been identified taking source either from the underlined semantics when describing and designing a case study, or when implementing a case study and focusing primarily on its aim and usage primarily. Whilst QA principles and usage of the data within a DCDF mean that these two curation steps operate in tandem, the multiple dimensions of quality and time of assessment (a priori QA, a posteriori QA and hic et nunc QA), offer flexibilities to the curator: choosing to make crowdsourced citizen science data of narrow usage, that is specifying its quality only for a narrow focus, or not when looking for a larger quality spectrum when describing the data. Entanglement under narrow focus may be less of a problem as apprehending the whole curation with its purpose together will be still feasible and not complex but consequently will reduce the usability.
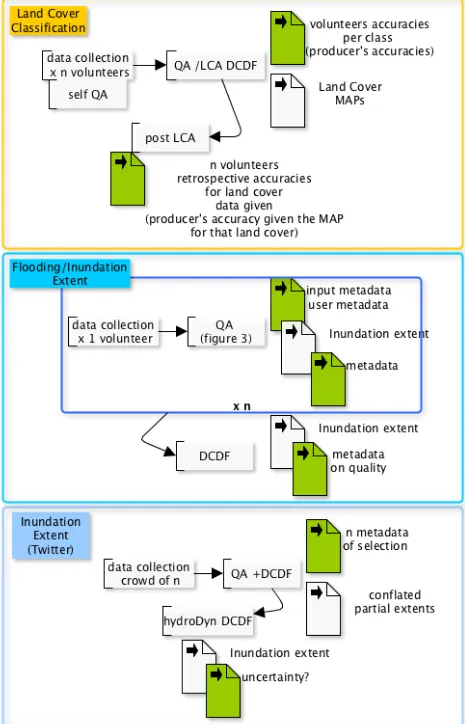
Coming back to the usage of the data and of its quality, the two examples chosen (of relatively narrow focus) are driven apparently from different ends – the land cover classification, using LCA as a mean to generate the accuracies for each rater5 (a volunteer) but in the meantime estimating the land cover classes for each photo from its observed pattern of agreements and maximum a posteriori (MAP) probabilities – and the inundation extent estimation, estimated after an uncertainty evaluation of the input, takes place leading to an uncertainty attached to the inundation extent estimated under error propagation (COBWEB case study). The Twitter example does not explicitly refer to the propagated uncertainty but a similar
5 Note each single data captured (the land cover class given per each
volunteer for a land cover) can be retrospectively given as uncertainty, the accuracy for that volunteer rating this observation given the consensus obtained from the LCA for that land cover (the MAP).
paradigm could be achieved. The description seems similar but the data life cycle presents different situations (see Figure 1.). In Figure 1, for the land cover classification, the LCA model provides a QA a posteriori of the whole VGI survey collection and following our categorisation in Table 2 could be a QC belonging to Pillar 5 (‘model-based validation’). It appears nonetheless as strongly entangling QA and DCDF as both accuracies and consensus land cover are produced within the same algorithm. Another curation process could potentially give a QA for a single volunteer once his/her survey is finished, e.g., running the LCA with a selection of previous raters and him/here as the new rater. Nevertheless it cannot be used to give an uncertainty of the new single observation (the attributed land class at that location) captured from this volunteer except by using a pseudo-authoritative data and taking a ‘modelled’ posterior uncertainty derived from the ‘previous reference study’. This ‘previous reference’ can be the past observations of the current study, then in this case taking the (past) posterior probability for the class attributed by this new rater at that location (whatever the pattern of past raters for that location was) or it can be a reference study judged similar, using a sort of modelled uncertainty of observing that class with a majority of the raters agreeing on it.
Figure 1. Data life cycle for the land cover classification and inundation extent examples
Only this QA setting would allow a hic et nunc QA, the interactive surveying allowing for example to ask in real-time some confirmatory questions if that posterior probability was, say, very small.
The inundation extent from the citizen science example presents a more typical curation and QA (Figure 2): uncertainty evaluation from direct QCs (Pillar 1, Pillar 2, Pillar 4) then a
physical model as a QC in Pillar 5) which can be taken as a DCDF using a DEM with its uncertainty giving an inundation extent. The ‘real’ DCDF comes when ‘aggregating’ the n estimations of inundation extents (after the end of the QA of Figure 2). The Twitter example belongs more to a DCDF, as the QA operated is mostly an a priori QA linked here to a wide selection of Tweets (Pillar 2), but then an a posteriori QA refining this selection (pre-tweets with a potentially wrong GPS reading and semantic analysis that would fit in Pillar 7 and Pillar 2). This is resulting in a ‘cleaning’ driven QA, i.e., in or out of the dataset. Then the estimation of inundation extent after conflation of partial extents derived from the selected
Tweets. So, no real potential entanglement and a more traditional – relevant data selection then analysis without return to the qualification of the initial data. This study was focusing
on checking retrospectively the potential validity of the method of estimating inundation from tweets and the hydrodynamic model.
4.1! The Statistical Analysis Viewpoint
When performing a statistical analysis the setting is more likely a DCDF as we build estimates, fit functions on the basis of a collection of information. An a priori QA takes place as part of the protocol to collect the data but other than a data cleaning step that does not retain the quality of a record and either accepts, corrects or rejects it, there is no qualifying of each observation or record a posteriori. Hypothesis on the Figure 2. Example of a QA workflow for flooding / inundation in COBWEB (BPMN workflow with annotations of quality elements
generated for the User, the Observation or the Authortative data)
distribution(s) of the observations may belong to the QA environment but the classical hypothesis of identically distributed is not really of interest in QA for crowdsourcing as one do not suppose there are ‘good’ and ‘bad’ quality data: the situation may be more like an error measurement model with unequal variances. Nonetheless, outlier detection and change detection methods belonging to the statistical domain may be appropriate for a range of QCs in Pillar 4 and Pillar 5. These QCs would validate a single observation (and quantify the validation) as belonging to some authoritative data expectation without performing a DCDF per se, thereby no entanglement. The general methodology of meta-analysis in medical statistics (Hedges and Olkin 1985) gets closer to a QA followed by a DCDF approach, as the idea is to combine results from a range of studies on the same topic, beforehand adding quality from their designs along with using the confidence estimated by the studies themselves on a particular outcome, and, obtain a new bounded estimate of that outcome with better power (eq., sensitivity or producer’s accuracy).
The semantic discourse about the QA and DCDF entanglement can be illustrated statistically by the fact that taking the measurement of the volunteers as estimating the truth one gets:
!"# = # %&− %& ( = )*+, %& (+ .+/(%&) (1) where %& is the observation captured by one volunteer or the conflation of n volunteers. So optimising or evaluating the accuracy takes into account both bias and precision:
23 +445/+4%(= )*+,(+ 6/74*,*83( (2)
where (in)accuracy is the root mean squared error and precision as 1 standard error. The bias is something that DCDF is most concerned with and the precision comes first when looking at quality, but both aspects are somehow entangled in this equation. Crowdsourcing relies on a statistical property that would assure equation (1) or (2) are well balanced6: the law of large numbers (as the sample size increases the observed bias reduces and the precision is divided by 3). This is an idyllic situation when all sampling assumptions are met: independent and identically distributed (i.i.d.). For example, in the VGI world, Foody et al., (2014) concluded that for the LCA model7 applied to volunteers as raters, increasing their number may not be the best solution in achieving high accuracy in estimating the land cover classes (DCDF aspect): a few well selected according to their uncertainty (producer’s accuracy) could be better. Note that in citizen science one can expect a smaller sample size than in crowdsourcing but usually with better quality (influence of the a priori QA) and /or with a lot more information as measurements (i.e., collecting more variables that could help reducing the uncertainty).
5.! CONCLUSION
Designers of scientific studies making use of citizens and volunteers to collect data and monitor environmental variables face an asserting challenge. Credibility comes with being able to critically identifying the characteristics of the whole data curation process. Within this context, Quality Assurance (QA) and Data Conflation or Data Fusion (DCDF) are two processes that need greater attention with respect to defining their role and analysing their combined use. Through investigating the conditions that often make these two processes entangled, this paper advocates for their separability as the goal of any data
6
-when using a so-called sufficient statistic, not a single observation-
7 There are also some constraints in the LCA model: the independence
of the raters conditionally to the class, which can be problematic entanglements into the modelling and authoring the respective workflows would increase control for (re-) usability. By providing increased flexibility, more complexity can be mastered, thereby enabling more effective use of crowdsourcing and volunteered or citizen derived geographical information. To this end, a meta-quality service orchestrating the interrelation of the QA and the DCDF workflows could constitute a feedback interface to the environmental scientist and decision-maker organising the data management requirements and new data collection surveys.
Dis-entanglement appeared beneficial on a rhetorical basis using two illustrative examples of land cover validation and flood inundation extent estimation but this could become particularly useful when considering that data flows are becoming more continuous, forcing regular updates in the data quality and in the conflated data.
ACKNOWLEDGEMENTS
This work has been supported by the project ‘Citizen Observatory WEB’ (COBWEB) funded by the European Union under the FP7 ENV.2012.6.5-1 funding scheme, EU Grant Agreement Number: 308513.
REFERENCES
Alabri, A. and Hunter, J., 2010. Enhancing the Quality and Trust of Citizen Science Data. In: 2010 IEEE Sixth International Conference on e-Science (e-Science), 7-10 December 2010, Bribane, Australia, pp.81–88.
Antelio, M., Esteves, M.G.P., Schneider, D. and de Souza, J.M., 2012. Qualitocracy: A data quality collaborative framework applied to citizen science. In: 2012 IEEE International Conference on Systems, Man, and Cybernetics (SMC), 14-17 October 2012, Seoul, Korea, pp. 931–936.
Bordogna, G., Carrara, P., Criscuolo, L., Pepe, M. and Rampini, A. 2014. On predicting and improving the quality of Volunteer Geographic Information projects. International Journal of Digital Earth. (online ahead of print), pp. 1–22.
Chapman, C. and Hodges, C. 2015. Can Citizen Science Seriously Contribute to Policy Development? A Decision Maker’s View. In: ‘Analyzing the Role of Citizen Science in Modern Research’ L. Ceccaroni and J. Piera (eds), IGI-global (book chapter proposal)
Comber, A., See, L., Fritz, S., Van der Velde, M., Perger, C. and Foody, G.M., 2013 Using control data to determine the reliability of volunteered geographic information about land cover. International Journal of Applied Earth Observation and Geoinformation. 23, pp. 37–48.
Craglia, M. and Shanley, L., 2015. Data democracy – increased supply of geospatial information and expanded participatory processes in the production of data. International Journal of Digital Earth, (online ahead of print), pp. 1–15.
Evans, B., Williams, R.D., Macklin, M. and Brewer, P., 2015. Potential of citizen science data and methods for flood risk modelling. (to be submitted)
Flanagin, A.J. and Metzger, M.J., 2008. The credibility of volunteered geographic information. GeoJournal. 72 (3-4), pp. 137–148.
Foody G.M., See, L., Fritz, S., van der Velde, M., Perger, C., Schill, C. and Boyd, D.S., 2013. Assessing the Accuracy of Volunteered Geographic Information arising from Multiple Contributors to an Internet Based Collaborative Project. Transactions in GIS, 17 (6), pp. 847–860.
Foody G.M., See, L., Fritz, S., van der Velde, M., Perger, C., Schill, C., Boyd, D.S. and Comber, A., 2014. Accurate Attribute Mapping from Volunteered Geographic Information: Issues of Volunteer Quantity and Quality. The Cartographic Journal, (available online).
Fowler, A., Whyatt, J.D., Davies, G., and Ellis, R., 2013. How Reliable Are Citizen-derived Scientific Data? Assessing the Quality of Contrail Observations Made by the General Public. Transactions in GIS, 17 (4), pp. 488–506.
Fritz. S., McCallum, I., Schill, C., Perger, C., See, L., Schepaschenko, D., van der Velde, M., Kraxner, F;, and Obersteiner, M., 2012. Geo-Wiki: An online platform for improving global land cover. Environmental Modelling and Software (31), pp. 110–23.
Goodchild M.F. and Li, L., 2012. Assuring the quality of volunteered geographic information. Spatial Statistics, 1(0), pp. 110–120.
Haklay, M., 2015. Citizen Science and Policy: A European Perspective. Woodrow Wilson International Center for Scholars, 2015, Washington, DC, USA.
Hedges, L.V. and Olkin, I. 1985. Statistical method for meta-analysis. Academic press, New-York, USA.
Jackson, M. Meek, S. Leibovici, D.G., 2014. NSDI data enhancement through crowdsourcing: the role of quality assurance to ensure effective conflation of authoritative and non-authoritative data sources. In: INSPIRE conference, 16-20 June 2014, Aalborg University, Aalborg, Denmark.
Krupka, M., Pender, G., Wallis, S., Sayers, P.B. and Mulet-Marti, J., 2007. A Rapid Flood Inundation Model. In: Proceedings of the. 32th IAHR Congress, 1-6 July 2007, Venice, Italy, paper SS05-04-O.
Meek, S., Priestnall, G., Sharples, M., and Goulding, J., 2013. Mobile capture of remote points of interest using line of sight modelling. Computers & Geosciences. (52), pp. 334–344.
Meek, S., Jackson, M. and Leibovici, D.G., 2014. A flexible framework for assessing the quality of crowdsourced data. In: proceedings of the AGILE 2014 conference, 3-6 June 2014, Castellon, Spain.
Pawlowicz, S., Leibovici, D.G., Haines-Young, R., Saull, R. and Jackson, M., 2011. Dynamical Surveying Adjustments for Crowd-sourced Data Observations. In: EnviroInfo conference, 5-7 October 2011, Ispra, Italy.
Pocock, M.J.O., Chapman, D.S., Sheppard, L.J. and Roy, H.E., 2014. A Strategic Framework to Support the Implementation of Citizen Science for Environmental Monitoring. Final Report to SEPA. Centre for Ecology & Hydrology, Wallingford, Oxfordshire, UK.
See, L., Comber, A., Salk, C., Fritz, S., van der Velde, M., Perger C, Schill C, McCallum I, Kraxner F and Obersteiner, M., 2013. Comparing the Quality of Crowdsourced Data Contributed by Expert and Non-Experts. PLoS ONE, 8 (7), e69958.
Smith, L., Liang, Q., James, P. and Lin, W., 2015. Assessing the utility of social media as a data source for flood risk management using a real-time modelling framework. Journal of Flood Risk Management, (online ahead of print), pp. 1-11.
Tweddle, J.C., Robinson, L.D., Pocock, M.J.O., and Roy, H.E., 2012. Guide to Citizen Science: Developing, Implementing and Evaluating Citizen Science to Study Biodiversity and the Environment in the UK. Natural History Museum and NERC Centre for Ecology & Hydrology for UK!EOF, London, UK.
Van Smeden, M., Naaktgeboren, C.A., Reitsma, J.B., Moons, K.G.M. and de Groot, J.A.H., 2014. Latent class models in diagnostic studies when there is no reference standard--a systematic review. American Journal of Epidemiology. 179 (4), pp. 423–431.
Victor, S. 2014. Dynamic model-based validation of crowd-sourced data. PhD thesis, University of Nottingham, UK.
Wiemann, S. and Bernard, L., 2010. Conflation Services within Spatial Data Infrastructure. In: proceedings of the AGILE 2010 conference, 11-14 May 2010, Guimaraes, Portugal.
Wiemann, S., Meek, S., Leibovici, D.G., Jackson, M., Chapman, C. and Lars, B., 2015. Service-based combination of quality assurance and fusion processes for the validation of crowdsourced observations. In: proceedings of the AGILE 2015 conference, 9-12 June 2015, Lisbon, Portugal.