P. E. Miller*, J. P. Mills, S. L. Barr and S. J. Birkinshaw
School of Civil Engineering and Geosciences, Newcastle University, Newcastle upon Tyne, NE1 7RU, UK – (pauline.miller, jon.mills, stuart.barr, stephen.birkinshaw)@ncl.ac.uk
Commission V/6, IV/8
KEY WORDS: LIDAR, TLS, Integration, Engineering, Hazards, Landslides
ABSTRACT
Road and rail networks are essential components of national infrastructures, underpinning the economy, and facilitating the mobility of goods and the human workforce. Earthwork slopes such as cuttings and embankments are primary components, and their reliability is of fundamental importance. However, instability and failure can occur, through processes such as landslides. Monitoring the condition of earthworks is a costly and continuous process for network operators, and currently, geospatial data is largely underutilised. The research presented here addresses this by combining airborne laser scanning and multispectral aerial imagery to develop a methodology for assessing landslide hazard. This is based on the extraction of key slope stability variables from the remotely sensed data. The methodology is implemented through numerical modelling, which is parameterised with the slope stability information, simulated climate conditions, and geotechnical properties. This allows determination of slope stability (expressed through the factor of safety) for a range of simulated scenarios. Regression analysis is then performed in order to develop a functional model relating slope stability to the input variables. The remotely sensed raster datasets are robustly re-sampled to two-dimensional cross-sections to facilitate meaningful interpretation of slope behaviour and mapping of landslide hazard. Results are stored in a geodatabase for spatial analysis within a GIS environment. For a test site located in England, UK, results have shown the utility of the approach in deriving practical hazard assessment information. Outcomes were compared to the network operator’s hazard grading data, and show general agreement. The utility of the slope information was also assessed with respect to auto-population of slope geometry, and found to deliver significant improvements over the network operator’s existing field-based approaches.
1. INTRODUCTION*
Transport networks are fundamental to national economies. They facilitate the flow of a diversity of goods and resources, and underpin the mobility of the workforce. In this context, roads and railways are of particular importance. Profitability, reliability and safety are crucial, and indistinguishable to the optimal operation of such networks (Mercer, 2002). To this end, it is essential that operating companies are able to effectively manage associated infrastructure. This includes earthwork slopes, such as embankments and cuttings, which comprise a significant proportion of these networks. For instance, in the UK, embankments account for 30 percent of all transport infrastructure, equating to around 5,000 km of rail routes across the entire UK, and 3,500 km of trunk road in England alone (Perry et al., 2003). However, as is the case with natural slopes, earthworks can be susceptible to failure, through processes such as landsliding. Where this occurs, the consequences can be severe, impacting upon associated assets such as bridges (Jones et al., 2008). In extreme cases, there is potential for injury or loss of life. However, more often the impacts relate to traffic disruption and the financial burden of slope remediation. Earthworks require near-continuous monitoring and appraisal. Given the extended nature of transport networks, this places significant demands upon the network operators. Although UK highways are constructed to modern engineering specifications, there is increasing uncertainty over the impacts of climate change. Furthermore, increasing volumes of heavier and faster traffic are placing additional strains on the network. UK rail
* Corresponding author
infrastructure faces more immediate concerns. The existing network largely dates from the mid- to late-19th Century, incorporating poorly-consolidated and aging earthworks (Perry et al., 2003). In recent years, an increase in extreme rainfall events has renewed concerns over the condition of these earthworks, with numerous minor landslides and derailments.
Current earthwork condition assessment approaches are relatively labour-intensive and in the case of the UK railways, involve periodic inspections, carried out on-foot by a geotechnical engineer. However, site inspection is relatively costly and inherently hazardous. Where areas are found to pose some level of risk, they are flagged up for subsequent action. This may involve implementing geotechnical site investigation, which may ultimately lead to remediation of the slope (Network Rail, 2010). Geotechnical investigation involves sub-surface monitoring through strategic placement of instrumented boreholes. Often this approach may be extended into geotechnical modelling, where slope characteristics are used as the basis for simulating likely slope behaviour and determining susceptibility to failure. Geotechnical investigation can be effective in detecting and diagnosing instability. However, by its very nature, it is invasive and can only be applied over limited spatial extents.
2009; Tsogas et al., 2011). Airborne laser scanning (ALS) and aerial imagery have been extensively utilised for landslide hazard assessment of natural hillslopes (e.g. Dewitte et al., 2008; Martha et al., 2010). However, the application of these techniques, and remote monitoring in general, has received very little attention in relation to earthwork slopes. Although appropriate techniques and datasets are now more readily available, there still remains a gulf between the provision of such data and the delivery of meaningful information for end-users.
The research presented here addresses some of these shortcomings through the development of a remote methodology for assessing slope failure hazard. This approach combines variables derived from remotely sensed data, using these to parameterise a numerical geotechnical model. This allows the simulation of slope behaviour under a range of conditions, and through regression analysis facilitates mapping of slope failure hazard along a test corridor. The results of this approach are compared to those determined by the network operator. Finally, the potential of the approach for auto-population of slope geometry is also examined.
2. TEST CORRIDOR AND DATASETS
2.1 Test Corridor
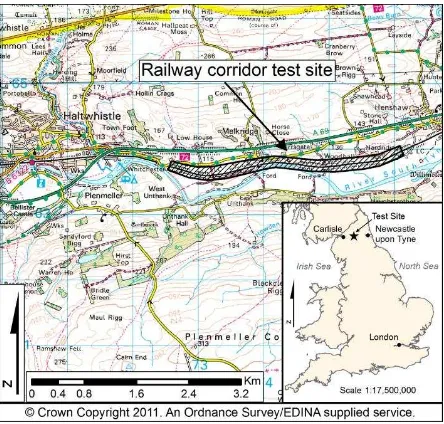
The research was applied to a 3.5 km railway corridor located near the town of Haltwhistle in northern England (Figure 1). The corridor comprises the Newcastle-Carlisle railway, which was identified by the network operator, Network Rail (NR), as being prone to minor landslides. This route is a double-track line, constructed in the 1830s. Within the test corridor, it is aligned in an east-west direction, and runs adjacent to the River South Tyne, within 15 m of the riverbank in places. Vegetation conditions are representative of those found across northern England; grass, shrubs and smalls trees dominate, interspersed with bare earth and mature deciduous trees.
2.2 Datasets
ALS data was acquired for the test corridor in July 2007 from a discrete pulse Optech ALTM 2050 sensor mounted on a helicopter platform. This instrument offers a pulse repetition rate of 50 kHz, which resulted in a relatively high spatial resolution dataset of around 20–50 points/m2. On-board GPS/IMU sensors enabled direct georeferencing. The data were compared to lidar targets distributed across the field site during data collection, and produced an RMSEXYZ of 10 cm as detailed by Lim et al. (2007). Multispectral aerial imagery was acquired for the test corridor in September 2007, shortly after the lidar survey. The imagery was gathered using a compact airborne spectrographic imaging (CASI) sensor. This is a 32-band instrument which acquires data in the visible and near-infrared portions of the electromagnetic spectrum (397–988 nm), offering particular potential for vegetation and land-cover analysis. The data was captured from a flying height of 1100 m, resulting in a 0.6 m ground pixel footprint. Radiometric calibration was enabled by field spectroscopy measurements of three 6 m x 6 m artificial targets. Geometric calibration was undertaken by the data provider, and following check point analysis, the RMSEXY of the imagery was determined to be 1.10 m, which is within the operator’s specifications. 1:2500 scale digital vector mapping was also utilised in the methodology. In addition to standard topographic features, the data also included polygons defining the extents of the railway earthworks.
Figure 1. Location of railway test corridor.
3. METHODOLOGY
3.1 Extraction of Slope Stability Variables
A number of approaches have been adopted to assess landslide hazard and slope instability (e.g. Guzzetti et al., 1999; van Westen et al., 2008). As observed by Chang et al. (2010), most approaches fall into one of three categories: deterministic, heuristic or statistical. The most appropriate approach is generally governed by the goal of the study, the availability of data and the scale of the landslide features or study area (Corominas and Moya, 2008). This research is concerned with relatively fine-scale processes acting over engineered slopes. Hence, a deterministic approach is particularly appropriate, as earthworks have been extensively modelled and investigated in relation to failure mechanisms and behaviour (e.g. Abramson et al., 2002; Manning et al., 2008).
Numerous parameters have been identified as influential to the development of slope instability, and the relative importance of these may vary depending on the characteristics of the study region. Amongst the most commonly identified parameters are those relating to slope gradient, land-cover and soil moisture/rainfall. In this research, these key parameters were extracted following analysis of the ALS and multispectral imagery data. Firstly, a ground classification was performed on the ALS data using the TerraSolid TerraScan software. This allowed removal of non-ground points, and enabled a set of high resolution ground points to be exported to ESRI ArcGIS, where a 0.5 m DTM was generated for the test corridor. Sensitivity testing indicated that this provided appropriate spatial resolution for the earthwork slopes, whilst avoiding micro-topographic effects. The DTM was then used as the basis for extracting a 0.5 m slope gradient raster grid. Hydrological parameters such as soil moisture and flow accumulation are highly relevant in assessing slope stability and increase in importance as the scale of analysis becomes more detailed (van Westen et al., 2008). In this research, the spatial distribution of soil moisture was considered through a topographic wetness index (TWI), whilst the more direct role of soil moisture in the development of failure was determined through numerical modelling (Section 3.2). Further details of the TWI, which was extracted directly from the 0.5 m DTM using the approach International Archives of the Photogrammetry, Remote Sensing and Spatial Information Sciences, Volume XXXIX-B5, 2012
presented by Tarboton (1997), can be found in Miller et al. (in press). A 0.5 m TWI was derived for the test corridor, with lower TWI values corresponding to areas of greater saturation.
A supervised maximum likelihood classification was performed on the CASI imagery using ERDAS Imagine, allowing identification of three classes: bare earth; grass and shrubs; and trees. An overall classification accuracy of 77 % was achieved. These classes were selected to provide correspondence to the modelling configuration. The resultant classified image offers a pixel resolution of 0.6 m, which provides good spatial correspondence to the 0.5 m slope and TWI datasets.
3.2 Numerical Modelling
In order to provide intelligence on likely slope behaviour, a coupled hydrological-geotechnical model was applied. Hydrological aspects are incorporated through SHETRAN
(Ewen et al., 2000), a 2D flow model which allows simulation of pore water pressures in response to rainfall. Rainfall was simulated over a ten year period, on a daily basis, for both the current climate and a future climate (2080). In both cases, the wettest day was selected to represent the worst case scenario, and the corresponding pore water pressures were transferred to the finite-difference software, FLAC, which models geotechnical aspects. The model was configured for five slope gradients, identified through analysis of the ALS data. These represent extremes of slope, as well as three more typical gradients found within the test corridor (11, 22, 30, 36, and 49). In addition, the three land-cover categories were also configured in the modelling. This produced a total of 30 scenarios, which derive from unique combinations of the two climate scenarios, five slope cases, and three land-cover classes. The material and geotechnical properties of the slope (e.g. soil composition, water table, etc.) were available through a geotechnical site investigation report for a section of the test corridor (Owen Williams Railways, 2005). The FLAC model was configured with a cell size of 0.5 m, and as output delivers a factor of safety (FoS) for each scenario. This is a geotechnical indicator of slope stability, and is the ratio between the restraining force (shear strength) and the mobilising force (shear stress), acting on a slope. Where this ratio is equal to or less than a value of unity, the slope is deemed to have failed. In the UK, for deep seated failures, a minimum value of 1.3 is specified for railway embankments (Perry et al., 2003).
3.3 Slope Hazard Mapping
In order to map landslide hazard across the test corridor, it was necessary to link the modelling results (FoS values) to the input variables. Following analysis, it was determined that cubic regression provided the best solution (coefficient of determination, R2 = 0.99 for all vegetation scenarios). This enabled the derivation of a functional model, which took the basic form:
(2)
Where, in this example, FoST is the factor of safety value for the case of trees, S is the slope gradient in degrees, and a, b, c, and
d are the coefficients of regression. Corresponding models were determined for bare ground and grass and shrubs. Whilst this provided a means of determining FoS based on the input slope and land-cover raster grids, this approach was not appropriate for direct mapping of failure hazard. Failure processes act over the slope as a whole, and considering individual pixels in isolation is nonsensical. Consequently, the input raster grids
were resampled to 2D cross-sections, with 0.5 m spacing in the ‘along-track’ direction either side of the railway line. This cross-section approach corresponds closely to the 2D geotechnical modelling configuration, and is also likely to be more intuitive for interpretation by engineers. The vector mapping polygons were used to restrict the analysis extents to the embankment and cutting features, as shown in Figure 2.
Figure 2. Slope cross-sections, clipped to earthwork polygons.
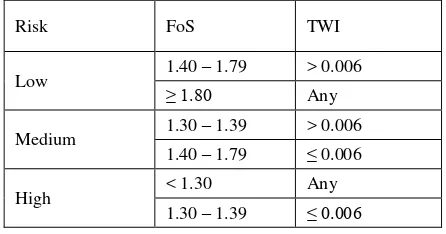
Raster cell values were extracted from the slope gradient, TWI and land-cover grids at the location of the intersecting cross-sections. A toolset was developed in Matlab to automatically aggregate the pixel values for individual cross-sections and ensure rigorous assignment of parameters. Robust least squares linear regression was applied to the DTM values for each cross-section to establish a reliable slope gradient value. This allowed outliers, and the effect of smaller, flatter sections of slope to be overcome. In order to extract a single land-cover classification for each cross-section, the underlying pixel values were evaluated to determine the most dominant class. Following the assignment of a single slope gradient and land-cover value, it was possible to calculate a FoS value for each cross-section by applying the appropriate cubic regression model (2). As it was not possible to embed TWI within the geotechnical modelling, this variable could not be directly included in (2). Instead, TWI was considered as an additional risk factor. As water will accumulate in the lower regions of a slope, the mean TWI value was determined over the lower third portion of the slope section only. This was found to produce an appropriate reflection of the variability throughout the test corridor. Following this, the distribution of the lower third mean TWI values for all the cross-sections in the corridor were analysed, and a 5 % threshold was applied. This corresponds to a value of 0.006 (for this dataset), which is exceeded by 95 % of the data. This 5 % threshold enabled identification of extreme low values, without restricting the selection to only fully-saturated areas with TWI=0. Cross-sections having a TWI of less than 0.006 were flagged as contributing an additional risk factor, resulting in the classification as detailed in Table 1.
Risk FoS TWI
Low 1.40 – 1.79 > 0.006
≥ 1.80 Any
Medium 1.30 – 1.39 > 0.006 1.40 – 1.79 ≤ 0.006
High < 1.30 Any
1.30 – 1.39 ≤ 0.006
3.4 Deriving Slope Metrics
In addition to determining FoS and risk for each cross section, a number of additional slope metrics were derived for each cross-section in Matlab. This includes slope aspect, slope height and length, and earthwork type (cutting/embankment). This additional information is stored in a geodatabase alongside the FoS and risk information and is integrated within a GIS environment to allow for spatial querying and analysis of individual sections by end-users.
4. RESULTS
4.1 Slope Stability Modelling
The modelling results indicated that slope gradient exerts the greatest influence on slope stability, with increasing slope gradients strongly correlated to reduced FoS values. Land-cover has a consistent, but more subtle effect, with minor reductions in FoS as vegetation changes from trees, to grass and shrubs, and then bare earth. This is to be expected, as the main effect of increased land-cover in the modelling is to increase evaporation, thus effectively stabilising the slope. FoS values only reached critical levels (i.e. around 1.3) under the most extreme slope gradients. Results for the future climate were only marginally different, and generally trend towards more stable earthworks. This is most likely because the climate simulations indicated that the future climate (2080) would be characterised by longer, drier summers, thus reducing overall moisture content. These results are presented in full in Miller et al. (in press).
4.2 Mapping Slope Failure Hazard
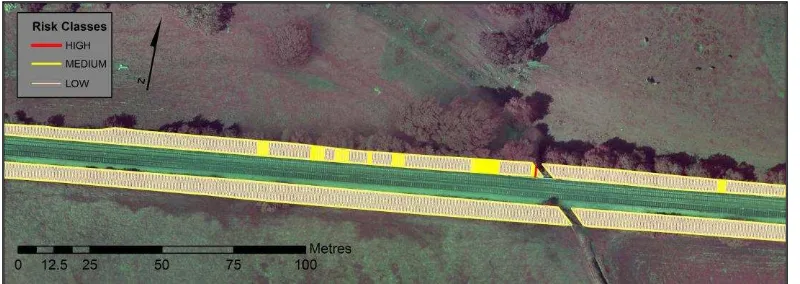
FoS values were derived for the slope cross-sections using the approach described in Section 3.3. The vector mapping data were found to be highly effective in restricting analysis to the earthwork extents. Across the test corridor, the results indicated that there were no extended high risk areas. Further, only a few sections were assigned a FoS of 1.3 or less, and these were generally high gradient slopes adjacent to bridge abutments. Figure 3 illustrates the results of the cross-section risk mapping for a portion of the test corridor comprising embankments. The majority of medium risk earthworks were located on the northern aspect of the test corridor (e.g. Figure 3), and most likely reflect increased TWI values. This is due to the fact that runoff from the uplands to the north will naturally accumulate in this region of the corridor.
The FoS values were evaluated through comparison to NR risk grading data which was derived in 2008, and which was expected to provide relatively good temporal agreement. Full details of this assessment are presented in Miller et al. (in press). Essentially this highlights a broad general agreement between the modelling-based approach and the NR condition assessment, although there is no significant correlation between the results. This is likely due to the fact that unlike the modelling-based method, the NR approach is only semi-quantitative, and does not produce truly-continuous output values. Additionally, while both approaches are heavily based on slope geometry, the NR method also considers a number of additional factors, such as movement indicators (e.g. cracking), drainage conditions and the presence of animal activity.
4.3 Assessing Slope Metrics
As outlined in Section 3.4, a number of slope metrics were derived through the Matlab analysis. This enabled a more direct
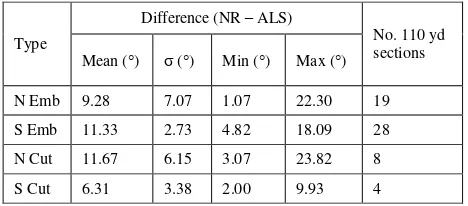
comparison to NR data. As the NR risk assessment algorithm is heavily dependent upon slope geometry, this was also expected to provide a reflection of the utility of remote sensing techniques such as ALS for auto-population of this information. Firstly, it was possible to assess the earthwork classification. The earthwork type (embankment/cutting) is derived through analysis of the slope gradient as part of the robust gradient cuttings for the test corridor. A further comparison was carried out with respect to slope gradient and slope height, which play an important role in both hazard assessment approaches. The differences in the derived gradients and heights are presented in Table 3 and 4 respectively. N/S refers to earthworks on the
Table 3. Difference statistics for ALS-derived slope gradients compared to those evaluated by NR.
Table 4. Difference statistics for ALS-derived slope heights compared to those evaluated by NR.
These results detail the difference between the slope gradients and heights generated for each 110 yard section through the ALS-based data and the values supplied by NR. The ALS-based values are determined by calculating the mean of the individual cross-section slope gradients and heights falling within each 110 yards. Table 3 reveals quite significant differences between the two sets of gradients, with mean differences consistently close to 10. Likewise, the slope height differences, as presented in Table 4, are also relatively large, with mean differences of up to 1.69 m in the case of south-facing embankments, with a maximum corresponding discrepancy of 3.42 m. This is quite significant in that the discrepancy constitutes a sizeable portion of the typical earthwork height of around 3-4 m. These differences in slope geometry likely stem from the fact that the NR values are determined by inspectors on-site, and are not always rigorously measured. The geometry is often gauged approximately, with only occasional direct measurements of gradient by clinometer. Manual checks performed on a sub-sample of 110 yard sections indicated that International Archives of the Photogrammetry, Remote Sensing and Spatial Information Sciences, Volume XXXIX-B5, 2012
Figure 3. Cross-section risk classification for section of test corridor.
the ALS-derived height and gradient values are relatively reliable, and can be expected to be several orders of magnitude better than those delivered by NR. The differences (Table 3 and Table 4) are all positive, indicating that slope gradients and heights are overwhelmingly over-estimated by NR inspectors. As the NR hazard assessment algorithm is heavily weighted on the basis of slope geometry, errors of 10 in gradient and 1.5 m in height could result in a particular section being assigned a high failure score, resulting in it being pushed into a more extreme risk category and delivering overly-pessimistic risk assessment.
5. DISCUSSION
This research has demonstrated the value of remote sensing for semi-automated assessment of slope failure hazard on transport corridor earthworks. The developed toolset facilitates the integration of the remote sensing parameters with the numerical modelling outcomes, delivering a quantitative measure of slope failure hazard through the FoS. This is further augmented through incorporation of TWI as an additional risk factor. This approach supports practical end-user querying and analysis of the results in a GIS environment at high spatial resolution. The provision of additional slope metrics (aspect, slope height and length, etc.) provides a basis for informed decision-making, considering slope regions in broader context.
Detailed discussion of the utility of high resolution remote sensing for this application is presented in Miller et al. (in press). However, essentially, the high resolution ALS and multispectral imagery proved fundamental in capturing variations in slope and vegetation along the test corridor, underpinning the provision of high spatial resolution hazard assessment information. The coupled hydrological-geotechnical modelling was found to provide an effective tool for quantifying slope behaviour under a range of representative scenarios. Numerical modelling is a widely-implemented approach for assessing slope stability. However, it is normally only applied over relatively limited extents. Through integration with remotely-sensed variables, the approach developed here has allowed this technique to be applied over a broader area. However, in considering applicability at the network scale, further investigations are required in order to assess transferability under differing regional conditions (e.g. geology/environment). The hazard mapping approach is able to deliver a practical solution for slope stability assessment, which presents the user with the slope factor of safety, a derived risk assessment and a number of additional slope metrics. This information is likely to be most valuable in aiding the decision
making process, and in assisting in the prioritisation of site inspection. The approach can be easily integrated within a GIS environment, thus providing geotechnical engineers with a flexible and intuitive means of assessing earthwork condition.
The results of the earthwork geometry investigations are particularly encouraging and demonstrate how techniques such as ALS can directly contribute to existing earthwork assessment workflows. Determination of earthwork height and gradient are fundamental to the existing NR safety grading approach. However, the existing means of estimating these variables was found to comprise significant potential for error. Such errors are likely to propagate into the final safety classification. However, it should be noted that in the case of the data examined here, the NR gradients and heights were nearly all over-estimated, and thus the results are overly-pessimistic – i.e. safety is not compromised. Despite this, there is still potential for increasing efficiency and reducing inspection workload by ensuring that the delivered geometry values are more accurate. These findings provide strong support for the implementation of a more robust approach. In this context, ALS is highly suitable, offering remote, reliable derivation of these parameters, which would enable auto-population of slope geometry.
6. CONCLUSION
REFERENCES
Abramson, L.W., Boyce, G.M., Thomas, S., Sharma, S., 2002. Slope Stability and Stabilization Methods, 2nd ed. Wiley, New York.
Aguilar, J.J., Torres, M.L.F., Blesa, A., 2005. Development of a stereo vision system for non-contact railway concrete sleepers measurement based in holographic optical elements.
Measurement, 38(2), pp 154-165.
Chang, K.-T., Wan, S., Lei, T.-C., 2010. Development of a spatial decision support system for monitoring earthquake-induced landslides based on aerial photographs and the finite element method. International Journal of Applied Earth Observation and Geoinformation, 12(6), pp 448-456.
Corominas, J., Moya, J., 2008. A review of assessing landslide frequency for hazard zoning purposes. Engineering Geology, 102(3-4), pp 193-213.
Dewitte, O., Jasselette, J.-C., Cornet, Y., van den Eeckhaut, M., Collignon, A., Poesen, J., Demoulin, A., 2008. Tracking landslide displacements by multi-temporal DTMs: A combined aerial stereophotogrammetric and LiDAR approach in western Belgium. Engineering Geology, 99(1-2), pp 11-22.
Ewen, J., Parkin, G., O'Connell, P.E., 2000. SHETRAN: distributed riven basin flow and transport modeling system.
Journal of Hydrologic Engineering, 5(3), pp 250-258.
Guzzetti, F., Carrara, A., Cardinali, M., Reichenbach, P., 1999. Landslide hazard evaluation: a review of current techniques and their application in a multi-scale study, Central Italy.
Geomorphology, 31(1-4), pp 181-216.
Jones, C.A., Stewart, D.I., Danilewicz, C.J., 2008. Bridge distress caused by approach embankment settlement.
Geotechnical Engineering, 161(2), pp 63-74.
Lim, M., Mills, J.P., Barr, S.L., Barber, D., Glendinning, S., Parkin, G., Hall, J., Clarke, B., 2007. High resolution earth imaging for transport corridor slope stability risk analysis.
International Archives of Photogrammetry, Remote Sensing and Spatial Information Sciences, Vol. 36, Part 1/W51, 6 p.
Manning, L.J., Hall, J.W., Kilsby, C.G., Glendinning, S., Anderson, M.G., 2008. Spatial analysis of the reliability of transport networks subject to rainfall-induced landslides.
Hydrological Processes, 22(17), pp 3349-3360.
Martha, T.R., Kerle, N., Jetten, V., van Westen, C.J., Kumar, K.V., 2010. Characterising spectral, spatial and morphometric properties of landslides for semi-automatic detection using object-oriented methods. Geomorphology, 116(1-2), pp 24-36.
Mercer, 2002. The GB Rail Industry: In its own words: problems and solutions. Mercer Management Consulting for the Department of Transport, London, 35 p.
Miller, P.E., Mills, J.P., Barr, S.L., Birkinshaw, S.J., Hardy, A.J., Parkin, G., Hall, S.J., in press. A remote sensing approach for landslide hazard assessment on engineered slopes. IEEE Transactions on Geoscience and Remote Sensing: 9 p.
Network Rail, 2010. Network Rail Asset Management Policy Justification for Engineering Policy. Network Rail, London.
Owen Williams Railways, 2005. Network Rail LNE MP&I. Melkridge Embankment NEC2/WEM/34.0900/35.0747/DN & UP, 16 p.
Perry, J., Pedley, M., Reid, M., 2003. Infrastructure embankments - conditional appraisal and remedial treatment. CIRIA, London, 242 p.
Tarboton, D.G., 1997. A new method for the determination of flow directions and upslope areas in grid digital elevation models. Water Resources Research, 33(2), pp 309-319.
Tsogas, M., Floudas, N., Lytrivis, P., Amditis, A., Polychronopoulos, A., 2011. Combined lane and road attributes extraction by fusing data from digital map, laser scanner and camera. Information Fusion, 12(1), pp 28-36.
van Westen, C.J., Castellanos, E., Kuriakose, S.L., 2008. Spatial data for landslide susceptibility, hazard, and vulnerability assessment: an overview. Engineering Geology, 102(3-4), pp 112-131.
Yoon, J.-S., Sagong, M., Lee, J.S., Lee, K.-S., 2009. Feature extraction of a concrete tunnel liner from 3D laser scanning data. NDT&E International, 42(2), pp 97-105.
ACKNOWLEDGEMENTS
This research was funded by the UK Engineering and Physical Sciences Research Council (Grant EP/D023726/1) and was carried out in collaboration with the following organisations: Network Rail; Highways Agency; London Underground; Construction Industry Research and Information Association; Rail Safety and Standards Board; and Network Mapping. The authors would like to acknowledge Ordnance Survey for royalty-free provision of mapping data.