J. G. Rejas a,d , J. Martínez Frías b, J. Bonatti c, R. Martínez d and M. Marchamalo d
a
National Institute for Aerospace Technology, INTA. Ctra. de Ajalvir km 4 s/n 28850 Torrejón de Ardoz (Spain), [email protected]
b
Astrobiology Centre Spanish National Research Council, INTA/CAB CSIC. Ctra. de Ajalvir km 4 s/n 28850 Torrejón de Ardoz (Spain),[email protected] csic.es
c
Costa Rica University, UCR. Campus UCR San Pedro de Montes de Ocas s/n, 0125 San José (Costa Rica),[email protected]
d
Technical University of Madrid, UPM. Ramiro de Maeztu, 7, 28040 Madrid (Spain), [email protected], [email protected]
Spectral Anomaly, Hydrothermal Alteration, Hyperspectral, Multispectral, Multisensor.
The aim of this work is the comparative study of the presence of hydrothermal alteration materials in the Turrialba volcano (Costa Rica) in relation with computed spectral anomalies from multitemporal and multisensor data adquired in spectral ranges of the visible (VIS), short wave infrared (SWIR) and thermal infrared (TIR). We used for this purposes hyperspectral and multispectral images from the HyMAP and MASTER airborne sensors, and ASTER and Hyperion scenes in a period between 2002 and 2010. Field radiometry was applied in order to remove the atmospheric contribution in an empirical line method. HyMAP and MASTER images were georeferenced directly thanks to positioning and orientation data that were measured at the same time in the acquisition campaign from an inertial system based on GPS/IMU. These two important steps were allowed the identification of spectral diagnostic bands of hydrothermal alteration minerals and the accuracy spatial correlation. Enviromental impact of the volcano activity has been studied through different vegetation indexes and soil patterns. Have been mapped hydrothermal materials in the crater of the volcano, in fact currently active, and their surrounding carrying out a principal components analysis differentiated for a high and low absorption bands to characterize accumulations of kaolinite, illite, alunite and kaolinite+smectite, delimitating zones with the presence of these minerals. Spectral anomalies have been calculated on a comparative study of methods pixel and subpixel focused in thermal bands fused with high resolution images. Results are presented as an approach based on expert whose main interest lies in the automated identification of patterns of hydrothermal altered materials without prior knowledge or poor information on the area.
!"
Detection of spectral anomalies aims at extracting automatically pixels that show significant responses in relation of their surroundings. Several methods have been developed in the last decades, allowing a better understanding of the relationships between hyperspectral data dimensionality and the optimization of search procedures (Duran and Petrou, 2007; Shaum, 2005; Stein ., 2002) as well as the sub pixel differentiation of the spectral mixture and its implications in anomalous responses (Bar , 2010; Eismann ., 2009; Manolakis and Shaw, 2002).
In other sense, image spectrometry has proven to be efficient in the characterization of minerals based on statistical methods using specific reflection and absorption bands. Hyperspectral configurations in SWIR and VNIR (Visible Near Infrared) have been successfully used for mapping hydrothermal alteration materials in different geological scenarios (Antón Pacheco
., 2001; Crosta ., 2003).
Previous works have shown the applications of ranges of the spectrum in MIR (Medium Infrared) and TIR, combined with other sources (Nasrabadi, 2008; Cipar , 2011).
An important aim in this research was to establish relationships that allow linking spectral anomalies with what can be called information anomalies and, though, identify information related to anomalous responses rather than simply spotting differences from the background. We aim at analysing the information obtained form detected anomalous responses.
This work presents a multi source approach, applied to the analysis of the correlations between spectral anomalies and hydrothermal materials in the Turrialba volcano complex, located in the Central Volcanic Range (Costa Rica). We analyse the influence of spectral resolution in the determination of the background, a critical aspect in the detection of anomalies. Results are compared with vegetation and soil indeces in an active volcanic environment. The increasing activity of this complex requires special attention and survey, because of its proximity to main urban areas in Costa Rica.
#" $
Data from airborne and satellite sensors have been analyzed in a multiscale strategy. We used reflectance images of HyMAP sensor (Cocks ., 1998) and the MASTER sensor (Hook
., 2001), acquired both the 7 March 2005 on the Turrialba volcano and surroundings. The scene HyMAP (125 channels between 0.4589 µm and 2,491 µm) has a dimension of 710 x 2415 pixels, with a spatial resolution of 15 m. The MASTER scene is 1650 x 4466 pixels, with spatial resolution of 9 m and radiometric resolution of 16 bit. The 50 MASTER image channels are grouped in a port of 25 channels in the VNIR SWIR (0463 µm 2,427 µm), and 25 channels between 3,075 µm and 13 µm in the MIR and TIR.
We used ASTER scenes likewise covered a period from 2002 to 2010, and a scene of Hyperion of 5th of March 2010, acquired
through the USGS EarthExplorer
(http://earthexplorer.usgs.gov/).
An algorithm MNF (Minimum Noise Fraction) has been applied to reduce noise of MASTER and HyMAP images. Channels sensors have been rejected what presenting a high signal / noise ratio, channels 62 to 65 and 125 in the case of HyMAP, and channels 16 to 19, 25 to 41 and 50 in the image MASTER.
The airborne images have been georeferenced directly by GLT ENVI algorithm, using the geometry calculated from position and orientation data measured by inertial GPS/ IMU (Inertial Measurement Unit) at the same time of acquisition over the study area.
" %
Image exploratory techniques have been applied with the aim to contrast biophysical parameters and obtain a first approximation of the state of vegetation and soils in the Turrialba region.
A check of radiometric and geometric corrections of images have been performed from data measured in supervision campaigns. In August 2010 and February 2012 has been carried out a field survey, which allowed us samples of 29 and 20 points respectively, measured in field and laboratory with USB400 and ASD FieldSpec 4 Hi Res spectroradiometers. The spectra have been used to characterize hydrothermal alteration materials and to check HyMAP reflectance images and MASTER by empirical linear regression.
The georeferencing of images has been tested using 50 check points measured on the ground in projection UTM zone 17 and WGS84 Datum by DGPS. The planimetric (X and Y) root mean square RMS obtained were 3.2 and 1.9 pixels, respectively for the MASTER data and the HyMAP.
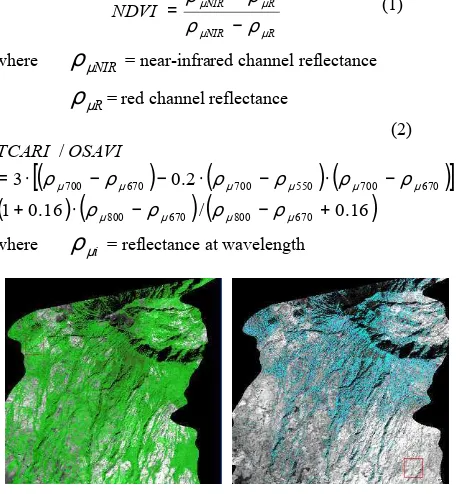
Vegetation indeces and soil have been calculated for the set of images. Three indices of vegetation from the reflectance values of hyperspectral imagery were generated, the Normalized Difference Vegetation Index (Rouse 1974) for evaluating the estimate of the LAI cover (Leaf Area Index), and the ratio (Berni ., 2010) between the rate of the Transformed Chlorophyll Absorption in Reflectance Index TCARI (Haboudane 2002) and the Optimized Soil Adjusted Vegetation Index OSAVI (Rondeaux 1996).
µ
where
ρ
µ = near infrared channel reflectanceµ
ρ
= red channel reflectance(2)
These image transformations were carried out with the intention of assess the influence of vegetation cover in the subsequent image analysis, and estimate the impact of volcanic activity on the slopes and the surrounding areas. We observed in the indices calculated from the time series of ASTER scenes, the clear effect of acid rain on vegetation vigor at the Northwest of the crater.
&"
&"! '() *+,) -. -.*,)-* /)) -.0- 1
.2-There are some minerals that indicate hydrothermal alteration, that we can detect remotly by their spectral responses in the diagnostic absortion bands and reflection. These specific spectral features can be extracted from the hyperspectral data properly calibrated. Argillaceous minerals, such as kaolinite, illite and alunite, have a concrete spectral characteristic presenting a high reflectance between the wavelengths of 1.55 Km and 1.75 Km they also present high absorption between 2,08 Km and 2,35 Km. Another additional characteristic to identify these minerals is that the rocks that have not suffered the hydrothermal process, usually present regular values on the wave lengths previously mentioned. The minerals with high content in Fe present a very high contrast between the wavelengths 0,63 Km and 0,69 Km and the wavelengths 0,45 Km to 0,52 Km.
We have chosen four variables for generating a different Principal Component Analysis (PCA) for groups of channels, two highly reflective and two highly absorptive for each mineral (Crosta ., 2004; Bataller 2011). The minerals analyzed for HyMAP case are: Illite (HyMAP channels 6, 25, 105 and 108), alunite (HyMAP channels 6, 25, 105 and 116), kaolinite (HyMAP channels 6, 81, 116 and 108) and Figure 1. NDVI (left) abundante and TCARI/OSAVI (right) in Turrialba volcano from HyMAP image of March 2005.
kaolinite+smectite (HyMAP channels 6, 81, 108 and 119). We channels 4, 8, 21 and 24 for alunite; MASTER channels 4, 8, 21 and 22 for illite; MASTER channels 4, 13 22 and 24 for kaolinite.
The results obtained for HyMap and MASTER have been classified by K Means algorithm. We calculated confusion matrices using field sampling considered as true value. An overlap accuracy of 82.56% and Kappa coefficient of 0.75 have been obtained for HyMAP image. An overlap of accuracy of 75.11% and Kappa coefficient of 0.69 have been obtained in the MASTER case.
The results are strongly influenced by vegetation cover, which acts as an input error of reflectance in the computing of new variables or Principal Components (PCs). Nevertheless, we observe the scarce presence of materials of clay phyllic alteration, contrasting with the abundance of iron oxide components.
&"# 3,2*)-. - -.' (,*,2*
A RX algorithm (Reed and Xaoli, 1996), widely accepted as a standard spectral anomaly detection, has been applied to all set of data.
Anomalies obtained for RX have been verified by those computed using a method based on (Malpica 2008). The computation in both methods has been carried out separately for spectral ranges of reflective channels and emissive. MASTER thermal channels fused with aerial
photography at 2.5 m have been used to calculate thermal anomalies with the intention on improve the classes separability maintaining the raw spectral information acquired (Rejas 2007). Eight new variables were obtained from MASTER channels 42 to 49. Variable number six was spatially projected and we realized that is was related to high humidity values, and it fitted a wide and well delimited area Northwest from Turrialba.
We carried out pattern recognition analysis. For MASTER and ASTER images we calculated a thermal index (Rejas 2009), profiting from the separability between covers in the emissive spectrum of both sensors. We generated image convolutions using a median filter, that were used afterwards to make a ratio between 10.16 µm y 12.21 µm wavelengths, weighted corrected by ratio between each channel gain. We established thresholds on the resultant variable for highlighting detected pixels as possible anomalies.
[
(
)
(
)
]
where conv = image convolution median filter.
µ = radiance at sensor for wavelength.
&" , /.* - ( 2/
The relationship between spectral anomalies and hydrothermal alterations, obtained in previous paragraphs, has been studied. In order to do that, it has been linearly adjusted, a sample space of 35 pairs of points, placing spectral anomalies in the Y axis and altered minerals in the X axis. All regressions have been calculated at a confidence level of 95%, removing in each adjustment, the sample values that showed unusual residues and which correspond mainly with clouds and shadows. The results obtained are summarized in Tables 1 and 2.
! !" #
RX = 1101,61 + 9,86744*Alunite 0.0001 0.850365 72.31%
RX = 1528,05 1,92404*Illite 0.0379 0.554625 30.76%
RX = 611,046 + 1,03826*Kaolinite 0.0515 0.511091 26.12%
RX = 739,318 7,59725*Kaol+Sme 0.0182 0.599314 35.92%
RX = 834,65 + 3,50578*Fe minerals 0.0153 0.611924 37.45%
RX= 796,88 1,47957*Montmoroll 0.0851 0.45922 21.09% Table 1. Comparison of relationships between spectral anomalies and hydrothermal alteration, from HyMAP images.
Figure 3. Example of relationship between spectral anomalies RX and Alunite, from HyMAP images.
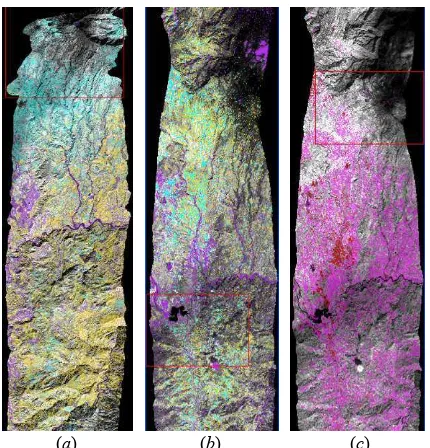
-190 -90 10 110 cyan, Illi yelow, Kaol purpel, Kaol+Sme purpel2, Mont maroon) from HyMAP image ( ), from MASTER image ($), and thermal index THI (red violet) between 10.16 µm and 12.21 µm from MASTER image ( ).
% !" #
RX = 79,4678 0,579643*Alunite 0.0004 0.811637 65.88%
RX = 69,1488 0,50982*Illite 0.0001 0.855083 73.12%
RX = 126,893 0,905153*Kaolinite 0.0178 0.620723 38.53% Table 2. Comparison of relationships between spectral anomalies and hydrothermal alteration, from MASTER images.
Among all linear models obtained, the one which shows a higher R squared value (73.12%), corresponds to the RX Illite from MASTER data.
The P value obtained less than 0.05 in all cases, except for RX kaolinite, RX montmorollonita from HyMAP, indicates that there is a statistically significant relationship and there is no indication of serial autocorrelation in the residuals at the level of confidence 95.0%.
The R squared statistic indicates that the adjusted models explain the variability in different percentages between hydrothermal alterations and spectral anomalies. The maximum correlation coefficients ( 0.831632 and 0.850365) indicate a moderately strong relationship between the corresponding variables.
There is correlation, positive or negative depending on the case, between hydrothermal alteration detected and spectral anomalies calculated from HyMAP reflective channels.
In the case of thermal anomalies, this relationship is not as consistent as the previous ones. However, this relationship is showed with biophysical parameters calculated and with effects associated to the volcanic activity. A special case is the crater itself, which is detected as a thermal anomaly, but it goes almost unnoticed as a spectral anomaly in the reflective range.
Hydrothermal alteration detected from HyMAP in Turrialba and environment, is linked to crops and bare areas, as well as to artificial surfaces (roofs of buildings mainly). This does not mean that in the vicinity of these areas there are not hydrothermal alteration minerals. It can be observed that the detection is strongly influenced by the contribution of the broad, dense and homogeneous natural vegetation cover existing on the spectral information recorded by space sensors.
4"
It has been carried out a comparative study of the spectral anomalies and the hydrothermal alteration materials detected from HyMAP and MASTER data, on the Turrialba volcano and its environment.
It has been found that a higher spectral resolution of the images improves accuracy in the detection of diagnostic bands of the hydrothermal alteration minerals analyzed. A higher dimensionality of the data implies however a greater number of samples to typify classes of materials.
Higher concentrations of hydrothermal alteration minerals, in scenarios where the sources of error (mainly vegetation) are minimized, are correlated with the anomalies calculated in the spectral range reflective. It has not been established a clear relationship between thermal anomalies and minerals analyzed.
The spectral mixing, associated directly with the spatial resolution, the airborne sensors and the satellites used, has an impact, in a significantly way, on the characterization of the background, and thus in the calculated spectral anomalies.
Antón Pacheco, C., Rowan, L.C., Mars, J.C. and Gumiel, J.C., 2001. Characterization of mine materials and hydrothermally altered rocks in the rio Tinto minning districy (southwest Spain) using HyMAP data. & , 2001. Number 16: 65 68 pp.
Bar, D.O., Wolowelsky, K., Swirski, Y., Figov, Z., Michaeli, A., Vaynzof, Y., Abramovitz, Y., Ben Dov, A., Yaron, O., Weizman, L. and Adar, R., 2010. Target detection and verification via airborne hyperspectral and high resolution imagery processing and fusion. ' , Vol. 10, No. 3, March 2010
Bataller, F.J., Rejas, J.G., Bonatti, J., Marchamalo, M. and Martínez, R., 2010. Detection of hydrothermal alteration using a principal component analysis applied to hyperespectral HyMAP data on the Turrialba volcano, Costa Rica ( )
* + , , Barcelona (Spain), 23 25
February 2011.
Cipar, J., Anderson, G. and Cooley, T., 2011. Active volcano monitoring using a space based short wave infrared imager.
! , * !% #-.., Lisbon (Portugal) 6 9 June 2011.
Cocks T., R. Jenssen, A. Stewart, I. Wilson, and T. Shields, 1998. The HyMAP Airborne Hyperspectral Sensor: The System, Calibration and Performance. ! . %
* + / ) , , (M. Schaepman, D.
Schläpfer, and K.I. Itten, Eds.), 6 8 October 1998, Zurich, EARSeL, Paris, p. 37 43.
Crosta, A. P., Filho, C. R. de Souza, Azevedo, F. and Brodie, C., 2003. Targeting key alteration minerals in epithermal deposit in Patagonia, Argentina, using ASTER imagery and principal component analysis. ' 0 )
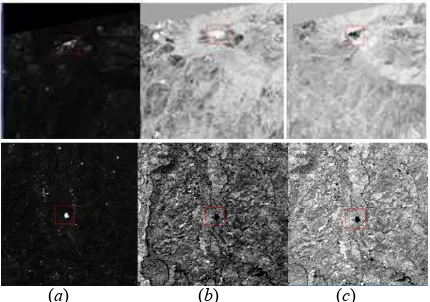
,, 10, pp. 4233 4240. Figure 4. Detail of RX spectral anomalies (a), Alunite (b)
and Illite (c), from 2005 HyMAP image in Turrialba crater (top). Detail RX spectral anomalies (a), Alunite (b) and Illite (c), from 2005 MASTER image on manmade cover (lower).
( ) ($) ( )
Duran, O. and Petrou, M., 2007. A time efficient method for anomaly detection in hyperspectral images. %%%
( ) ,, Vol. 45, No. 12, December
2007.
Eismann, M.T., Stocker, A.D. and Nasrabad, N.M., 2009. Automated Hyperspectral Cueing for Civilian Search and Rescue. ! , 0 / %%%, No. 6, June 2009.
Haboudane, D., Miller, J.R., Tremblay, N., Zarco Tejada, P.J. and Dextraze, T., 2002. Integrated narrow band vegetation indices for prediction of crop chlorophyll content for application to precision agriculture. ) , 0 % ) ., vol. 81, no. 2/3, pp. 416–426, Aug. 2002.
Hook, S. J. Myers, J. J., Thome, K. J., Fitzgerald, M. and A. B. Kahle, 2001. The MODIS,ASTER airborne simulator (MASTER) a new instrument for earth science studies. )
, 0 % ) , vol. 76, Issue 1, pp. 93 102.
Manolakis, D. and Shaw, G., 2002. Detection Algorithms for Hyperspectral Imaging Aplications. %%% , ! ,
Magazine, January 2002.
Malpica, J.A., Rejas, J.G. and Alonso, M C., 2008. A projection pursuit algorithm for anomaly detection in hyperspectral imagery. ! , 41 (11) pp: 3313 3327, 2008. ISSN 0031 3203.
Nasrabadi, N.M., 2008. Multisensor Joint Fusion and Detection of Mines Using SAR and Hyperspectral. ! , 0 %%%
#--1 0
Reed, I.S. and Xiaoli, Y., 1990. Adaptative multiple band CFAR detection of an optical pattern with unknown spectral
distribution %%% /
, ! ,, Vol. 38, No 10, October 1990.
Rejas J.G., Martínez R. and Malpica J. A., 2007. Hyperspectral remote sensing application for semi urban areas monitoring.
2 3 #--4 5/ %%% ( 6 ! ' * + / )
, 7 2 $ , Paris (France) 11
13 April 2007. IEEE, ISBN 1 4244 0711 7.
Rejas, J.G., Burillo, F., López, R., Cano, M.A., Sáiz, M.E., and Farjas, M., 2009. Integrating SAR data and hyperspectral analysis for the archaeological survey of the Segeda city, Spain. 3th International Conference on Remote Sensing in Archaeology, Tiruchirapalli (India). 3
#..1
#-.-Rondeaux, G., Steven, M. and Baret, F., 1996. Optimization of soil adjusted vegetation indices. ) , 0 % ) ., vol. 55, no. 2, pp. 95–107, Feb. 1996.
Rouse, J.W., Haas, R.H., Schell, J.A., Deering, D.W. and Harlan, J.C., 1974. Monitoring the vernal advancements and retrogradation of natural vegetation. NASA/GSFC, Greenbelt, D, p. 371, 1974. Final Report.
Schaum, A., 2005. Hyperspectral detection algorithms: Operational, next generation, on the horizon. ! , 0 /
85 / ) , ! , * + /
9 ! -:;
Stein, D.W.J., Beaven, S.G., Hoff, L.E., Winter, E.M., Schaum, A.P. and Stocker, A.D., 2002. Anomaly Detection from
Hyperspectral Imagery. %%% , ! , , <
January 2002.
http://earthexplorer.usgs.gov/
The present study has been partially suported by the research Project: Multi rotors UAV for hydrothermal alterations in the Costa Rica Volcanic Mountains. AL11 PID 16 (Technical University of Madrid University of Costa Rica) and MACOSACEN, Manejo comunitario de suelos y aguas en Centroamérica A2/037794/11 (AECID Spanish Agency for International Development Cooperation Technical University of Madrid).