A COMPARISON OF EMPIRICAL AND INTELIGENT METHODS FOR DUST
DETECTION USING MODIS SATELLITE DATA
M. Shahrisvand a, *, M. Akhoondzadeh a
a Remote Sensing Division, Department of Surveying and Geomatic Engineering, College of Engineering,
University of Tehran, Iran - (m.shahrisvand)@ut.ac.ir
KEY WORDS: Classification, Dust detection, Decision tree, ANN, SVM, MODIS.
ABSTRACT:
Nowadays, dust storm in one of the most important natural hazards which is considered as a national concern in scientific communities. This paper considers the capabilities of some classical and intelligent methods for dust detection from satellite imagery around the Middle East region. In the study of dust detection, MODIS images have been a good candidate due to their suitable spectral and temporal resolution. In this study, physical-based and intelligent methods including decision tree, ANN (Artificial Neural Network) and SVM (Support Vector Machine) have been applied to detect dust storms. Among the mentioned approaches, in this paper, SVM method has been implemented for the first time in domain of dust detection studies. Finally, AOD (Aerosol Optical Depth) images, which are one the referenced standard products of OMI (Ozone Monitoring Instrument) sensor, have been used to assess the accuracy of all the implemented methods. Since the SVM method can distinguish dust storm over lands and oceans simultaneously, therefore the accuracy of SVM method is achieved better than the other applied approaches. As a conclusion, this paper shows that SVM can be a powerful tool for production of dust images with remarkable accuracy in comparison with AOT (Aerosol Optical Thickness) product of NASA.
* Corresponding author.
1. INTRODUCTION
Every year a large amount of aerosols from dust storms are released into the atmosphere which may have potentialadverse impacts on the climate, environment, and air quality. Such dust storms can also pose a serious health risk for people with respiratory disorders. From a scientific view, understanding dust storms’ source, formation, propagation and composition is important to reduce their impact and predict their effect. The first and most important step in this field is dust detection.
Advancesin remote sensing like multispectral instrument allow imaging of atmospheric and earth material based on their spectral signature over the electromagnetic spectrum. Many articles have studied dust storms by means of different satellite images such as Landsat TM/ETM+(Wald, Kaufman et al. 1998),NOAA AVHRR and METEOSAT data (Fraser 1976, Legrand, Desbois et al. 1988, Ackerman 1989, Ackerman 1997).
Compared to other remotely sensed data, Moderate Resolution Imaging Spectroradiometer (MODIS) has some advantages such as more available useful narrow channels, and high spatial and radiation resolution. Two MODIS (Moderate Resolution Imaging Spectroradiometer) instruments the first launched on 18 December 1999 onboard the Terra Platform and the second on 4 May 2002 onboard the Aqua platform are uniquely designed (wide spectral range, high spatial resolution, and near daily global coverage) to observe and monitor atmospheric and other Earth changes.
Several algorithms have been proposed for dust detection using MODIS satellite imagery; Most of them are based upon the spectral behavior of dust and clouds both in the emissive
infrared and reflective bands (Physical-radiance based approaches). Qu et al. (2005) used Normalized Difference Dust Index (NDDI), a normalized ratio of 2.1μm band and blue band, to detect dust storms and monitor the moisture change of dust using MODIS images. Hao and Qu (2007) proposed a Thermal-infrared Dust Index (TDI) to detect Saharan dust storms by combining four MODIS thermal infrared bands. The proposed thermal-infrared dust index precisely matches MODIS AOT (aerosol optical thickness). However this method was tested only for dust detection over oceans. Huang et al. (2007) propose a combination of microwave and MODIS satellite imagery for dust detection in east of Asia. Although physical-based approaches are physical-based on physical properties and spectral signature of dust particles, the main disadvantage of these methods is their dependency on their thresholds that change in each region. Beside the physical approaches, classification
-based methods in recent years have been developed. Classification-based methods are more flexible and can solve complex problems. Rivas-Perea et al (2010) proposed two classification methods for dust storms detection using MODIS images via statistical classifiers. They used Maximum likelihood and Probabilistic Neural Networks (PNN) with feature sets extracted from MODIS spectral bands and feature sets vectors pixels values from the recovered bands B20, B29, B31, and B32. They demonstrated that PNN approach provides more accuracy and precision.
According to this fact, dust particles have different spectral signatures in other bands we increase dimension feature space considering spectral signature of dust, clouds and soil. We used three methods for dust detection in Middle East. The first method is a physical based approach proposed by Xie (2009). We made decisionsspecifying rules based on thresholds that he
had proposed,and images were classified by decision tree approaches. In the second method we use Multi-layer Perceptron neural network for classification images. In the last method weproposeSVM classifier. Finally the results of three methods were compared together and with OMAERUV AOD product.
2. DATA
We use MODIS Level 1-Bdata in this study for dust detection collected by both Aqua and Terra platform. MODIS has 36 spectral bands ranging in wavelength from 0.4 to 14.4 µm. 21 bands with 1km, 5 with 500m, and 2 with 250m nadir pixel dimensions. In order to equalize spatial resolutions all used bands have been resampled to 1km resolution.
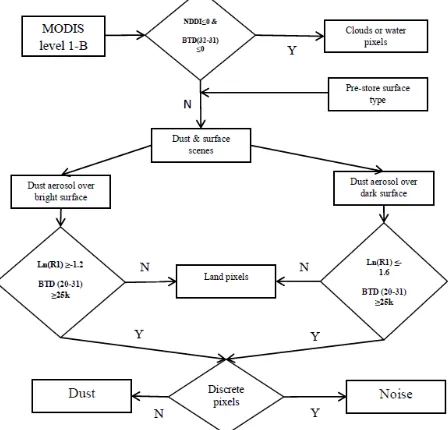
Considering the fact that increasing dimension of feature space without increasing the useful information reduces the accuracy, feature set is extracted from 36 MODIS spectral bands based on physical properties of dust particle and other classes (e.g. clouds and soil). The selected bands are 1, 2, 3, 4, 5, 6, 7, 17, 18, 19, (AOD) product from Ozone Monitoring Instrument (OMI) sensor. OMI sensor senses in 264 to 504 nm with spectral MODIS data. This method is useful for both regions, dark and bright surfaces and are used both in reflective and emissive bands. He used OMI and CALIPSO data for validation results. Results demonstrate that this method is able to detect main part of storms very well. We make use of efficient decision rule to classify our three images based on thresholds that were proposed by Xie.
The first threshold is NDDI that was obtained by normalized difference between band 3 and 7 in MODIS:
)
According to the subject stated above, NDDI can distinguish dust from cloud, water, and snow. The second threshold is the difference between brightness temperature in 11 and 12µm
bands. This difference is negative for clouds and positive for dust and soil. By applying these two thresholds dust is discriminated from cloud, snow, and water. Then by considering whether that region is dark or bright two thresholds have been applied for discriminating dust from soil. The flowchart of this algorithm is shown in Fig1.
Figure 1. Xie approach for dust detection
3.2 MLP Neural Network
Multi-layer Perceptron are feed-forward neural networks with one or more hidden layers. The most popular algorithm used for updating the neuronal activities and the interconnection weights in a multilayer perceptron is the back-propagation algorithm (Mather and Tso 2010) that we have employed in this research. It is well known that MLPs are able to construct arbitrary decision boundaries, and therefore are useful in dust detection domain. We use MLP neural network by three layers including: input layer, hidden layer, and output layer. In the context the number of inputs to the networks is determined by the number of features in each pixel. Therefore input layer in our prospered network includes seventeen neurons, that input of each neuron is value of reflectance in each selected band.
Similarly, the number of outputs is equal to the number of classes. Therefore output layer includes five neurons that determine which pixel belong to which class. The number of hidden layers is a free parameter and its value depends on the complexity of the classification problem and number of output classes.
A single hidden layer is thought to be adequate for most classification problems, but where there are large numbers of output classes, two hidden layers may produce a more accurate result (Mather and Tso 2010). In order to determine the optimum number of neurons in a hidden layer, training rate, and training momentum which influence the accuracy of classification have been obtained by iteration process to access maximum accuracy in classification results. In order to train the network we manually selected training data from different false color images.
3.3 SVM
SVM is not affected by limitation of training data and number of bands, with the aim of finding out the optimal hyperplane which can minimize the actual risk; therefore it is a sufficient tool to classify multi-spectral images. Neural Networks can solve the complex problems but these methods do not lead to unique solutions due to differences in their initial parameters, including the value of training rate, the number of hidden layers, and their number of neurons.
The attractiveness of SVMs is its ability to minimize the so-called structural risk, or classification errors, when solving the classification problem. This property is also different from the decision boundary–forming logic of ANN. Specifically, SVM training always finds a global minimum.
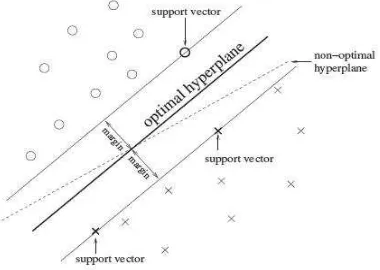
SVMs were originally linear binary classifiers, which allocate the labels +1 and −1. The core operation of SVMs is to construct a separating hyperplane (i.e., a decision boundary) on the basis of the properties of the training samples, specifically their distribution in feature space. Such a separating hyperplane is subject to the condition that the margin of separation between class +1 and class −1 samples is maximized (Vapnik 1979). Figure 2 illustrates this idea in which optimal hyperplane separates the two classes with maximal margin, while non-optimal hyperplanes do not fulfill the requirements of minimizing the structural risk. Not all training samples necessarilycontribute to the building hyperplane, and normally only a subset of training samples are chosen as support vectors. This attribute is unique to SVMs. As shown in Figure 2, only the marked points are support vectors that define the optimal hyperplane separating the two classes with maximal distance.
Figure 2. optimal plane separate two class with maximum margin
The kernel plays an important role for SVMs in solving problems because many issues are not linearly separable in their original dimensional space. Kernel transformation mapped the input data vectors in a high-dimensional space. By this SVM’s kernel have been selected by search in chain of C and γ that exponentially increase. We found the best values of γ=0.008 and C=100.
4. COMPARISION RESULTS AND DISCUSSION
Because of the lack of ground truth data, the validation of dust detection approaches is challenging. We use two different approaches for validation and comparison results. First we compare results from all three methods in paper with Another drawback of this product is low spatial resolution and lacking information on many pixels. Figures 3, 4 and 5 show the results of the decision tree method, MLP and SVM with AOD product.
The results indicate that SVM method can distinguish dust storm over lands and oceans simultaneously and also is able to identify areas of storm where dust density is less than the main mass of storm. But decision tree approach is only able to identify the main mass of dust storms and can’t distinguish the dusty region with lower density from the main mass of storm. Artificial neural network also can distinguish areas of storm that density is lesser than the main mass, however a large part of cloudy pixels especially in the border areas with dusty region, have been considered dust and caused uncertainly in estimating of the area of dusty region.
We manually select testing data for acquiring overall accuracy and kappa coefficient for quantification of the performance of two pattern recognition methods (table 1). Overall accuracy has been regardedto average the percentage of correct classification (Richards, 2013). Kappa coefficient measure map accuracy and can be obtained by some terms of the elements of confusion matrix; let these be represented by
ij
x , and suppose the total number of test pixels (observations) represented in the error matrix is P and k is number of class (Richards, 2013)
Then the kappa estimate is defined by
)
According to the obtained results, the SVM method has reached the higher accuracy and performance. Note that we use same
0.8510 88.0776%
2009 MLP
0.9115 92.8694%
2009 SVM
0.7185 77.2567%
2010 MLP
0.9170 93.3357%
2010 SVM
Table 1. The accuracy of classification methods
Figure 3. comparison of detected dust storm in 14 Sep 2008 with true color image and OMAERUV product, a)true color image, b) OMAERUV product, c) decision tree result, d) MLP result, and e) SVM result
Figure 4. Comparison of detected dust storm in 18 Jun 2009 with true color image and OMAERUV product, a) true color image, b) OMAERUV product, c) decision tree result, d) MLP result, and e) SVM result
5. CONCLUSION
The purpose of this research was identifying dust storms from MODIS imagery in Middle East area. In this paper for the first time we used SVM method in dust detection domain. We compared SVM results with MLP neural network classifier, decision tree method, and OMAERUV AOD product. Results demonstrated that SVM has a higher accuracy and precision rather than two other approaches and can be a powerful tool for production of dust images with remarkable accuracy, higher spatial resolution and real time in comparison with AOT (Aerosol Optical Thickness) product of NASA. The proposed method in this paper is able to real time processing at 1 Km
resolution which is an improvement compared to the 10 Km resolution provided by AOT. Another advantage of the SVM method is no requiring to any auxiliary data such as cloud masking. In this method cloud class has already been detected accurately and clouds have been considered in one class.
Figure 5. Comparison of detected dust storm in 4 Mar 2010 with true color image and OMAERUV product, a) true color image, b) OMAERUV product, c) decision tree result, d) MLP result, and e) SVM result
References
Ackerman, S. A. (1989). "Using the radiative temperature difference at 3.7 and 11 μm to tract dust outbreaks." Remote Sensing of Environment 27(2): 129-133.
Ackerman, S. A. (1997). "Remote sensing aerosols using satellite infrared observations." Journal of Geophysical Research 102(D14): 17069–17079.
Fraser, R. S. (1976). "satellite measurement of mass of Sahara dust in the atmosphere." APPLIED OPTICS 15.
Hao, X. and J. J. Qu (2007). "Saharan dust storm detection using moderate resolution imaging spectroradiometer thermal infrared bands." Journal of Applied Remote Sensing 1(1): 013510-013510-013519.
Hastie, T. and R. Tibshirani (1998). "Classification by pairwise coupling." The annals of statistics 26(2): 451-471.
Huang, J., et al. (2007). "Detection of Asia dust storms using multisensor satellite measurements." Remote Sensing of Environment 110(2): 186-191.
Legrand, M., et al. (1988). "Satellite Detection of Saharan Dust: Optimized Imaging during Nighttime." Journal of climate 1: 256-264.
Mather, P. and B. Tso (2010). Classification methods for remotely sensed data, CRC press.
Qu, J. J., et al. (2005). "A Study of African Dust Storm and Its Effects on Tropical Cyclones over Atlantic Ocean from Space." Geoscience and Remote Sensing Symposium: 2715 - 2718.
Richards, J. A. (2013). Remote sensing digital image analysis: an introduction, Springer.
Rivas-Perea, P., et al. (2010). Traditional and neural probabilistic multispectral image processing for the dust aerosol detection problem. Image Analysis & Interpretation (SSIAI), 2010 IEEE Southwest Symposium on, IEEE.
Vapnik, V. (1979). "Estimation of dependences based on empirical data." Nauka.
Wald, A. E., et al. (1998). "Daytime and nighttime detection of mineral dust over desert using infrared spectral contrast." Journal of Geophysical Research: Atmospheres 103(D24): 32307–32313.
Xie, Y. (2009). Detection of Smoke and Dust Aerosols Using Multi-sensor Satellite Remote Sensing Measurements. Department of Geography and GeoInformation Sciences, George Mason University. Doctor of Philosophy.