MATHEMATICAL MODELING OF SPATIAL DISEASE VARIABLES BY SPATIAL
FUZZY LOGIC FOR SPATIAL DECISION SUPPORT SYSTEMS
M. Platza,∗
, J. Rappa, M. Groesslera, E. Niehausa, A. Babub, B. Somanc
a
University of Koblenz-Landau. Institute of Mathematics, Fortstr. 7, 76829 Landau, Germany - (platz, rapp, groessler, niehaus)@uni-landau.de
b
Center for Advancement of Global Health, Kochi, India & Saint Louis University, St. Louis, USA - [email protected] c
Sree Chitra Tirunal Institute for Medical Sciences, Thiruvananthapuram, Kerala, India - [email protected]
KEY WORDS:Mathematical Modeling, Risk Mitigation, Spatial Decision Support System (SDSS), Spatial Fuzzy Logic, Early Warn-ing and Response System (EWARS), Open Source
ABSTRACT:
A Spatial Decision Support System (SDSS) provides support for decision makers and should not be viewed as replacing human intelli-gence with machines. Therefore it is reasonable that decision makers are able to use a feature to analyze the provided spatial decision support in detail to crosscheck the digital support of the SDSS with their own expertise. Spatial decision support is based on risk and resource maps in a Geographic Information System (GIS) with relevant layers e.g. environmental, health and socio-economic data. Spatial fuzzy logic allows the representation of spatial properties with a value of truth in the range between 0 and 1. Decision makers can refer to the visualization of the spatial truth of single risk variables of a disease. Spatial fuzzy logic rules that support the allocation of limited resources according to risk can be evaluated with measure theory on topological spaces, which allows to visualize the appli-cability of this rules as well in a map. Our paper is based on the concept of a spatial fuzzy logic on topological spaces that contributes to the development of an adaptive Early Warning And Response System (EWARS) providing decision support for the current or future spatial distribution of a disease. It supports the decision maker in testing interventions based on available resources and apply risk mitigation strategies and provide guidance tailored to the geo-location of the user via mobile devices. The software component of the system would be based on open source software and the software developed during this project will also be in the open source domain, so that an open community can build on the results and tailor further work to regional or international requirements and constraints. A freely availableEWARS Spatial Fuzzy Logic Demowas developed wich enables a user to visualize risk and resource maps based on individual data in several data formats.
1. INTRODUCTION
In this article, decision support for the user is considered; for example in the context of a hazardous situation, such as the epi-demiological outbreak of a disease, ecotoxicological or radioac-tive exposure or an accident situation. For this purpose we have to generate risk and resource maps, as well as adaptive Graphical User Interfaces (GUIs) tailored to different user groups, that sup-port the comprehension of the spatial sense for optimal decision support. The demand for an adaptive GUI arises from the differ-ing needs of various user groups. These groups can include, for example, decision makers such as governmental facilities, Public Health Agency (PHA)s, vector control units, medical doctors and nurses or users who find themselves in hazardous situations. In this paper, we focus on decision makers (e.g. a governmental fa-cility) and users who are in a hazardous situation. Consequently, we have the following requirements: The decision maker wants to know where to locate resources, and users in hazardous situa-tions want to know how they can protect themselves. Therefore, risk and resource maps are required. The terms “risk” and “re-source” are defined as follows:
“Risk is a quality that reflects both the range of possible outcomes and the distribution of respective probabilities for each of the out-comes.” (Norrman and Jansson, 2004). This can be expressed:
Risk=Probability (of an event)·Impact (or severity) of an event (1) (Norrman and Jansson, 2004).
“A Resource is something that can be used for support or help, an available supply that can be drawn on when needed.” (The
Amer-∗Corresponding author
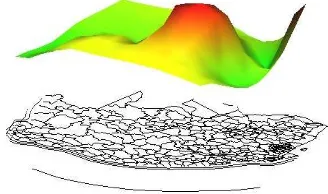
ican Heritage Dictionary of the English Language, 2009). A risk map assigns a risk to a geographic location (see figure 1), while a resource map assigns the availability of resources to a geographic location. Resources in this context can refer to, inter
Figure 1: Exemplary risk map. (Platz, 2014, p.3).
alia, medication, a medical staff member or information concern-ing, for example, actions to be taken such as therapeutic inter-ventions or preventive measures. Risk and resource maps can be combined with fuzzy logic to illustrate the degree of validity of a property at a certain geographic location. The risk and resource maps and, finally, the maps for decision support are developed using mathematical modeling.
mathe-matical modeling of public health issues. In this regard we have to model the distribution of resources and combine the risk maps with maps of available resources for optimal decision support and early warning and response. To develop a risk map for a disease, accurate information about the disease is essential, for example the transmission of the disease. Furthermore, treatment, preven-tion and possible mitigapreven-tion strategies for the disease are consid-ered, because if this information is communicated to the popu-lation via an appropriate communication channel it may help to reduce the spreading of the disease. The risk, resource and deci-sion support maps are processed and visualized using a GIS. Spa-tial decision support can be derived and delivered via Information and Communication Technology (ICT), for example mobile de-vices (e.g. smartphones) using an adaptive GUI, in areas where its distribution within the target audience is high.
Platz, 2014, deals with the mathematical modeling of GIS-tailored GUI design with the application of spatial fuzzy logic. She con-siders the mathematical visualization of risk and resource maps for epidemiological issues using GIS and adaptive GUI design for an open source application for digital devices. The intention of Platz, 2014, is to provide spatial decision support tailored to different user groups.
This method will be used within the EWARS and the SDSS de-scribed in this paper to adapt the information required by a user to the user’s needs.
2. OBJECTIVES 2.1 Common Objectives
TheResearchGroup Learning and Neurosciences (ReGLaN) -Health and Logisticsproject deals with interdisciplinary devel-opment aid to optimize the distribution of medical goods and ser-vices. The implementation of an EWARS and an SDSS tailored to different user groups is aimed in form of an open source ap-plication for digital devices with an adaptive GUI.Action Team 6 Follow Up Initiative (AT6FUI)deals with leveraging the potential of space technology for global health risk mitigation and health service delivery.
2.2 Objectives of this Paper
This paper is based on the concept of a spatial fuzzy logic on topological spaces that contributes to the development of an EWARS providing decision support for a current or future spatial distribu-tion of a disease. Using this approach, it is postulated that the health situation can be optimized by supporting decision makers in applying risk mitigation strategies and providing guidance to a user tailored to the geo-location of the user via mobile devices.
3. METHODOLOGY
In radiation, ecotoxicology and epidemiology we have invisible risks. A person, who is located in a risk area needs support for navigation and routing to minimize exposure to risk. Therefore, we deal with the questions: How can risk be made visible for a person located in a risk area and how can early warning and spatial decision support be provided to this person? How can we provide access to resources for risk mitigation? Risk can be visu-alized with a risk map.
Risk maps can be created with GIS (see sub-subsection 3.2.1) by considering spatial and temporal attributes, which determine the occurrence of diseases. They visualize regions and population groups with high risk for e.g. the outbreak of these diseases (cf. Yang et al., 2007).
Maps showing the temporal and spatial risk for the occurrence of
epidemic diseases are helpful tools for public health agencies or other institutions by supplying them with information for a Deci-sion Support System (DSS) (see sub-subsection 3.2.2). With the help of a DSS resources like water, vaccines or medical equip-ment can be located in an optimal way. Such risk maps were de-veloped for several factors influencing human health, for example the occurrence of dengue fever (cf. Hales et al., 2002), malaria (cf. Hay et al., 2004), water-associated infectious diseases (cf. Yang et al., 2012) or water scarcity (cf. Oki and Kanae 2006). Traditionally, GIS is used for route optimization in transport lo-gistics and the lolo-gistics process in supply chain management (cf. Hwang, 2004.). Hwang, 2004, shows on a developed 3D-GIS supply chain management tool the potential of a GIS in the field of route optimization that provides logistical optimization and how this can be customized depending on customer requirements. As Sarkar, 2007, determined in a study on GIS applications, GIS currently are becoming increasingly important also in other areas of logistics and resource optimization and still have great growth potential. This he attributes to the decreasing barriers due to the low cost of hardware and software, the increasing availability of digital map data and the possibility for flexible connection and use of databases and the internet.
Decision support tools have been used in public health, such as the research group led by Garg et al., 2005, had explored in a study. The investigated DSS tools have the task to support the decision makers in hospitals in all treatment decisions. Because these decisions often have no spatial reference on the low spatial level of a hospital, GIS-based software is not used in the study. GIS is used as DSS because the logistic optimization of medical resources on the high spatial level as a region or a country has a very strong spatial reference.
Ricketts, 2003, sees GIS in public health as an extension of the statistical analysis of epidemiological, sociological, clinical and economic data with spatial reference. According to Ricketts, 2003, GIS is applied in the areas of disease distribution and pro-vision of health care in general medical resources. The two ap-plication areas with the greatest potential for Ricketts, 2003, are epidemiology and telemedicine.
Yang et al., 2012, showed in a study on SDSS (see subsection 3.2) that applying the SDSS in endangered areas can prevent epi-demic diseases.
The core methodology demonstrated in this paper is the concept of a spatial fuzzy logic on topological spaces that contributes to the development of an EWARS providing decision support for a current or prospective spatial distribution of a disease. Con-sequently, the topics EWARSs, SDSSs, spatial fuzzy logic and measure theory on topological spaces will be addressed in more detail.
3.1 EWARS
Figure 2: Early warning and response cycle. (Compare: http://www.oosa.unvienna.org/pdf/pres/stsc2012/tech-10E.pdf; retrieved: 06 Nov. 2014).
3.2 SDSS
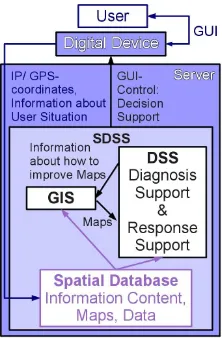
An SDSS (see figure 3) is a combination of GIS (see subsection 3.2.1) and DSS (see subsection 3.2.2). (cf. Yang et al., 2007). Spatial decision support is based on maps in a GIS with layers for e.g. environmental, health and socio-economic data.
An SDSS directed to epidemic disease prevention, for example, includes epidemic spread models in a GIS. Spatial information systems containing spatial and temporal data on epidemic dis-eases and their application models are intended to help health care facilities to implement and optimize disease surveillance and dis-ease monitoring. (cf. Yang et al., 2007).
However, an SDSS serves as a support for decision makers and should be viewed as a way of replacing human intelligence by machines. Therefore it is reasonable that decision makers are able to use a feature to analyze the provided spatial decision sup-port in detail to crosscheck the digital supsup-port of the SDSS with their own expertise.
Figure 3: General structure of an SDSS (Platz, 2014, p.17).
3.2.1 GIS A GIS is a tool for planning development and envi-ronmental control, as well as an instrument for decision support. On the one hand, it consists of a geo-referenced database, while on the other it comprises techniques for data acquisition, actual-ization, processing and visualization of the results. The semantic data are geometrically related to a homogeneous geo-referenced coordinate system, allowing for the controlled interrelation of the information. (B¨ahr and V¨ogtle, 1999, p.1).
3.2.2 DSS A DSS can be defined as a computer-based tool used to support complex decision making and problem solving.
It provides access to a wealth of information pertaining to a spe-cific problem. The following types of information are available: information content, maps and data. This information may be contained in databases and GIS. DSSs may help to answer ques-tions about the level of risk, the remedial technology opques-tions, the costs or whether the regulatory targets can be achieved. DSSs can provide powerful functionality for analysis, visualization, simu-lation and information storage that are essential to complex de-cision processes. Moreover, information and options can be pre-sented within an ordered structure, visualized from a space-time perspective, elaborated in simulated scenarios and therefore more easily discussed by the interested parties to reach a common re-habilitation objective. (cf. Shim et al., 2002, p.1 and Marcomini, A. et al., 2009, p. xviii f).
3.3 Spatial Fuzzy Logic
Fuzzy logic is used to represent uncertainties and ambiguities in linguistic descriptions. Moreover, fuzzy logic can be used for the generation of risk and resource maps and, thus, decision support maps. Spatial fuzzy logic allows to represent spatial properties with a value of truth in the range between 0 and 1.
3.3.1 Fuzzy Set A fuzzy set is characterized by a mappingµ
from an underlying setΩto the real unit interval:
µ: Ω→[0,1]. (2)
A fuzzy set differs from a classic set therein that for the image set of the indicator mapping not only the values0and1are allowed, but all real figures between them. (Biewer, 1997, p. 55 f).
Union of Fuzzy Sets: The union of two fuzzy setsAandB, characterized by the indicator mappingsmA : Ω→ [0,1]and
mB : Ω → [0,1]is a fuzzy set with the indicator mapping
mA∪B: Ω→[0,1], that it is for allx∈Ω:
mA∪B(x) = max{mA(x), mB(x)}. (3)
Or:
mA∪B(x) =mA(x) +mB(x)−mA(x)·mB(x). (4)
(cf. Biewer, 1997, p. 76 f and Traeger, 1993, p.38).
In figures 4 and 5 the union of fuzzy sets is illustrated. The union
Figure 4: Union of fuzzy sets with a one-dimensionalΩ.
of fuzzy sets can be used for the generation of risk, resource and decision support maps. With the union of fuzzy sets, the logical OR can be expressed. That is, if we consider two parameters for the generation of risk, resource or decision support maps repre-sented by membership mappings, they can be combined by using the union of fuzzy sets. I.e., if we consider two parameters con-tributing to the risk of a disease, i.e “1” indicates “high risk” and “0” indicates “low risk” and we want to find the locations with low risk, e.g. for finding possibly save tracks to pass a risk loca-tion i.e. localoca-tions, where the both membership mappings of the parameters contributing to the risk have a low value, the logical OR can be used.
Intersection of Fuzzy Sets: The intersection of two fuzzy sets
Figure 5: Union of fuzzy sets with a two-dimensionalΩ.
[0,1]and mB : Ω → [0,1]is a fuzzy set with the indicator mappingmA∩B : Ω→[0,1], that it is for allx∈Ω:
mA∩B(x) = min{mA(x), mB(x)}. (5)
Or:
mA∩B(x) =mA(x)·mB(x). (6)
(cf. Biewer, 1997, p. 76f and Traeger, 1993, p.37).
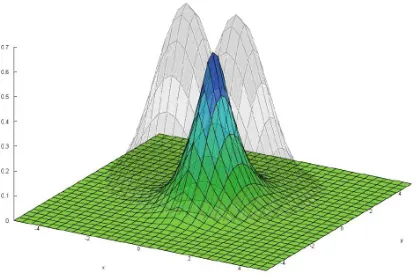
In figures 6 and 7 the intersection of fuzzy sets is displayed. The
Figure 6: Intersection of fuzzy sets with a one-dimensionalΩ.
Figure 7: Intersection of fuzzy sets with a two-dimensionalΩ.
intersection of fuzzy sets can be used for the generation of risk, resource and decision support maps, as well. With the intersec-tion of fuzzy sets, the logical AND can be expressed. That is, if we consider two parameters for the generation of risk, resource or decision support maps represented by membership mappings, they can be combined by using the intersection of fuzzy sets. I.e., if we consider two parameters contributing to the risk of a dis-ease, i.e “1” indicates “high risk” and “0” indicates “low risk” and we want to find the locations with high risk, e.g. to intervene in those locations (e.g. via early warning or resource provision), i.e. locations, where the both membership mappings of the pa-rameters contributing to the risk have a high value, the logical
AND can be used.
Complement of a Fuzzy Set: The complement of a fuzzy set
Acharacterized by the membership mappingmA: Ω→[0,1], is a fuzzy setA¯with the membership mappingmA¯: Ω→[0,1]
that it is for allx∈Ω:
mA¯(x) = 1−mA(x). (7)
(cf. Biewer, 1997, p. 77).
In figures 8 and 9 the complement of a fuzzy set is visualized.
Figure 8: Complement of a fuzzy set with a one-dimensionalΩ.
Figure 9: Complement of a fuzzy set with a two-dimensionalΩ.
The complement of fuzzy sets can be used for the generation of risk, resource and decision support maps, as well. With the com-plement of a fuzzy set, the logical NOT can be expressed. E.g. if a risk map is given and the user wants to rescue a person lo-cated in a risk area. Then a membership mapping to support the decision, if a person in a risk area can be saved, can be gener-ated. The distance is represented by this membership mapping, whereby the value “1” stands for “near” and “0” stands for “far away”. If we want to combine the risk map with the distance map, the complement of the distance map has to be considered. When combining the two mappings with the logical AND, the value “1” stands for “high risk and far away from the person, who is sup-posed to be saved”, and the value “0” stands for “low risk and near to the person who is supposed to be saved”.
3.4 Measure Theory on Topological Spaces
In contributing to the optimization of health service delivery, epi-demiological distances are, among others, identified as being an issue. However, these distances in the public health domain do not fulfill each property of the metric, thus the spaces being con-sidered may not be Euclidean spaces.
Fuzzy mappings operate on these general topological spaces. These fuzzy mappings can be measured with measure theory on topo-logical spaces. Spatial fuzzy logic rules that support the alloca-tion of limited resources according to risk can be evaluated with measure theory on topological spaces, which allows to visualize the applicability of this rule as well in a map.
4. TECHNOLOGY DESCRIPTION
The use of a GUI on a mobile device, e.g. smartphone, allows tai-lored information to different user groups to be visualized. The information for the user is location-specific by determining the location of the user via Global Positioning System (GPS). Older cellphones without GPS and internet can provide their approxi-mate location by determining the distance from the user to three transmitter masts by measuring the duration that is needed to send a signal from the mobile device of the user to the transmitter mast or vice versa. With triangulation, the geo-location of the user can be approximated. Open source software and open content for providing the application free of charge have proven suitable to make the application available for as many potential users as possible. Additionally, open source software can be easily en-hanced by local computer scientists to adapt the software to their needs. Consequently, the software component of the system will be based on open source software and the software developed during this project will also be in the open source domain, so that an open community (see section 7.) can build on the results and tailor further work to regional or international requirements and constraints. For the development of the application, we use inter alia the following open content: OpenStreetMap (OSM), a free wiki world map, in the sense of theHumanitarian OSM Team (HOT), an initiative for the use of open data and open source for humanitarian purpose. We needOSMfor our purpose among oth-ers to determine tracks that could be taken, e.g. by including the infrastructure. The following open source software is used:
• as GIS:GRASS GIS;
• for calculations and plots:GeoGebra, Maxima, gnuplot, R, LibreOffice Calc, Octave;
• for object oriented analysis (development of UML model): ArgoUML;
• for data collection:OpenDataKit, LimeSurvey, SDAPS;
• for visualization and navigation:Navit, Mixare.
To provide the application free of charge for smartphones, the operating systemAndroidis required. To relieve the digital de-vices, especially the mobile dede-vices, certain GUI-components are sourced out on a server. This is important, because it is energy saving and a charging-possibility is not available everywhere. Fur-thermore, time can be an important factor, especially in hazardous situations. By using a server for large calculations, time can be saved. For this outsourcing, an internet-connection is essen-tial. To make the application usable although there is no internet-connection available, an offline-usage of the application needs to be enabled. For a decision maker the option to be able to con-sider a location the decision maker is not located in needs to be implemented. As we want to reach a large mass of people with the application, it is developed not only for smartphones, but for several other mobile devices. If the mobile device does not have a screen, the decision support can be delivered via text messages. This method is maybe not that comprehensible as the visualization of the decision support, but it is at least a help for
the user. Additionally, we have to think about solutions for illit-erates and disabled users (e.g. (color-)blind users or wheelchair users), which are supposed to be implemented in the future.
5. DEVELOPMENTS
Allocating limited resources according to risk is a global prob-lem. Therefore the optimal distribution of resources is a chal-lenge decision makers have to face in several disciplines at differ-ent decision-making levels. Decision Support and Early Warning can be delivered based on risk and resource maps, compare Rapp, 2012, and Gr¨oßler, 2012.
Therefore, e.g. the risk of an epidemiological disease like malaria can be considered and resources in this context could be medica-tion that prevent infecmedica-tion or that treat infected persons or the communication of risk mitigation strategies and prevention mea-sures via the developed application. A decision maker is likely to be concerned with distributing those resources in an optimal way. Therefore risk and resource maps are combined for the genera-tion of decision support maps and special GUIs matching to the decision maker’s needs are developed. For the development of an adaptive GUI for an application for public health service de-livery, an important tool used throughout the whole development process is the application of mathematics and mathematical mod-eling. The further processing of risk and resource maps for the determination of decision support maps can be implemented with fuzzy logic membership mappings. Those membership mappings are a basal instrument to express e.g. the logistic supply quality or the impact of an epidemic on a person. Calculations can be op-erated with those membership functions, if the domain is equal. Thus, a common domain to connect the three topics logistics, epi-demiology and adaptive GUI-design is determined as follows:
XΩ:=
is the barycenter of the three-dimensional object
de-scribing the earth,T = IRthe time andR0 the distance from
the barycenterz to the earth’s surface at the time-pointt ∈ T
(averaged6371km).
kω−zk2= p
(ω1−0)2+ (ω2−0)2+ (ω3−0)2. (11)
(cf. Platz, 2014, p. 147).
This way, decision support maps can be generated and decision support can be communicated to the user via an adaptive GUI. The maps are processed and illustrated using visualization tools such as theEWARS Spatial Fuzzy Logic Demo(see figure 10) available at
http://mathematik.uni-landau.de/EWARS/
Figure 10: Screen-shot of theEWARS Spatial Fuzzy Logic Demo (http://mathematik.uni-landau.de/EWARS/).
is a free availablejavascript-tool to facilitate decision support for decision makers like public health risk managers and resource allocators via tailored visualisation in form of risk maps and re-source maps. This allows offline usage of the tool on mobile devices, if the mobile device is able to displayHTMLweb-pages with standardJavascriptembedded. The data-analysis performed inR,Octaveor evenLibreOfficecan be used within the visual-ization tool. Minimal information technology requirement will allow an easy to use interface for the visualized geo-referenced data. Several data-formats will be supported by the tool like the cvs-export fromLibreOffice Calcorgnuplot, orGRASS GIS ex-port. Manual alterations of data can be visualized immediately in the map. The concept allows the comprehension of the semantics of the spatial data with the consequence for visualization. The demands of a decision maker are the following:
Where and how to intervene?
• Who must be warned?
• Where to allocate resources?
• What advice and decision support can be delivered to the population?
An exemplary use case diagram for a decision maker is illustrated in figure 11. An exemplary risk map (see figure 12) was
imple-Figure 11: Exemplary use case diagram for a decision maker (cf. Platz, 2014, p. 199).
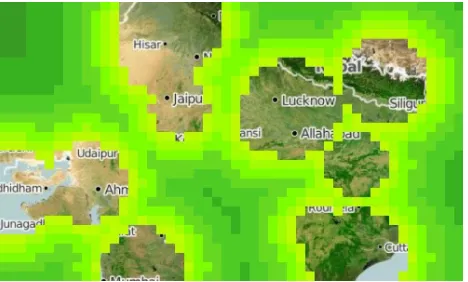
mented into theEWARS Spatial Fuzzy Logic Demo. Within the EWARS Spatial Fuzzy Logic Demothe function to visualize only those areas with a certain degree of risk represented by colors with color gradations from green to red, where “green” stands for “low risk” and “red” stands for “high risk” is implemented. In figure 13, only the high risk areas are illustrated. As a deci-sion maker has the aim to answer the question where to locate re-sources, the inverted map only marking low risk areas, where no
Figure 12: Exemplary risk map.
Figure 13: Exemplary visualization for a decision maker gener-ated with theEWARS Spatial Fuzzy Logic Demo.
resources are needed, could be more appropriate for easier com-prehension of the spatial sense of the visualization. This is real-ized in figure 14. In the background, anOSMmap is displayed and the visible locations outline proposals for locations for new resource distribution points. Adaptivity to the user, which is inter
Figure 14: Exemplary visualization for a decision maker gener-ated with theEWARS Spatial Fuzzy Logic Demo.
6. RESULTS
A freely availableEWARS Spatial Fuzzy Logic Demowas de-veloped wich enables a user to visualize risk and resource maps based on individual data in several data formats. The demo will be enhanced in the future to facilitate decision support for deci-sion makers like public health risk managers and resource allo-cators via tailored visualization of risk maps and resource maps. This method allows the comprehension of the semantics of the spatial data with the consequence for visualization. The concept of a spatial fuzzy logic on topological spaces that contributes to the development of an EWARS providing decision support for a current or prospective spatial distribution of a disease can cur-rently be implemented manually into theEWARS Spatial Fuzzy Logic Demo. The processes will be automatized in the future to ease the handling of the tool and the tool itself will be tested in empirical studies. The presented approach markedly differs from other efforts to provide decision-support in the way to vi-sualize the truth of spatial support ranging from fuzzy logic rules down to the detail of a single variable and supports the decision maker in testing interventions based on available resources and apply risk mitigation strategies and provide guidance tailored to the geo-location of the user via mobile devices. With the devel-oped method for problem solving, a generative structure for other problems with a similar structure is developed. Furthermore, the developed concept can be enhanced by e.g. adding, deleting or replacing parameters.
7. OPEN COMMUNITY
The concept of open community is used as measure and draft strategy for a participative communication and efficient knowl-edge management. Open community is a generalization of the concept of open source to other collaborative effort. The term “open” for an open community refers to the opportunity for any-one to join and contribute to the collaborative effort. The direc-tion and goals are determined collaboratively by all members of the community. The resulting work (“product”) is made avail-able under a free license, so that other communities can adapt and build on them, (Niehaus, 2013). Using this concept, already developed components of open source software and open content can be modified and adjusted for the development of the appli-cation. The advantage is faster development, improvement and distribution of the application. The application can be provided free of charge.
8. CONCLUSIONS
A freely availableEWARS Spatial Fuzzy Logic Demowas de-veloped wich enables a user to visualize risk and resource maps based on individual data in several data formats. The demo will be enhanced in the future to facilitate decision support for deci-sion makers like public health risk managers and resource allo-cators via tailored visualization of risk maps and resource maps. The development of a tool to facilitate decision support for de-cision makers via tailored visualization in form of risk maps and resource maps for public health service delivery is an important tool backed by the application of mathematics and mathematical modeling throughout the development process. The further pro-cessing of risk and resource maps for the determination of deci-sion support maps can be implemented with fuzzy logic member-ship mappings. These mappings are a basal instrument to express e.g. the logistic supply quality or the impact of an epidemic on an individual. Calculations can be operated with those member-ship functions, if the domain is equal. Thus, a common domain
to connect the three topics logistics, epidemiology and adaptive GUI-design,XΩ(see section 5.), was determined. This way, de-cision support maps can be generated and dede-cision support can be communicated to the user via adaptive GUIs. Adaptivity to the user, which is inter alia based on the environmental parame-ters influencing the user, shall be achieved by including site- and user-specific information and data that is collected during the re-search process.
By using the concept of open community, already developed com-ponents of open source software and open content can be mod-ified and adjusted for the development of the application. The advantage is faster development, improvement and distribution of the application. Furthermore, the application can be provided free of charge.
ACKNOWLEDGEMENTS
The working group for mathematical modeling of the Institute of Mathematics of the University Koblenz-Landau, Campus Lan-dau delivers to the projectReGLaN-Health and Logisticswith the aim to optimize health service delivery in South Africa and to the AT6FUIwith the aim to provide an early warning mechanism for infectious diseases.
REFERENCES
B¨ahr, H.-P. and V¨ogtle, T. (editors), 1999. GIS for environmental monitoring. Schweizerbart, Stuttgart.
Biewer, B., 1997. Fuzzy-Methoden. Springer-Verlag Berlin, Hei-delberg, New York.
Garg, A.X., Adhikari, N.K., McDonald, H., et al., 2005. Effects of Computerized Clinical Decision Support Systems on Practi-tioner Performance and Patient Outcomes: A Systematic Review, JAMA, Vol. 293 No.10, pp. 1223-1238.
Giorgi, G., Guerraggio, A., and Thierfelder, J. (editors), 2004. Mathematics of Optimization. Elsevier B.V..
Gr¨oßler, M., 2012. Decision Support System and Logistics Opti-misation of Medical Resources for Risk and Response.
http://youtu.be/Fuivvy9hkSE (retrieved 06 Nov. 2014).
Hales, S., de Wet, N., Maindonald, J. and Woodward, A., 2002. Potential effect of population and climate changes on global dis-tribution of dengue fever: an empirical model, The Lancet, Vol. 360, pp. 830-834.
Hay, S., Guerra, C.A., Tatem, A., Noor, A. and Snow, R., 2004. The global distribution and population at risk of malaria: past, present, and future, The Lancet Infectious Diseases, Vol. 4 No. 6, pp. 327-336.
Hwang, H., 2004. An overview of GIS in Logistics/SCM sys-tem, Proceedings of the Fifth Asia Pacific Industrial Engineering and Management Systems Conference, Gold Coast, Australia, pp 38.2.1-38.2.11.
Maier, W. A., 2002. Umweltver¨anderungen und deren Einfl¨usse auf krankheits¨ubertragende Arthropoden in Mitteleuropa am Beispiel der Stechm¨ucken. In:Denisia 6,Kataloge des O ¨O Landesmuse-ums, volume 184 (neue Folge), pp. 535547.
Niehaus, E., 2013. Definition: Open Community - Action Team 6 Follow-Up Initiative. http://at6fui.weebly.com/open-community-approach.html (retrieved 06 Nov. 2014).
Norrman, A. and Jansson, U., 2004. Ericssons proactive sup-ply chain risk management approach after a serious sub-supplier accident. International Journal of Physical Distribution and Lo-gistics Management, 34:434456.
Oki, T. and Kanae, S., 2006: Global Hydrological Cycles and World Water Resources, Science, Vol. 313 No. 5790, pp. 1068-1072.
Platz, M., 2014. Mathematical Modelling of GIS Tailored GUI Design with the Application of Spatial Fuzzy Logic. Universitt Koblenz-Landau. http://kola.opus.hbz-nrw.de/volltexte/2014/965/
Rapp, J., 2012. Creation of Global Pesticide Application Maps. http://youtu.be/xkT-lhKepSs (retrieved 06 Nov. 2014).
Ricketts, T., 2003. Geographic Information Systems and Public Health, Annual Review of Public Health, Vol. 24, pp. 1-6.
Sarkar, A., 2007. GIS Applications in Logistics: A Literature Review, U.S. SBA, Grant No. SBAHQ-06-1-0046.
Shim, JP, Warkentin, M., Courtney, JF, Power, DJ, Sharda R., and Carlsson, C., 2002. Past present and future of decision support technology. In:Decision Support Systems, volume 33, pp. 111-126.
The American Heritage Dictionary of the English Language, 2009. 4 edition.
Traeger, D. H., 1993. Einf¨uhrung in die Fuzzy-Logik. B.G. Teub-ner Stuttgart.
Yang, K., LeJeune, J., Alsdorf, D., Lu, B., Shum, C.K. et al., 2012. Global Distribution of Outbreaks of Water-Associated In-fectious Diseases, PLoS Neglected Tropical Diseases, Vol. 6 No. 2, e1483.