MANGROVE PLANTATION FOREST ASSESSMENT USING STRUCTURAL
ATTRIBUTES DERIVED FROM LIGHT DETECTION AND RANGING (LiDAR) DATA
R. A. G. Faelga a,b, E. C. Paringit a, G. J. P. Perez b, C. A. G. Ibanez a, R. A. L. Argamosa a, M. A. V. Posilero a, G. P. Zaragosa a, F. A. M. Tandoc a, M. V. Malabanan a *
a Project 3: Forest Resource Extraction from LiDAR Surveys, Phil-LiDAR 2, University of the Philippines, Diliman, Quezon City,
1001, Metro Manila, Philippines - (reginefaelga, paringit, i.carlynann, regi.argamosa, markposi, gio.zaragosa, tandoc.fe, matt.malabanan)@gmail.com
b
Institute of Environmental Science and Meteorology, College of Science, University of the Philippines, Diliman, Quezon City, 1001, Metro Manila, Philippines – ([email protected], [email protected])
Commission VIII, WG VIII/7
KEY WORDS: Mangroves, Rhizophoraceae, Plantation, Point Cloud, LiDAR
ABSTRACT:
Estimating the structural and functional attributes of forests is integral in performing management strategies and for understanding forest ecosystem functions. Field sampling methods through plot level is one of the known strategies in forest studies; however, these methods have its limitations and are prone to subjected biases. Remote Sensing data, particularly that of Light Detection and Ranging (LiDAR) can be utilized to alleviate the limitations of extracting forest structure parameters. The study aims to characterize a Rhizophoraceae-dominated mangrove forest plantation. Point cloud distribution within a 1-hectare plot was processed by utilizing thirty (30) samples of 5x5 meter plots, which were analysed for the characterization and forest structure assessment. Point densities were grouped at intervals of 10% of the plot’s maximum height (Height at Bincentile or HBn) to determine where the clustering of points occur per plot. The result shows that most of the points are clustered at HBn with height values ranging from 2.98 to 4.15 meters for plots located at the middle part of the forest, with a standard deviation of 1.78 to 3.69, respectively. On the other hand, sample plots that are located at the periphery part of the forest shows that the point clustering occurs at different heights ranging from 1.71 meters to 4.43 meters, with standard deviation values ranging from 1.69 to 3.81.Plots that are located along the fringes of the forest reflect a stunted clustering of points, while plots that explicitly show mangrove trimmings and cuts reflect even distribution in terms of point density within each HBn. Both species present in the area (R. mucronata and R. apiculata) exhibits similar clustering, which could represent detection of Rhizophoraceae mangroves.
* Corresponding author
1. INTRODUCTION
Mangroves are intertidal tree species that provide vast benefits both on a natural and socio-economic aspect. Mangroves are considered as one of the most productive ecosystems on Earth having a mean production of 2.5g C m-2 (Jennerjahn & Ittekot, 2002). These nutrient-rich wetlands also generate ample goods and services to society (Kathiresan & Rajendran, 2006). Therefore, understanding its overall structure is integral to enhance existing knowledge on mangrove conservation and management.
The dawn of remote sensing technology and its application on mangrove forest studies have yielded timely and less biased results compared to the traditional in-situ data gathering process. Remote-sensing and GIS-based processing is an effective tool to provide a synoptic view that may be difficult through in-situ method alone. This type of processing generated very important results for the ecological knowledge of mangrove ecosystems (Santos & Bitencourt, 2016). Furthermore, the emergence of LiDAR technology as a remote sensing tool levelled the notch for it provided even better results at higher resolution.
This paper presents mangrove forest assessment, particularly that of a mangrove plantation forest using the point density distribution from LiDAR. Clustering of points are analysed to determine whether the forest dynamics are possible to detect and understand through utilization of LiDAR data.
2. DATA AND METHODS
2.1Site Description
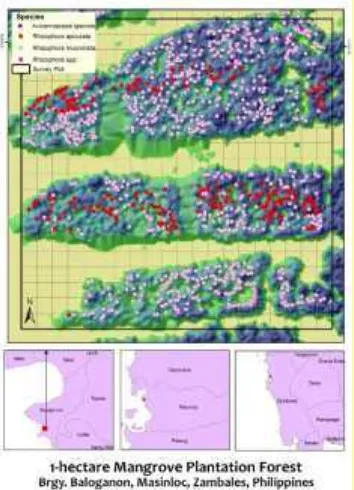
Located on the province of Zambales, this coastal mangrove forest is a two (2) hectare mangrove plantation in one of the barangays of the municipality of Masinloc. This is a fringe mangrove forest wherein Rhizophoraceae mangroves dominate, specifically R. mucronata and R. apiculata. For this study, only one (1) hectare will be used for the analysis.
Figure 1. Location Map of the study site in Brgy. Baloganon, Masinloc, Zambales
The site was surveyed for field validation on November 2015. Collection of data such as individual tree geotagging and DBH measurement were made to validate the acquired LiDAR data. Measurement of sample Tree Heights, canopy cover using Digital Hemispheric Photography (DHP), and supplemental characterization using Terrestrial Laser Scanner (TLS) were also executed.
2.2LiDAR Data
The LiDAR data used for this study is an airborne LiDAR data obtained from flight 939P of Pegasus (Optech Inc) on 13 January 2014. The flight has a flying height of 1323 meters above ground and that covers ground at 2 pulses per square meter.
2.3LiDAR Processing
The raw LiDAR data was initially pre-processed to normalize the points in relation to the elevation values. From the adjusted points, vegetation points are filtered and will serve as the input to compute the necessary LiDAR derivatives such as the Canopy Height Model (CHM), the Height at bincentile (HBn) and the non-cumulative bincentile (NCBn) values. These derivatives will then be used for the structure assessment of the Rhizophoraceae mangroves in this fringe plantation forest.
The HBn are the height values at intervals of 10% of the plot’s maximum height.The NCBn on the hand, are the number of points or point density per HBn. Each 5x5 meter plot samples were processes to extract its corresponding HBn and NCBn values.
The other LiDAR derivatives are also extracted as supplemental data for the structure assessment. Table 1 shows the summary of the LiDAR derivatives.
LiDAR Parameter Description
NCB10
Number of points at the 10% interval of max height
NCB20
Number of points at the 20% interval of max height
NCB30
Number of points at the 30% interval of max height
NCB40
Number of points at the 40% interval of max height
NCB50
Number of points at the 50% interval of max height
NCB60
Number of points at the 60% interval of max height
NCB70
Number of points at the 70% interval of max height
NCB80
Number of points at the 80% interval of max height
NCB90
Number of points at the 90% interval of max height The International Archives of the Photogrammetry, Remote Sensing and Spatial Information Sciences, Volume XLI-B8, 2016
NCB99
Number of points at the 99% interval of max height
AVG Average height
COV Canopy Cover
DNS Density
KUR Kurtosis
MAX Maximum Height
MIN Minimum Height
P01 First percentile
P05 Fifth percentile
P10 Tenth percentile
P25 Twenty fifth percentile
P50 Fiftieth percentile
P75 Seventy fifth percentile
P90 Ninetieth percentile
P95 Ninety fifth percentile
P99 Ninety ninth percentile
QAV Quadratic average
SKE Skewness
STD Standard deviation
Table 1. Summary of the LiDAR derivatives
2.4Plot Location
The sample plots were initially categorized depending on its location in the riverine mangrove forest. The location of the plots may either be on the middle part of the forest or at the periphery. This distinction is established in order to determine whether there is an eminent difference in terms of shape structure and point density distribution on the two types of locations. Fifteen (15) sample plots of pure Rhizophoraceae located at the middle part of the forest was selected, along with another fifteen (15) pure Rhizophoraceae plots located at the periphery part of the mangrove forest. A total of thirty (30) plots was used in for this study.
2.5Structure Typology
Structure typology or the set of criteria for the mangrove structure assessment was established in this study to come up with a methodology to assess this mangrove plantation forest.
The initial structure typology has three major components: Height, Shape, and Canopy Cover. These are the LiDAR derivatives that will be primarily used for the structure characterization of the prominent Rhizophoraceae mangroves in the site.
For the height, the maximum height of each 5x5 meter sample plot were identified and a set of sub-criteria is created, wherein each plot will be categorized accordingly.
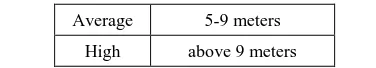
Height Max Height value
Stunted 3-4 meters
Average 5-9 meters
High above 9 meters
Table 2. The established sub-criteria for the height factor
The shape factor categorize each plot based on its measure of central tendency by computing the weighted mean and the corresponding standard deviation values for each sample plot. This is used to quantify the clustering shape of each plots’ point density distribution. The mean of the weighted mean for each plot will be analysed. The weighted mean is computed using the formula:
(1) Where:
∑=summation = weighted mean
wi= weight given to the point density at certain HBn Xi= summation of HBn
In addition, the canopy cover values derived from LiDAR will serve as the third factor in the structure characteristics. The canopy cover is computed as:
CCLiDAR= # of 1st returns above the cover cut-off (1.37m) All first returns (2)
Further analysis of the canopy cover was done in order to enhance the characterization process. The relationship between the number of trees and its corresponding field DBH to the LiDAR canopy cover values was investigated as well.
3. RESULTS AND DISCUSSION
All the factors were taken into account during the structure characterization and analysis. All 30 5x5 meter sample plot were processed and thoroughly examined to come up with a set of descriptors for this mangrove plantation forest.
3.1LiDAR point cloud
The normalized point cloud data is shown in Figure 2, wherein the vegetation points are filtered. Figure 2 and 3 illustrated the NCBnlayers and the derived CHM.
Figure 2. Point cloud data are classified as ground and vegetation
Figure 3. The clustering of points at 10% of maximum height or NCBn
Figure 4. The derived Canopy Height Model (CHM) for the site in Brgy. Baloganon, Masinloc, Zambales, Philippines
3.2 Height Characteristics
The maximum height of each sample plot were identified and categorized accordingly. The results showed that 100% of the sample plots located at the middle part of the forest have average canopy height values ranging from 5-9 meters only. On the other hand, 6.67% and 93.33% of the sample plots located at the periphery part of the forest stunted growth and average growth respectively.
3.3 Shape Characteristics
To understand the overall structure of the Rhizophoraceae mangrove in a fringe mangrove forest, the shape characteristics was also taken into account through computing the weighted mean values of the point density clustering per plot.
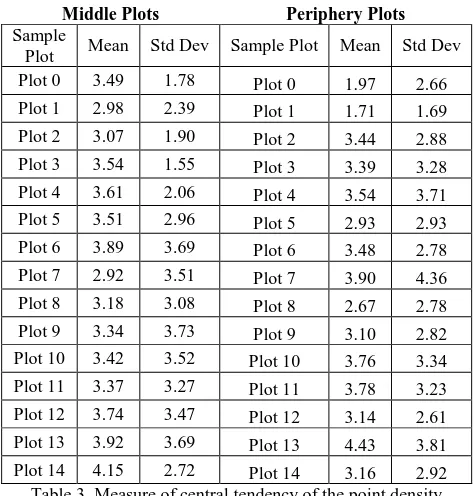
Majority of the sample plots that are located at the middle part of the forest have majority of its point density occur at around 2.98 to 4.15 meters, with a standard deviation of 1.78 to 3.69, respectively. On the other hand, sample plots that are located at the periphery part of the forest shows that the point clustering occurs at different heights ranging from 1.71 meters to 4.43 meters, with standard deviation values ranging from 1.69 to 3.81 as shown in Table 3.
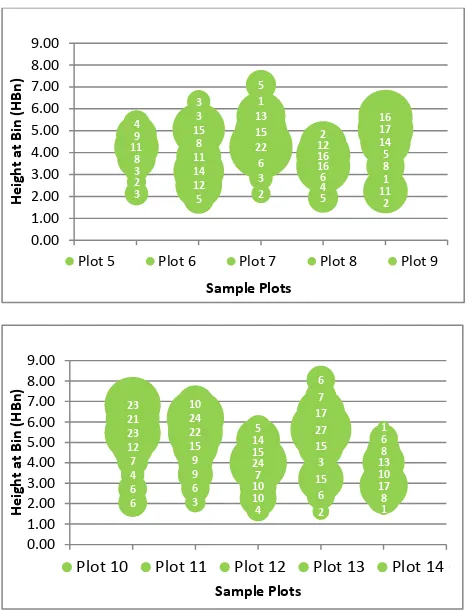
The result also shows that most of the plots that are located along the middle or the inner part of the forest are more intact and the point density clustering is consistent. On the contrary, inconsistent point density clustering is evident in the sample plots located at the periphery part of the forest, which could be due to its exposure to several environmental stressors such as tidal fluctuation and exposure to wind action. Figure 5 and 6 shows the visual representation of the height and point density distribution using column blobs.
Middle Plots Periphery Plots
Sample
Plot Mean Std Dev Sample Plot Mean Std Dev Plot 0 3.49 1.78 Plot 0 1.97 2.66
Plot 1 2.98 2.39 Plot 1 1.71 1.69
Plot 2 3.07 1.90 Plot 2 3.44 2.88
Plot 3 3.54 1.55 Plot 3 3.39 3.28 Plot 4 3.61 2.06 Plot 4 3.54 3.71
Plot 5 3.51 2.96 Plot 5 2.93 2.93
Plot 6 3.89 3.69 Plot 6 3.48 2.78
Plot 7 2.92 3.51 Plot 7 3.90 4.36
Plot 8 3.18 3.08 Plot 8 2.67 2.78
Plot 9 3.34 3.73 Plot 9 3.10 2.82 Plot 10 3.42 3.52 Plot 10 3.76 3.34
Plot 11 3.37 3.27 Plot 11 3.78 3.23
Plot 12 3.74 3.47 Plot 12 3.14 2.61
Plot 13 3.92 3.69 Plot 13 4.43 3.81
Plot 14 4.15 2.72 Plot 14 3.16 2.92 Table 3. Measure of central tendency of the point density
clustering per sample plot.
Figure 5. Visualization of the point density distribution clustering for sample plots located at the middle part of the
forest
Figure 6. Visualization of the point density distribution clustering for sample plots located at the periphery of the forest
3.4 Canopy Cover Characteristics
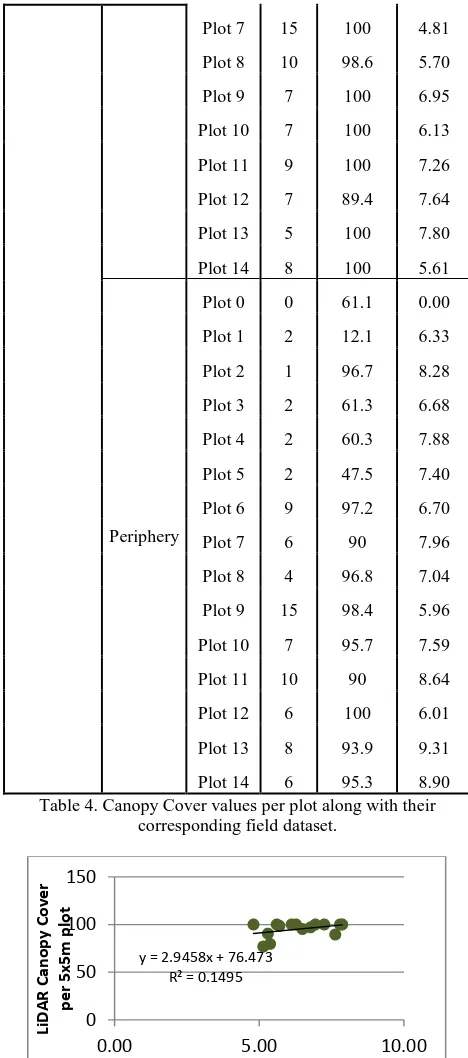
The canopy cover derived from LiDAR was also examined to further enhance the characterization study. The number of trees per plot, as well as the average Diameter at Breast Height (DBH) that was collected in-situ were correlated to the Canopy Cover values. The overall canopy cover of the sample plots located at the middle parts of the forest have Medium (80-94.99) to High (95-100) canopy cover, while plots that are located along the peripheries have values ranging from Low (below 80) to High (95-100) as shown in Table 4.
The correlation between LiDAR canopy cover and Field DBH suggest that there is a direct relationship between the two as shown in Figure 7 and 8, respectively. However, it was also observed that the individual tree species situated in each sample plot greatly influence the correlation. The different cases and the corresponding correlation is shown in Table 5.
Functional
Plot 10 Plot 11 Plot 12 Plot 13 Plot 14
1
Plot 10 Plot 11 Plot 12 Plot 13 Plot 14
Plot 7 15 100 4.81 Table 4. Canopy Cover values per plot along with their
corresponding field dataset.
Figure 7. Linear Regression equation of the CC and DBH correlation for the sample plots located at the middle part of the
forest.
Figure 8. Linear Regression equation of the CC and DBH correlation for the sample plots located at the periphery part of
the forest
Case 1 High High Direct relationship between CC and DBH
Case 2
High Low Number of trees included in the computation
Tree spacing
competition for sunlight
Case 3 Low High
damaged mangroves (anthropogenic or naturally
induced)
Case 4 Low Low mangrove regenerants or young mangroves
Case 5 with CC data no field DBH
trees may be existing at the time of acquisition, but are already non -existing at the time of field validation
Table 5. Different cases of correlation between LiDAR canopy cover values and Field DBH
4. CONCLUSION
LiDAR can serve as an important tool to accurately characterize the mangrove forest using LiDAR derivatives such as the Canopy Height, Point density distribution, and canopy cover values. Upon examining each LiDAR derivatives, particularly that of canopy height and point density distribution values, it was found out that the Rhizophoraceae mangroves that are planted in this forest mostly have stunted growth, having height values ranging from 5 to 9 meters. The study proved that the growth of Rhizophoraceae shows consistent pattern in terms of point density distribution if located at the middle part of the forest. Consequently, Rhizophoraceae that are located at the periphery part of this plantation forest have inconsistent point density clustering due to immediate exposure to certain environmental stressors. The canopy cover could also serve as an integral tool to characterize Rhizophoraceae in this type of mangrove forest. LiDAR-derived canopy cover could also be used as an initial data to understand gap dynamics and provide insights to understand the mangrove forest stand. Therefore, immediate assessment of the overall Rhizophoraceae plantation can be done by utilizing the above-mentioned LiDAR derivatives.
ACKNOWLEDGEMENTS
This research is funded by the Department of Science and Technology (DOST) under the Nationwide Detailed Resource Assessment Using LiDAR (Phil-LiDAR 2), Project 3: Forest Resource Extraction from LiDAR Surveys (FRExLS). Utmost acknowledgement is given to the Disaster Risk and Exposure Assessment for Mitigation (UP DREAM) and Phil-LiDAR 1 for the LiDAR data of the study site. Due recognition is also given to the municipality of Zambales for its assistance during the field validation survey.
y = 2.9458x + 76.473
Average Field DBH per 5x5m plot (Middle)
y = 3.3943x + 56.067
Average Field DBH per 5x5m plot …
REFERENCES
Jennerjahn, T. C., & Ittekkot, V. (2002). Relevance of mangroves for the production and deposition of organic matter along tropical continental margins. Naturwissenschaften, 89, 23-30.
Kathiresan, K., & Rajendran, N. (2006). Coastal mangrove forests mitigated tsunami. Estuarine, Coastal and Shelf Science, 65(3), 601-606.
Lugo, A.E. and Snedaker, S.C. (1974). The ecology of ma ngroves. Ann. Rev. Ecol. Syst., 5 : 39-64.
Santos, L.; Bitencourt, M. (2016). Remote sensing in the study of Brazilian mangroves; review, gaps in the knowledge, new perspectives and contributions for management. Journal of Integrated Coastal Zone Management; doi: 10.5894/rgci662