Editors
Nik Maheran Nik Muhamad Yeop Hussin Bidin Wan Hasni Wan Hasan
Anidzan Ariffin Maidin Idrus Marhaini Hassan Mohd Idzwan Mohd Salleh Nazatul Shahreen Zainal Abidin
© University Publication Centre (UPENA), UiTM 2008
All rights reserved. No part of this publication may be reproduced, copied, stored in any retrieval system or transmitted in any form or by any means – electronic, mechanical, photocopying, recording or otherwise ; without prior permission in writing from the Director of University Publication Centre (UPENA), Universiti Teknologi MARA, 40450 Shah Alam, Selangor Darul Ehsan, Malaysia. e-mail: [email protected]
Perpustakaan Negara Malaysia Cataloguing-in-Publication Data ECER Regional Conference (2008 : Kota Bharu, Kelantan)
Thrusting Islam, knowledge and professionalism in ECER development : ECER Regional Conference 2008, 15-17 December 2008, Renaissance
Hotel, Kota Bharu, Kelantan, Malaysia / [editors Nik Maheran Nik Mu… [et al.]. ISBN 978-967-305-264-6
1 . Economic development--Malaysia--Congresses. 2. Malaysia--Economic conditions--Congresses. I. Nik Maheran Nik Muhamad. II. Title.
338.9595
Cover design : Siti Fairuz Md. Hashim Typesetting : Amirazlan b. Abdul Razak Typeface : Times New Roman
Typesize : 10/14
TABLE OF CONTENTS
Preface xi
Proceedings Committee xiii
NO. CODE PAPER TITLE PAGE
1 BM(01) Investment Decision Behavior: Are Investors Rational Or Irrational? 1 2 BM(02) The Importance Of Corporate Image To A University 11 3 BM(03) The Factors Effective To Succeed In Implementing Activity Based Costing And
Management 23
4 BM(04) Saving Behavior In Malaysia: An Empirical Study 33
5 BM(05) A Comparative Study On Corporate Governance Compliance Versus Syaria’
Compliance In Malaysia 41
6 BM(06) Kecenderungan Umat Islam Terhadap Konsep Pemakanan Halal : Kajian Di
UiTM Pulau Pinang 57
7 BM(07) The Path Towards Convergence Of Malaysia’s Corporate Governance System 69 8 BM(08) Local Cuisines In The Marketing Of Tourism Destinations: The Case Of Kelantan 81 9 BM(09) The Factors Influencing Changes Of Shopping Orientation Towards Hypermarket
Among The Kelantanese 91
10 BM(10) Application Of Human Resource Information System (Hris) In Higher Education
– Holistic Approach 103
11 BM(11) Bursa Malaysia Reaction Towards The East Coast Economic Region (Ecer)
Announcement: An Empirical Evidence 113
12 BM(12) Are Islamic Incomes Relevant To Commercial Banks In Malaysia? 125 13 BM(13) Factors Influencing Public Acceptance Of Gold Dinar Investment In Kelantan 143 14 BM(14) The Effect Of Currency Risk On Manufacturing Industries Performances In
Malaysia 149
15 BM(15) An Analysis Of The Muslim Consumers’ Attitudes Towards ‘Halal’ Food
Products In Kelantan 165
16 BM(16) Perception Of Knowledge Management Among Selected Federal Government
Departments In Kelantan 179
17 BM(17) Challenges Faced By Bumiputera Entrepreneurs: A Study In Shopping
Complexes And Big Supermarkets In Malacca. 193
18 BM(18) Exploring Driving Forces For The Growth Of Industrial Clusters: Empirical
Evidence From Hsinchu Science Park 211
19 BM(19) An Analysis Of Auditors Litigation 229
20 BM(20) Small Enterprises Environmental Management Practices In Terengganu – A Mail
Survey 233
21 BM(21) Modeling The Price Of Standard Malaysia Rubber In The Commodity Market 247 22 BM(22) Lecturers’ Perceptions Towards Program Coordinators’ Leadership Style 255 23 CQ(01) An Assessment Of The Learner Autonomy Of Distance Learners In Malaysia 271
24 CQ(02)
Enhancing Quality Fdi For Emerging Economies: An Approach To Boost Effective Measures From Multi National Companies To Stimulate Spillover Impact
283
25 CQ(03) The Effect Of Sowing Date And Row Spacing On Yield And Yield Components
viii
26 CQ(04) Examining Elements That Motivate Smes To Collaborate With Universities ToGain Competitive Advantage 305
27 CQ(05) Moral Philosophies Underlying Future Marketers’ Ethical Judgment 317 28 CQ(06) Does Knowledge Sharing Help Improves Public Sector Service Delivery? A
Case Study Of Three Selected Government Agencies 335
29 CQ(07)
Understanding The Role Of The Institutions Towards Creating A Success Of Trade Integration Among Islamic Member States (D-8): Their Potential Towards Malaysia’s Entrepreneur Sector
347
30 CQ(08) Life Cycle Assessment Of Biological Mechanical Treatment In Solid Waste
Management: Case Study In Kahrizak, Iran 365
31 CQ(09) Kerangka Teoritikal Strategi Pembelajaran Koperatif Dalam Sastera Arab.
Kesannya Terhadap Sikap, Motivasi Dan Pencapaian Pelajar. 373 32 ED(01) Knowledge, Attitudes And Behaviour Of First Year Tertiary Students 391
33 ED(02)
The Roles Of The Metafunction Of Language And The Function Of
Metalanguage In Teaching And Learning Mandarin And English As A Second Language
401
34 ED(03) The Effect Of Problem-Based Learning On Students’ Team Work Ability: A
Study On Graduating Accounting Students In UiTM Terengganu 411 35 ET(01) Status And Problems Of The Environmental Impact Assessment In Malaysia 421 36 ET(02) The Enhancement Of Spaces In Between Buildings For Urban Recreation
Development 429
37 ET(03) Utilization Of Rail-Based Ampang Line Lrt 441
38 HC(01) Women As Caregivers Of The Elderly In Malaysia 459
39 HC(02)
The Relationship Between Antecedents Of Psychological Empowerment And Innovative Behaviour: Testing The Mediating Role Of Psychological
Empowerment
471
40 HC(03) The Relationship Between Gender And Leadership Styles Of UiTM Lecturers 487 41 MA(01) Effect Of Hydrogen Embrittlement On Al-Mg-Si Alloy In 3.56 Wt% Nacl
Solution 501
42 MA(02) Effect Of Acid Treatment On Formation Of Sic (Silicon Carbide) From Rice
Straw 511
43 MA(03) The Willingness Of Students Of Institutes Of Higher Learning In Kelantan To
Choose Agriculture As A Career In The Era Of ECER. 517 44 MA(04) Vermiculture : A Tool For Poverty Removal And Source Of Biomass For
Livestock Feed, Cosmetic And Biotech Industries 537
45 SE(01) Selection Factors Of Islamic Banking Between Bank Islam Malaysia Berhad And
Conventional Banks In Kota Bharu: What Do Their Customers Say? 559 46 SE(02) Supply Chain Model For Rice In Malaysia – Basics And Challenges 585 47 SE(03) Regional Economic Development: Rethinking The Region 599
48 SE(04) SMEs And Halal Certification 609
49 SE(05) Islamic Microfinance: An Ethical Alternative To Poverty Alleviation 619 50 ST(01) Predictive Factor And Risk Of Low Birth Weight Infant 633 51 ST(02) Science And Mathematics As Proofs To The Power Of Allah’s Swt Creations 651 52 ST(03) A Study On Risk Factors Associated With Hemorrhoids (Piles) Cases In Kelantan 657 53 ST(04) Visualizing Complex Mathematical Functions And Surfaces 667 54 TR(01) Semiotic Knowledge Towards Heritage Product In Tourism Industry: A Case Of
ix 55 TR(02) A Competitive Study Of Malaysian Tourism Destinations 687 56 TR(03) Assessing Tourist Expectation Level Towards Tourism Delivery System In East
Coast Malaysia 699
57 TR(04) Isu Kependudukan Dalam Perancangan Bandar: Satu Tinjauan Pelan
Pembangunan Kota Bharu Bandar Raya Islam 715
PREFACE
On behalf of the conference committee, it is our pleasure to present to you the proceedings of the 1st ECER Regional Conference (ERC) 2008. The conference theme is Thrusting Islam, Knowledge and Professionalism in ECER development. This conference addresses research, new developments, and experiences related to the development of East Coast Economic Region (ECER). The conference is also the platform for researchers, educators and practitioners from various international institutions to disseminate new ideas relevant to ECER development.
The 58 contributions of ECER Regional Conference presented in this volume consist of the full papers accepted for the 3-day presentations at the conference after carefully being reviewed by the conference committee reviewers. The presentations were held on December 15 – 17, 2008 at Renaissance Hotel, Kota Bharu, Kelantan.
The major areas covered and presented in this volume are very wide and related with the economic clusters of ECER development which include manufacturing, environment, transportation, tourism, agriculture, human capital, education, socio-economic, infrastructure, business and financial. The main media for the proceedings of this conference is the CD-ROM which was distributed to all participants
and ONLINE proceeding which can
and the ECER Regional Conference 2008 website
In closing, we would like to thank all authors for submitting their work and all members of the ECER Committee, for their cooperation and time spent in the preparation of this proceeding. We look forward to the continuation of ECER Regional Conference next year.
Thank you.
PROCEEDINGS COMMITTEE
COORDINATOR
Dr Nik Maheran Nik Muhamad
CHIEF EDITOR
Assoc Prof Dr Yeop Hussin Bidin
CO-EDITOR
Wan Hasni Wan Hasan
REVIEWERS
Professor Emeritus Gary J. Confessore George Washington University (DC), USA Professor Dr. Ibrahim Che Omar Universiti Malaysia Kelantan
Professor Dr Kamaruzaman Jusoff, Yale University, USA Professor Dr Ku Halim Ku Hamid, Universiti Teknologi MARA Malaysia
Professor Dr. Muhamad Jantan, Universiti Sains Malaysia Professor Dr. Muhammad Syukri Salleh, Universiti Sains Malaysia
Assoc. Prof. Dr. Fauziah Md Taib, Universiti Sains Malaysia Assoc. Prof. Dr. Rosmimah, Universiti Teknologi MARA Malaysia
Assoc. Prof. T. Ramayah, Universiti Sains Malaysia Assoc Prof Dr Asry Yusoff, Universiti Teknologi MARA Kelantan Assoc Prof Dr Azman Omar, Universiti Teknologi MARA Kelantan Assoc Prof Dr Mohd Shukri Omar, Universiti Teknologi MARA Kelantan
Assoc Prof Dr Nik Muhammad Naziman Abd Rahman, Universiti Teknologi MARA Kelantan Assoc Prof Dr Nik Kamaruzaman Abdulatiff, Universiti Teknologi MARA Kelantan
Assoc Prof Dr Siti Aishah Sheikh Abdullah, Universiti Teknologi MARA Kelantan Assoc Prof Mohd Safri Ya, Universiti Teknologi MARA Kelantan
Assoc Prof Sapiai Abd Rahman, Universiti Teknologi MARA Kelantan Assoc Prof Napisah Shafii, Universiti Teknologi MARA Kelantan Assoc Prof Che Khalil Hassan, Universiti Teknologi MARA Kelantan Assoc Prof Mohd Nasir Muda, Universiti Teknologi MARA Kelantan
Goh Ying Soon, Universiti Teknologi MARA Terengganu Siti Haliza Asat, Universiti Teknologi MARA Kelantan
EDITORS
Anidzan Ariffin Maidin Idrus Marhaini Hassan Mohd Idzwan Mohd Salleh Nazatul Shahreen Zainal Abidin
BM(01)
INVESTMENT DECISION BEHAVIOR:
ARE INVESTORS RATIONAL OR IRRATIONAL?
Nik Maheran Nik Muhammad1, Nurazleena Ismail2
1, 2
Faculty of Business Management, Universiti Teknologi MARA Kelantan, Malaysia
ABSTRACT
Malaysian capital market offers an array of investment products in a form of shares, loan stocks, bonds, warrants, and unit trusts. The type of products chosen by an investor to commit his capital depends largely on his financial goals, time frame, and amount of capital available. Different people invest with different strategies or even no-strategies. However, previous studies found that most individual investors who play the stock market often ask for ‘hot tips’ that will enrich them overnight. Too often investors buy stocks on a whim or on the recommendation of a stranger when they should buy stocks that are showing fundamental strength and consistence with their investment objectives. Therefore, the main objective of this research is to study factors that influence investors’ investment decision making. Do they rational or irrational in their decision making behavior. The population for the study consists of individual investor who trade share at Bursa Malaysia. 147 questionnaires were distributed and usable. The results from correlation analysis indicate positive and significant correlations among the independent and the dependent variables. However, multiple regression analysis shows significant relationships only exist for economy and frame of references indicating that Malaysian investors rely both on fundamental analysis as well as following others opinion (herding). In other words, they are partially rational in their decision making.
Keywords: investment decision-making, risk tolerant, herding behavior
INTRODUCTION
Most ordinary people who play the stock market often ask for ‘hot tips’ that will enrich them overnight. Too often investors buy a stock on a whim or on the recommendation of a stranger when they should buy stocks that are consistence with the investment objectives. According to Frieder (2004) survey, respondents said“…for me, investing is playing with stock markets…it gives me a kick.” Apart from its value as a piece of anecdotic evidence on investor behavior, it also serves to illustrate that for many investors, investing constitutes more than simply weighting the risk and returns of various investment assets. Being aware of the many considerations and needs beyond risk and return that influence investors’ behavior, it is surprising that finance journals are mostly confined to the utilitarian benefits of low risk and high expected returns.
ECER Regional Conference 2008, UiTM Kelantan
2
changes in attitudes take one time to emerge (Gurtler and Hartman, 2007). The investment environment in Malaysia has changed considerably overtime and opportunities for individual investors to become involved in have increased considerably, particularly as a result of encouragement from institutional changes.The overall purpose of this research is to gain knowledge about key factors that influence investment decision style focusing on whether the investors are rational of irrational in making their decisions. In this paper, we have focused on the behavior of individual investors when buying various type of investment. In particular, we have conducted a behavioral finance analysis.
HYPOTHESES DEVELOPMENT
Theory of Behaviorism
The theoretical model employed in this research is based on the theory of behaviorism. It is an extension of Prospect theory or also known as Risk aversion theory introduced by Khneman and Tvensky (1979). This theory asserts that, when it comes to investing, people may not be as rational as they think. Behaviorists argue that investors often behave irrationally when making investment decisions thereby incorrectly pricing securities. They relate investor’s decision making behavior to and Therefore it is hypothesize that:
• H1: Investment Decision making style of an investor is positively related to their emotion or intuition.
• H2: Investment Decision making style of an investor is positively related to their frame of references of and investors (herding behavior)
However, many economists argue that investors behave rationally when buying stocks. They are presumed to use all available information to form rational expectation about the future in determining the value of companies and the general health of the economy. Consequently, stock prices should accurately reflect fundamental values and will only move up and down when the unexpected positive or negative news, respectively. Thus, economists have concluded financial markets are stable and efficient, stock prices follow a “random walk” and the overall economy tends toward “general equilibrium”. Therefore, it is hypothesized that:
• H3: Investment Decision making style of an investor is positively related to their ability to analyze environmental factors
• H4: : Investment Decision making style of an investor is positively related to their ability to analyze economic factors
Nik Maheran, Nurazleena, Investment Decision Behavior
3 RESEARCH MODEL
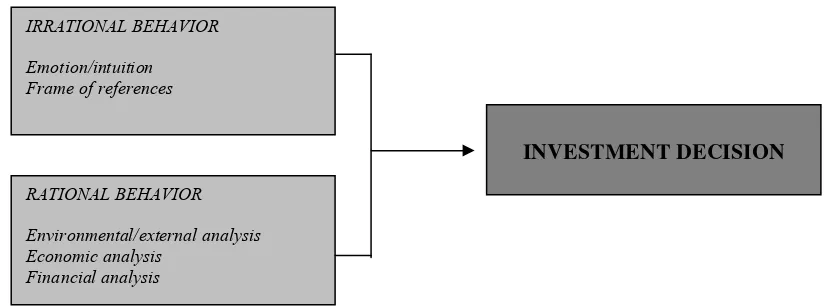
Based on the literature reviewed conducted for this research, it was found that study on investors behavior was exhaustively done (e.g Al-Hogail (2004), Olsen (1998), Pinello (2004), Barberis and Thaler (2002)). Contradict opinion was found in terms of rational level of the investors. Many researchers categorized investors who make their decision based on information of the environment and fundamentals of the company as rational investor. Irrational investors are those who involve in herding behavior, speculation and rely their investment decision on frame of references. Below is the theoretical framework of this research:
Figure 1: Theoretical framework of Investors Behavioral Decision
METHODOLOGY
Sample and procedure
Data for this study was collected through structured questionnaires. The questionnaires were distributed to the investors traded their share in stock broking companies around Klang Valey. A total of 147 responses were obtained from 200 questionnaires sent.
Variables and measurement
The instruments were adapted from various literatures and were modified for the adaptation to the investor’s behavior context. The dependent variable, Investors decision making was measured using five items. Responses were measured using five-point Likert type scale anchored by “strongly disagree” (1) to “strongly agree” (5). Meanwhile for the independent variable items with five-point Likert type scale was used to measure, with scale ranging from “very unlikely” (1) to “very likely” (5).
ANALYSIS AND RESULT
The respondents comprised mainly of male, which is 71.4% and females 42%. In terms of age, the majority of the respondents are between the age of 30 to 39 years (49%) with , 21.1% having SPM, 15.6% Diploma/STPM level, 53.7% having Bachelor Degree, and 6.1% had their Master degree. 2.0% PhD and the rest (1.4%) of the respondents had other types of academic qualification. In term of the occupation, 16.3% of the respondents are working in government sector, 29.3% in private sector and
RATIONAL BEHAVIOR Environmental/external analysis Economic analysis
Financial analysis
INVESTMENT DECISION IRRATIONAL BEHAVIOR
ECER Regional Conference 2008, UiTM Kelantan
4
mostly respondents are self-employment (54.4%). In terms of income, most were earning RM 4,000 to 6,000 per month with 39 percent.Descriptive analysis for investment profile shows that investors choose investment vehicles in the category of low risk tolerant with a mean of 4.47 for unit trust/investment link followed by property investment (4.34), bond (3.95) and stock market (3.55). This indicates that the investors understudied are having risk averse attitude.
Table 1: Investment profile
bond stock property
Unit trust/inv.
link
Money market
Mean 3.95 3.55 4.34 4.47 3.97
Std. Deviation .594 1.118 .872 .805 1.020
Based on the descriptive analysis of investment decision making behavior, it shows that economic factors is the most influential factors in determining their investment buying behavior followed by financial and frame of references. However, in terms of relying on emotions (i.e gut-feeling, over-reaction) most respondents were rating that they are unlikely of doing so.
Table2: Decision profile
Decision N=147
Variables Mean Std. Deviation
Rational Behavior
Environment 3.00 .847
Financial 3.69 .942
Economy 3.80 .628
Irrational Behavior
Emotion 2.95 1.057
Frame of references 3.1850 .76143
Goodness of measure
Nik Maheran, Nurazleena, Investment Decision Behavior
5 Rational Behavior
Table 3 presents the results of varimax factor rotation of all variables for investors’ rational behavior measuring via fundamental analysis done. From the 18 items, 10 items loaded on three factors. Five items, which form external/environmental analysis, was loaded in factor 1 with a variance of 39.5 percent, two items from financial analysis loaded on factor 2 with 31.28 percent and three items from economic analysis loaded on factor 3 with a variance of 19.2 percent. The total variance achieved is 80.14 percent. Furthermore, all the Cronbach’s alpha values were between 0.72 to 0.99
Table 3: Factor analysis and reliability test result
Factor Loading
F1 F2 F 3 F 4 F 5
Q1 Nikkei .942
Q2 Hang Seng .938
Q3 Dow Jones .931
Q4 M'sia For invt policy .828
Q5 M'sia political situation .793
Q6 Investment objective .961
Q7 Company fin. Perform. .956
Q8 Current market price .830
Q9 Historical market price .763
Q10 World economy .744
Q11 Speculation .949
Q12 Herding .934
Q13 Confidence .666
Q14 Television .910
Q15 Fund advertisement .898
Q16 Magazines .719
Q17 Friends influence .629
Q18 Top ten stock .584
Reliability Cronbach Alpha .933 .994 .719 .954 .806
Eigenvalues 3.956 2.138 1.920 2.216 2.888
Percentage of Common
variance 39.556 21.381 19.203 73.874 57.75
Cumulative % 39.556 60.398 80.141 73.874 57.75
Irrational Behavior
In conceptualizing the irrational behavior, table 3 shows that three items form emotion or intuition behavior loaded in factor 4 with a variance of 73.87 percent, five items determine frame of references loaded on factor 5 with 57.75 percent. Cronbach’s alfa values for emotions or intuition behavior and frame of references were 0.95 and 0.81 respectively.
Investment Decision
ECER Regional Conference 2008, UiTM Kelantan
6
shows that statistically, the items understudied is valid and measure what it’s suppose to measure and having high consistencies with each other with acceptable Cronbach Alpha of more than 0.8.Table 4: Factor analysis and reliability test result on Investor’s decision
Investor’s decision style Factor 1 Q1: investment expected return .921 Q2: Investment holding period .910
Q3: Investment objectives .866
Q4: Investor’s risk tolerance .849 Q5: Investors reaction towards loses .833
Cronbach Alpha for nature of decision .924
Eigenvalues 3.841
%age of Common variance 76.815
Cumulative % 76.815
Test of Relationship
Correlation analysis indicates the strength of bivariate relationships among the independent and dependent variable under studied. This therefore indicates an early indication of possible interrelationships in multiple regressions. The correlations between the independent variables also can be used to identify reasons for insignificance of one independent over another when explaining the variations in the dependent variables for multiple regressions analysis.
Table 5 Correlation analysis
The results of correlation analysis are tabulated in Table 4 above. The table indicates high
To evaluate the behaviors that influence investor’s decision-making style, Stepwise Regression Analysis was applied. Regression analysis was used to test the hypotheses. The result of the Stepwise Multiple Regression Model is reported in Table 6 below.
Mean
Std. Deviation
Decision making
Environ
ment Financial Economy Emotion
Frame of referenc es Decision
making 3.05 .868 1.000
Environment 3.00 .847 .061 1.000
Financial 3.69 .942 .469** .072 1.000
Economy 3.80 .628 .743** -.021 .390** 1.000
Emotion 2.95 1.057 .017 -.080 .291** .143 1.000
Frame of references
3.1850 .76143 .669** .054 .603** .567** -.030 1.000
Nik Maheran, Nurazleena, Investment Decision Behavior
7 Table 6: Model summary and standardize Beta Coefficient of multiple regression analysis
F value R square Adjusted R square
R square change
F change Beta
Model Summary 52.866*** .652 .640 .652 52.866***
Environment .043
Financial .095
Economy .550***
Emotion -.077
Frame of
references .295***
***significant at the 0.01 level, ** significant at the 0.05 level, * significant at the 0.1 level
The result of multiple regression analysis shows that the relationships exist between the independent variables (rational/irrational) with dependent variables (investment decision making). The model was significant ( p>0.01) with F-value of 52.87. The coefficient of determination (R2) is 0.652, which indicate that 65.2 percent of the variations in investment decision-making were explained by the independent variables (environment, financial and economic analyses as well as emotion and frame or references). The multiple regression analysis in this stage also indicates that the tested variables are significant at p, 0.01. The b-values (standardized coefficients) for each of the variables are as follows: Environment (b=.043), Financial (b=0.95) economy (b=.550) Emotion (b=-.077) and Frame of References (b=.295) indicating that only economy and frame of references are positively related to investment decision making. Therefore, it is concluded that only H3 (rational behavior in terms of analyzing the economy is positively related to investment decision making style) and H5 (frame of references is positively related to investment decision making style) were supported.
DISCUSSION
As mentioned, this study intends to investigate the relationship between investment decision-making of an investors and their rationality in investing. Rational or irrational behavior was conceptualized based on whether they analyze their investment before deciding to invest or relying on their emotions and frame of references respectively. The direct positive relationship of economic analysis and frame of references was found significant to investment decision making of Malaysian decision maker. This indicates that the investors neither were relying on their emotions or intuition in making their investment nor exhaustively analyzes their investment before making their decision. Therefore, previous study conducted by researchers like; Elsayed & Martin (1980), Katz (1998), Young and O’Neill, (1992) was not in line with the current study as in their study, they found that investors are irrational in their decision making.
ECER Regional Conference 2008, UiTM Kelantan
8
influence of friends, relative and remisiers in their decision making. Therefore, we could conclude that Malaysian investors of partially rational in their decision making. This argument is consistent with the study done by Marota (2008). According to him, investors do not make decisions in a vacuum. They may make better decisions by trying to understand the behavioral factors that can influence their judgment for example herd mentality (i.e. following the behavior of others). Herd Mentality on investment decisions has the potential to provide investors with many psychological benefits. Herding reduces the time needed to properly analyze an investment decision. It can also help reduce feelings of regret if the investment choice was a bad one. Investors can find comfort knowing that they were not alone in their decision. Herding can also be a powerful tool in influencing market movements. It is supported by the argument of Hoffmann and Wander (2003) who identified that, the needs, social interactions and (social) networks effect are keys to understanding micro level investor behavior and macro level stock market dynamicsIn addition, the findings of the current study also found that Malaysian investors only relying and analyzing economic condition in making their investment decision. Company’s performance, government policy or political conditions locally and internationally was not of their interest. This finding is consistent with the assumption of Friedman (1988), that most of the investors consider economic condition and price movement as the most significant contribution to their gain and losses in investing. Others, such as company’s performance, political condition and government policy is considering giving major effect only on the long run.
This empirical study has several limitations. Firstly, the scope of investigation was done only at Klang Valey. Therefore, in terms of external validity in generalizing the behavior for all Malaysian is still questionable. Secondly, the findings of this study depend largely on the respondent’s honesty and integrity. However, if the respondent’s answers were bias towards more socially desirable answers, the findings will also indicate biasness. It is known that individuals would agree more on socially desirable answers and disagree more towards socially undesirable answers rather than fully and truly express their feelings and the opinions.
CONCLUSION
Nik Maheran, Nurazleena, Investment Decision Behavior
9 REFERENCES
Banerjee, V.A.(1992). "A Simple Model of Herd Behavior," The Quarterly Journal of Economics, Vol. 107, No. 3, pp. 797-817
Barberis N. and ThalerR. H. (2002). A Survey of Behavioral Finance, Cambridge: National Bureau of Economic Research, NBER working paper series no. 9222.
information, Case Western Reserve University, 2004, 206 pages; AAT 3118119
Elsayed, H., & Martin, J. (1998). Survey of financial risk tolerance: Australian technical report. Sydney: Chandler & Macleod.
University of California, Los Angeles, 155 pages; AAT 3133033
Friedman, M. (1988), Money and the Stock Market, Journal of Political Economy Vol. 96, No. 2, 221-245
Gurtler, M and Hartman, N (2007); The Equity Premium Puzzle and Emotional Asset Pricing; International Journal of theoretical and applied finance, 10(6), 939-965
Hair, J.F., Anderson, R.E., Tatham, R.L. and Black, B.C. (2006), Multivariate Data Analysis, Analysis Pearson Education Inc., Upper Saddle River, NJ.
Hoffmann, A and Wander J., (2003) “The Effect of Different Needs, Decision Making Process and Networkstructures on Investor Behavior and Stock, Vol 2(2), 222-230.
Kahneman, D. and A. Tversky, (1979), Prospect Theory: An Analysis of Decision under Risk, Econometrica, v47, 263-292.
Katz, D. (1998). You didn’t underperform, you overexpected. National Underwriter , 102, 12.
Marota, D. J (2008); Behavioral Finance: Herd Mentality. The Central New York Business Journal; 23 Nunnally, J.C. and Bernstein, I.H. (1994), Psychometric Theory, McGraw-Hill, New York, NY. Olsen, R.A. (1998). Behavioral finance and its implications for stock-price volatility. Financial
Analysts Journal, 54, 10-18.
The Florida State University, 115 pages; AAT 3156246
Snell, S. A and Dean, J. W (1992).” Integrated manufacturing and human resource management: a human capital perspective”, Academy of Management Journal, Vol 35(3), 467-504
BM(02)
THE IMPORTANCE OF CORPORATE IMAGE
TO A UNIVERSITY
Assoc Prof Dr Zainudin Awang1, Prof Dr Mahadzirah Mohamad2, Prof Dr W Solihin W Abdullah3
1
Universiti Teknologi MARA Kelantan, Malaysia 2
Universiti Malaysia Terengganu, Malaysia 3
Universiti Malaysia Kelantan, Malaysia
ABSTRACT
Today, higher education has become a commodity in the service industry and the choice is plenty. The rate of increase in the number of higher learning institutions offering the service has surpassed the rate of increase in demand for higher education itself. Hence, the competition for potential students, especially postgraduate students among universities is very stiff. When the characteristics of service offering have become uniformed, universities should be looking for its own competitive edge to differentiate themselves from their competitors. This study attempts to investigate the influence of corporate image of a university on the willingness of their outgoing undergraduates to continue their postgraduate study at the same university and to recommend their friends, families, and employers to engage with the university. The data collected randomly from 872 the outgoing undergraduates using self-administered questionnaires. The factor analysis procedure for corporate image items produced three distinct dimensions. The study renamed these dimensions as the image of a university, image of academic programs, and the external recognitions received by the university. As for the students’ loyalty, the factor analysis procedure produced two distinct dimensions. The study renamed them as market retention and positive recommendation. The study found corporate image of a university has a significant and direct effect on students’ intention to engage their postgraduate study at the university. Among the significant corporate image dimensions are image of the university and image of academic programs conducted by the university. As for the loyalty dimensions, the corporate image of a university has a significant influence on the outgoing students to provide positive words of mouth and recommendations to other potential students to register with the university. At the same time these outgoing students are willing to continue their graduate study at the university. Even if they decide to take the job, they would still recommend their employers to engage with the university for industrial training and other activities such as research and consultancy. The result has significant implication to the university in its effort to ensure long-term growth and survival of postgraduate programs into the future.
Key words: corporate image, students’ loyalty, postgraduate programs
THE INTRODUCTION AND BACKGROUND OF PROBLEM
ECER Regional Conference 2008, UiTM Kelantan
12
competition for potential students. The competition for students is evidenced when hundreds of institutions are advertising their study programs through electronic and print media, just like other commercial products or services. Not enough with that, these institutions are promoting their service by participating in hundreds of education road shows, expos, seminars and the like through out the country. In promoting their service, university and colleges are claiming that they have the best program to offer, the best facilities available, the best academic staff to serve, etc. The potential students have a chance to shop around for the best offer. The painful evidence of fierce competition exposed when the newspaper reported that 123 colleges forced to terminate their operation and another 30 colleges would eventually be closed due to inadequate number of students (Utusan Malaysia, 29 Mei 2005). Since the choice is plenty, the corporate image of a university emerged when potential students are choosing which university to apply for admission. Like other service industry, the target of students’ loyalty should be the prime importance for the university. This is because students’ loyalty would bring tremendous benefits to the service provider, the university. The positive loyalty of existing students would generate new students through positive words and recommendations to their families, friends and anybody who are in close contact.THE REVIEW OF LITERATURE
Corporate Image
According to Griffin (2002), large corporations have already been using image marketing to sell their products for decades. Dowling (1993) defines the concept of image as “the total impression an entity makes on the mind of people”. Corporate image in the service marketing literature early identified as an important factor in the overall evaluation of the service and the service provider (Gronroos, 1984). Furthermore, Gronroos (2001) states:
A favorable and well-known corporate image would be an asset of a firm in service industry. This is because image has an impact on customer perceptions of the communication and the operation of the firms in many aspects.
If a service provider has a positive image in the minds of customers, minor mistakes will be forgiven and will not affect their perceived quality towards the firm. As time progresses, more and more business organizations offering similar products and services emerge, thus create competition for customers among themselves.
Zainudin, Mahadzirah, Solihin, The Importance of Corporate Image
13 established and developed in students’ mind from their knowledge obtained through communication and exposure from media publication regarding the achievement and reputation of the respective university. Among the achievement and reputation of a university exposed in the media are the contribution of the university to the government and society through certain research projects, the achievements of academic faculties from the university such as winning awards for research and invention at the national and international competitions, and the external recognitions received by the university such as from International Organization of Standardization or ISO, from professional bodies such as association of accountants, surveyors, engineers, doctors, and from government departments. Fielder et al. (1993) and James et al. (1999) found corporate image of the university has a strong impact on the students’ decisions, affecting both the keeping of the present students and the attraction of potential students.
Customer Loyalty
Loyalty is a complex construct that involves both behavioral and attitudinal aspects. For the purpose of this study, the researcher assumes that a “loyal student” is a student who would continue the study at the same university whenever possible, and who continues to recommend or maintains positive attitudes towards the university. Dick and Basu (1994) propose two conditions in relation to loyalty, which represent the intersection of relative attitude and repeat patronage. First, customers who exhibit loyalty behavior engage in repeat purchases, where this is appropriate. Second, customers who are loyal in attitude are likely to make recommendations to someone else, and, sometimes their loyal attitude will lead to loyal behavior in the form of repeat purchases. There are various theories in service literature relating to the concept used to measure customers’ loyalty in higher education institution. For example, the Relationship Marketing Theory (Reicheld and Sasser, 1990; Reicheld, 1996) revealed that a long term relationship with students may provide some sort of strategic competitive advantage in which gaining new students is generally more cost-intensive than maintaining existing relationships; and the cost-relationship effects are generated over the relationship life-cycle. Another example, the Service Marketing Theory on Customer Participation (Rust et al., 1996; Rodie and Kleine, 2000) stressed that loyal students (as the external factor in the service production process) may positively contribute to the quality of teaching and learning process at the university through their active participation and committed behavior.
Highly committed and motivated students, together with lecturer’s involvement would stimulate productive learning atmosphere in the classroom; hence would produce good academic performance which benefits both the students and also the university.
ECER Regional Conference 2008, UiTM Kelantan
14
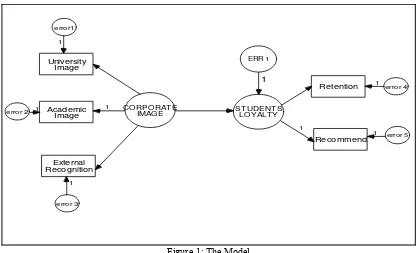
their intention to remain loyal with the university to complete the existing undergraduate programs and increase transaction with the same university in the future by continuing into graduate programs with the same university.The Schematic Model of the Study: Refer to Figure 1
The Variables in the Model:
Dependent variable
The dependent variable is students’ loyalty towards the university, which is the variable of primary interest in the study. From the theoretical perspectives, the loyalty components consist of behavioral loyalty and attitudinal loyalty. The researcher confirms the two components through exploratory factor analysis (EPA) and confirmatory factor analysis (CFA) conducted using 300 data from pilot study. The researcher renamed the components as recommendation and retention.
Positive Recommendation consists of behavioral items such as willingness to spread positive words of mouth regarding the university to families, friends, and employers; and recommend them to engage with the university for industrial linkages, training enrolments, employee recruitments and sponsoring activities in the future.
Market Retention consists of attitudinal items such as to remain with the university either to complete the present study program or to continue the study into graduate program in the future.
CORPORATE
IMAGE STUDENT SLOYALTY
error 4
error 5 ERR 1
1
Retention
Academic Image
External Recognition
University Image
Recommend
1
1 1
error 3 error1
error 2 1
1 1
1
Figure 1: The Model
Independent variables
Zainudin, Mahadzirah, Solihin, The Importance of Corporate Image
15 The EFA produces three components of manifesting variables. The researcher renamed the components as university image, academic image, and external recognitions received by the university.
University image consists of the image of a university, image of faculties and departments within the university.
Academic image consists of awards from academic achievements received for researches, inventions and publications by the academic staff at the university.
External recognition consists of recognition received from government departments or professional organizations such as ISO.
Since the researcher will be using the structural equation modeling (SEM) for the analysis, the service quality and corporate image will be treated as two latent exogenous variables.
THE RESEARCH METHODOLOGY
The Population and Sample
Population for the study consists of undergraduate students from the Faculty of Business and Management at Universiti Teknologi MARA. A total of 1000 undergraduate students selected randomly from four different regions namely eastern (Kelantan, Terengganu, Pahang), northern (Perlis, Kedah, Pulau Pinang), Southern (Johor, Melaka, Negeri Sembilan) and UiTM Headquarter in Shah Alam. The respondents were given self-instructed questionnaires with the return envelope. They can complete the questionnaires at their own convenient time and mail to the researcher. A total of 872 completed questionnaires received, which represent a satisfactory response of 87.2 percent.
The Instrumentations
The instrument for corporate image is adapted from Andreassen (1994), Caruana (2002), Kang and James (2004), and Zainudin and Zaihan (2004). While the instrument for customer loyalty is adapted from Zeithaml et al. (1996), Caruana (2002), Ndubisi (2003), Kang and James (2004), and Zainudin et al. (2005b). The researcher modifies the wordings of certain items whenever necessary in order to suit higher education scenario. The instrument for corporate image and students’ loyalty consist of 16 items and 9 items respectively.
The Principal Component Factor Analysis (PCA) with Varimax Rotation was performed for these two instruments.
Factor Analysis on Corporate Image Items
ECER Regional Conference 2008, UiTM Kelantan
16
KMO and Bartlett's Test for corporate image instrumentsKaiser-Meyer-Olkin Measure of Sampling Adequacy. 0.932
Approx. Chi-Square 8498.069
Df 120
Bartlett's Test of Sphericity
Significance 0.000
This KMO value of 0.932 is excellent since it exceeds the recommended value of 0.6 (Kaiser, 1974). The two results (KMO and Bartlett’s) suggest that the sampled data is appropriate to proceed with a factor analysis procedure.
The Principal Component Factor Analysis extracted three distinct components with eigen values exceeding 1.0. The total variance explained for the three components is 64.304%. Meanwhile the reliability analysis for each corporate image component is given in the table.
Reliability measures for corporate image instruments in the study
Component Number of items
in a component Cronbach’s Alpha
Cronbach’s Alpha based on standardized items
Academic Image 7 0.909 0.909
University Image 5 0.855 0.857
External Recognitions 3 0.685 0.688
Factor Analysis on Students’ Loyalty Items
The Principal Component Factor Analysis (PCA) with Varimax Rotation was performed for the 9 items of the service quality measures. The result is presented in the following table.
KMO and Bartlett's Test for loyalty instruments
Kaiser-Meyer-Olkin Measure of Sampling Adequacy. 0.871
Approx. Chi-Square 6328.338
df 36
Bartlett's Test of Sphericity
Significance. 0.000
This KMO value of 0.871 is excellent since it exceeds the recommended value of 0.6 (Kaiser, 1974). The two results (KMO and Bartlett’s) suggest that the sampled data is appropriate to proceed with a Factor Analysis procedure.
Zainudin, Mahadzirah, Solihin, The Importance of Corporate Image
17 Reliability measures for loyalty instruments in the study
Component Number of items in a component
Cronbach’s Alpha
Cronbach’s Alpha based on standardized items
Market Retention 4 0.874 0.874
Recommendation 5 0.918 0.919
The Procedure for Data Analysis
The researcher analyzed data through Structural Equation Modeling using AMOS 5.0 software. AMOS is a short name for Analysis of Moment Structures.
The Assessment of Fitness for the Model
The researcher would look at a few universally recognized indexes as a measure to assess the fitness of the proposed model for the study.
Model Fit Summary produced by AMOS 5.0
Model GFI AGFI PGFI
Default model 0.987 0.951 0.263
Saturated model 1.000
Independence model 0.571 0.356 0.381
Referring to table, the Goodness of Fit Index (GFI) is 0.96. This figure exceeds 0.90 as required by Joreskog and Sorbom (1984). According to Joreskog and Sorbom (1984) the GFI value of 0.90 or higher indicates the model is a perfect fit to the data. Another index, the Adjusted Goodness of Fit Index (AGFI) is 0.923. The figure also exceeds the requirement by Tanaka & Huba (1985). Tanaka & Huba (1985) state that the AGFI value above 0.90 indicates the model is a perfect fit to the data. And finally, the researcher looked at the Parsimony Goodness of Fit Index (PGFI). The PGFI for the model is 0.506. Mulaik et al. (1989) state that the PGFI value exceeds 0.5 would indicate the model employed is a perfect fit to the data in the study.
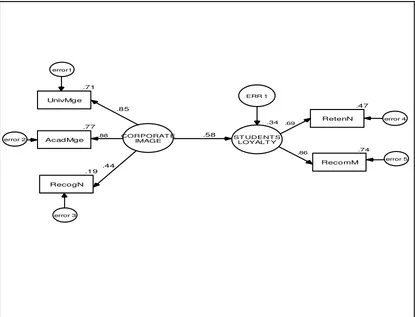
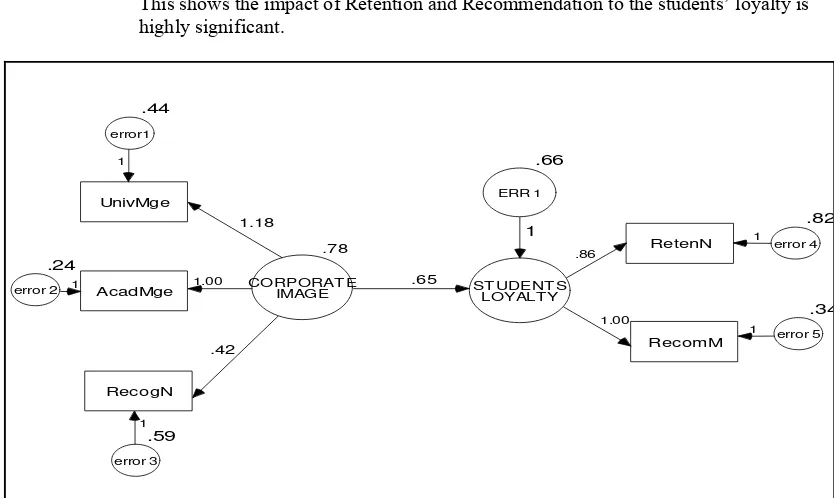
The parameter values computed by AMOS 5.0 for the model are presented in figure 1 and figure 2. Figure 1 shows the strength and magnitude of relationship between variables in the study. In other words, figure 1 indicates how strong is the relationship between one variable to another variable when they are estimated simultaneously in one model. Figure 2 shows the coefficient of multiple regressions between variables in the study.
Result and Discussion
Figure 1 shows the strength of relationship between each dimension and their main variable as well as the relationship between main variables in the study. The main interest of the study is the strength of relationship between corporate image and students’ loyalty. The result shows the measure of relationship between corporate image and students’ loyalty is 0.58.
ECER Regional Conference 2008, UiTM Kelantan
18
are 0.85, 0.88, and 0.44 respectively. In other words the ‘image of academic activities’ conducted by the university contribute the most to the corporate image of a university.CORPORAT E
Figure 2: The Strength and Magnitude of Relationship between Variables
The output in figure 1 also shows the relationship between ‘retention’ and ‘recommendation’ to the students’ loyalty towards the university is 0.69 and 0.86 respectively. In other words, the tendency of loyal students is higher in recommending the university to their friends, families and employer compared to tendency of they themselves continue their postgraduate study at the university. The reasons might be these outgoing undergraduates prefer to find the job and settle for good, or they might want to proceed doing postgraduate study in the future, or the might want to venture to a new university for their postgraduate studies.
Table 1: Path Analysis for Output in Figure 2
PATH ANALYSIS Estimate S.E. P
STUDENTS_LOYALTY ← CORPORATE_IMAGE .652 .046 ***
RETENN ← STUDENTS_LOYALTY .857 .066 ***
RECOMM ← STUDENTS_LOYALTY 1.000
ACADMGE ← CORPORATE_IMAGE 1.000
UNIVMGE ← CORPORATE_IMAGE 1.182 .055 ***
RECOGN ← CORPORATE_IMAGE .422 .034 ***
Zainudin, Mahadzirah, Solihin, The Importance of Corporate Image
19 Path analysis 1: Corporate Image » Students’ Loyalty
The β estimate is 0.652 with standard error 0.046. The significance value (p) is less than 0.001.
This shows that the impact of Corporate Image on Students’ Loyalty is highly significant.
Path analysis 2: Corporate Image » Academic Image Corporate Image » University Image Corporate Image » External Recognitions
The β estimates are 1.00, 1.182, and 0.422 respectively. The significance values are less than 0.001.
This shows the impact of Academic Image, University Image, and External Recognitions to the Corporate Image of A university are highly significant. Path analysis 3: Students’ Loyalty » Retention
Students’ Loyalty » Recommendation
The β estimates are 0.857 and 1.00 respectively. The significance values are less than 0.001.
This shows the impact of Retention and Recommendation to the students’ loyalty is highly significant.
.78
CORPORAT E
IMAGE ST UDENT SLOYALT Y
.82
Figure 3: The Coefficients of Multiple Regression between Variables in the Study
Implication to the Management of a University
ECER Regional Conference 2008, UiTM Kelantan
20
revealed that corporate image is an important factor in the customers’ overall evaluation of service consumption and also their overall impression towards the service provider itself.Of the three corporate image dimensions emerged, the dimension of academic image is found to be the most important factor as far as the corporate image is concerned, beside the image of a university and the external recognitions received by the university. This research found that the awards and achievements by academic staffs of the university from their researches, inventions, and publications are important elements influencing students’ positive perception towards the university. Thus, the management of a university should give utmost priority on the academic excellence achieved by the academic faculties. Any achievement or awards obtained by these academic faculties should be well communicated to all stakeholders. The publicity of any achievement by a lecturer, for example, would directly help those respective lecturers to earn valuable appreciation and positive perception from their students. More importantly, the publicity would indirectly elevate the image of a university, as a whole, in the eyes of other stakeholders.
Since the achievements obtained by academic staffs of a university contribute significantly to the corporate image of that particular university; and more importantly it helps to elevate the perceived quality of the university, the university should provide appropriate atmosphere for its academic staff to excel in their respective field. And for the academicians who achieve excellence, they should be rewarded accordingly so that it would others to excel as well.
REFERENCES
Andreassen, T.W. and Lindstead, B. 1998. Customer loyalty and complex services: the impact of corporate image on quality, customer satisfaction and loyalty for customers with varying degrees of services expertise. International Journal of Service Industry Management 9(1): 7-23.
Caruana, A. 2002. Service loyalty: The effects of service quality and the mediating role of customer satisfaction. European Journal of Marketing 36: 811-828.
Dick, A. and Basu, K. 1994. Customer loyalty: toward an integrated conceptual framework. Journal of Marketing Science 22: 99-113.
Dowling, G.R. 1993. Developing your company image into a corporate asset. Long Range Planning 26: 101-110.
Fielder, J.S., Hilton, C.B., and Motes, W.H. 1993. Educational Services Marketing: A proposed system for enhanced recruitment of students. Journal of Professional Services Marketing 8: 191-205. Griffin, J. 2002. Customer loyalty – How to earn it, How to keep it. San Francisco, CA: Josey-Bass. Gronroos, C. 1984. Service Quality: The Six Criteria of Good Service Quality. St John’s University
Press: New York.
Gronroos, C. 2001. The perceived service quality concept – a mistake? Managing Service Quality 11: 150-152.
Zainudin, Mahadzirah, Solihin, The Importance of Corporate Image
21 James, R., Baldwin, G. and Mcinnis, C. 1999. Which University? The Factors Influencing the Choices
of Prospective Undergraduates Centre for the Study of Higher Education. The University of Melbourne, Australia.
Jöreskog, K.G. & Sörbom, D. 1984. LISREL-VI user’s guide (3rd ed.). Mooresville, IN: Scientific Software.
Kaiser, H. 1974. An index of factorial simplicity. Psychometrika, 39: 31-36.
Kang, G.J. and James, J. 2004. Service Quality Dimensions: An examination of Gronroos service quality model. Managing Service Quality 14: 266-277.
Mulaik, S.A., James, L.R., Van Alstine, J., Bennett, N., Lind, S. & Stilwell, C.D. 1989. Evaluation of goodness-of-fit indices for structural equation models. Psychological Bulletin 105: 430–445. Ndubisi, N.O. 2003. Can current customer loyalty predict future loyalty? 5th Asian Academy of
Management Conference – Challenges of Globalized Business: The Asian Perspective 5: 327-334. Reicheld, F.F. 1996. In the qualitative satisfaction model, Stauss, B. and Neuhaus. International Journal
of Service Industries Management 8: 345-351.
Reicheld, F.F. and Sasser, W.E. 1990. Zero defections: Quality Comes to Services. Harvard Business Review 68: 105-111.
Rodie, A.M., and Kleine, S.S. 2000. Customer participation in services production and delivery. In Handbook of Services Marketing and Management, eds. Swartz, T.A., and Iacobuci, D., pp. 111-125, Thousand Oaks, CA:SAGE.
Rust, R.T., Zahorik, A.J. and Keiningham, T.L. 1996. Services Marketing. New York: HarperCollins. Tanaka, J.S. & Huba, G.J. 1985. A fit index for covariance structure models under arbitrary GLS
estimation. British Journal of Mathematical and Statistical Psychology 38: 197–201.
Zainudin, A. and Zaihan, O. 2004. The Impact of Corporate Image on Perceived Quality in Healthcare Industry. Proceeding of Conference of Social Science Research (CSSR 2005). Institute of Research Development and Commercialization UiTM,
Zainudin, A., Rustam, S. and Farouk, M.Z. 2005. Service quality and customer satisfaction in the environment of higher education: A study on the public and private university students in Malaysia, Institute Research Development and Commercialization, IRDC, UiTM.
Zainudin, A., W. Fauzi, W.M. and Azuhari, C.M. 2005d. Achieving Students’ Satisfaction in Higher Education: Closing the gaps. International Conference on Quantitative Sciences and its Application (ICOQSIA 2005). Faculty of Quantitative Sciences, UUM.
Zainudin, A. (2007). The influence of Service Quality and Corporate image on Students’ Loyalty in Higher Education: The case study of a local university, Unpublished Thesis, Universiti Malaysia Terengganu, Malaysia.
BM(03)
THE FACTORS EFFECTIVE TO SUCCEED IN IMPLEMENTING
ACTIVITY BASED COSTING AND MANAGEMENT
Ali Khozein1
A Faculty Member of Islamic Azad University (Ali Abad-e Katool Branch) E-mail: [email protected]
ABSTRACT
Activity based costing / management system is one approach in which its launching and implementing in practice will bring advantages for the users. However, lack of knowledge to the ones leading ineffectiveness of launching and implementing activity based costing, budgeting and management systems will lead to wasting of financial and human sources in an organization. Organizations have no choice but rebuilding and recovering the failured systems due to being of many advantages. Such a process needs much more investing and using more resources. So, we should be aware of the ones bringing failure and we should try to put the approaches suggested in such an article from theory to practice consciously. This article has a close look at pros and cons of using ABC/ABM, and the author has mentioned the different reasons of failures, when implementing, and the deterrent ways. The reasons can be classified in the five groups including deterrent reasons, technical weakness, the user denial, organizational obstacles and others. The deterrent reasons are the most common and significant ones. Technical weakness is due to factors stemmed from nature activity based systems. Also if should be noted that for some reasons, the users may deny its usage and there are some obstacles in organization and the existing specific characteristics in entities will cause the system implementation failure. To know the issues and the ones causing the issues and to avoid them is the origin of implementation and the success of such systems.
Keywords: activity based costing, activity based management, implementing, budgeting, management systems.
INTRODUCTION
In globally developed and competitive markets, to be adapted with competitive environment, dynamic and complicated environment is essential for organization to continue their activity. For this purpose, many information systems have been presented for services and product costing and budgeting, cost – reducing, continuous improvement, performance measurement, and eventually value– adding. Traditional cost system using some cost drivers supported financial and budget reporting in a wrong way and presented many false information. In such a condition, many organizations have been trying to improve their costing systems. Improved costing system is a system for evaluating the source usage through services, production or consumers in an effective way. Technology developing and competition increasing were an effective factor for designing such a system.
One new method was ABC/ABM which is of many advantages compared to traditional costing system based on volume. So in order to enjoy its advantage, companies are willing to implement ABM/ABC system. We should implement ABC/ABC systems consciously, intelligently and conservatively. Since being successful in doing such a project is not as much as we imagine.
1
ECER Regional Conference 2008, UiTM Kelantan
24
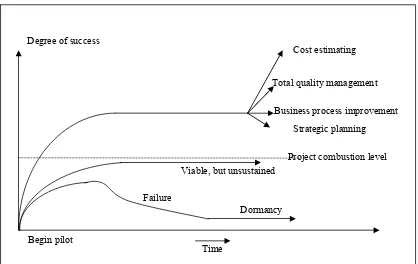
Exhibit 1 portrays three paths for ABM/ABC implementing programs. As it shows, only one way is higher than the optimum level and can be kept easily. First, three paths will go up from starting point very fast and will reach to the climax point, then suddenly these three paths will be separated and two paths will face failure and just one way will end the path successfully. Now it is our turn to follow the paths to get their experience.Figure 1: Exhibit 1, Possible paths of ABC/ABM
The lower path going in a wrong way will be followed by people who will understand mistake in a traditional system. However, they will not touch the successful point. Since movement to use management techniques based on activity and process has been known as an essential factor, ABM/ABC projects will not be static any longer. Rebuilding and recovering the failured system need much more investing and using more financial and human resources can be the result of try and error and other unforecast situations. So, it would be better to start such a process, i.e. its designing and implementing in system consciously and intelligently.
The middle path is the result of high–ranking managers supporting ABM/ABC system continuously and their power in an organization is so much that it will result in implementing ABN/ABC system continuously. In spite of failure in implementing in ABC system, managers of high authority in organizations are aware of its advantages and keep on their supporting such a system. Unfortunately, costing information presented by such systems to the employees is not so useful that it can pass the acceptable level and can portray its legibility. If so, such systems are not very economical. The higher path shows the successful project of ABM/ABC system which is of many advantages for the users and will lead to make better decision.
Begin pilot
Time Degree of success
Project combustion level Cost estimating
Strategic planning
Viable, but unsustained
Dormancy Failure
Total quality management
Business process improvement
Ali, The Factors Effective To Succeed
25 WHAT IS ABM/ABC SYSTEM?
ABC system can be taken into account as a development and extension of two-stage assignment for costing and is underlying for modern cost system, measuring products and program cost, more efficient operational budgeting and appropriate product pricing. In traditional costing, costs usually are allocated based on volume to the cost objects. Based on ABM/ABC, although, programs, products and services are not the direct resource users, they are activity users. ABM/ABC system will put an emphasis on activity as a cost object since activity is the main reason for costing. In such a system first, costing will be assigned to the activities and then through the activities, it will be given to other objects such as programs, plans, products, services.
Having determined the cost, the managers will give much more credence to the new cost object i.e. activities. From this respect, ABM/ABC system is assigning costing system based on research in which activities and main programs will be cost drivers determined, analyzing the economic entity and its operation. Measuring the products and program cost appropriately, product price, product processing improvement, eliminating the additional activities, identifying the cost drivers, value added activities identification, eliminating non value added activities, operation programming, determining trade strategy of entity and finally measuring its operation appropriately need some information provided by ABM/ABC system much better compared to the management accounting conventional systems.
ABM/ABC can be an axis around which complex particles of advanced cost management system keep and if implemented carelessly and unthoughtfully, it can neutralize total cost management. However, the effective usage of ABM/ABC system will lead to increase the company value since by using ABM/ABC technology, we can identify the cost of the inefficient methods of program and process and can identify and measure the saving amount of improving such methods. Also redesigning the programs by an ABC analyzer with efficient processes will lead to cost decreasing and quality improvement and plan-performing and effectiveness of budget planning. They are the best results we can expect one system in the present global competition.
Now, it is turn to look for and find the obstacles in implementing ABM/ABC plans. To be aware of different reasons of failures in implementing ABM/ABC plans can increase the success possibility in the future plans.
THE FAILURE REASONS FOR SOME ABM/ABC SYSTEMS
ECER Regional Conference 2008, UiTM Kelantan
26
Generally speaking, there are many reasons for the issues existed in implementing ABM/ABC plans which can be classified into the following ones:1. The deterrent reasons 2. Technical weakness 3. The user denial 4. Organization obstacles 5. The others
THE DETERRENT REASONS
The deterrent reasons, the most significant and common ones, are the same as follows.
• How to act to implement and launch the new project is of significance. In appropriate launching will result in missing the next stages for implementing the system. There will be many forms for launching activity based costing and operational budgeting and sometimes combination of which is the best choice. Using many stimulated projects has a high effect on the right selection and individual understanding of the modern systems. Using planners and users, visual sense is effective in fast identifying the possible weakness before implementing the system.
• When ABM/ABC systems are launched, only by using the financial and accounting parts (or accountants over use it) and cooperation of other effective concerned parts are not used in implementing the system and it is not enjoyed intelligently and it is changing to the ordinary one the same as many financial and management activities. So before implementing ABM/ABC systems, we should be aware of some information needed and facilities for transferring the information for operational parts to launch and go on implementing ABM/ABC systems based on them. Holding some conferences and free discussions, transferring and using the results obtained in organizations and using other ways to attract the employees, cooperation will increase the success degree of the new systems.
• If the new innovations of ABM/ABC system are an ordinary, predetermined and aimless method, new models or systems will be made illusively. Such systems are to remove the inefficiency of the innovated traditional systems and their objectives are to meet the information needed for the users. So helping to solve issues pertaining to information in an organization and to promote the organization will aim to increase in applying the new system. So in implementing stages, we should have a continual contact with the users and also try to identify their issues and to receive the on-time feedback by the users to make ourselves satisfied with the condition provided by the system.
Ali, The Factors Effective To Succeed
27 themselves aware through different stages of tracing the cost of activities and costing subjects and programs.
• When information available in ABM/ABC system become like a reviewed book and compared with previous accounting and official systems. There is a connection between evaluations of employees, working and official systems and using ABM/ABC systems in a wrong way in such organizations will result in encouraging the wrong behaviors continuously.
• Persisting against changes have been underestimate, the managers and employees who are not aware of financial issues think that a successful financial system is one which provides financial report monthly and balances books of accounts. Their questions is that "what is the problem existed in a system obtaining the optimum results monthly?" We should show carefully and patiently the disadvantages of the traditional system based on volume and the potential improvements of new system and its effects on correcting the past wrong decisions and improving the resource allocation. Introducing the new system effectively is of significance. ABC may be simply considered as a costing system with more details.
• When many users don’t trust to the new accounted figures of ABM/ABC system and such a view has been underestimated by designers. Tracing the cost by ABM/ABC system in a right way, we can find that there is a significant difference between the results obtained from the product cost, services or outputs of a process. Such a difference will make one doubt and even one strong organizational shock. So, the result obtained and its documentation should be transferred to different centers in an organization gradually.
• When ABC/ABM systems have a great effect on some parts of an organization. For example when the managers in charge of producing goods with certain profit observe that the accounted profit in the traditional systems has been decreased or changed to loss by ABM/ABC calculation, they will object to ABM/ABC systems in an organization.
• When ABM/ABC system will not contribute to officials in accountability process. One significant feature in such systems is to facilitate and to improve the responding process and to be clear in responding with the budgeting and planned standards and to evaluate the managers’ achievements. The effect scope of ABM/ABC system to achieve the goal, the budget and facilities provided used is potentially much more developed than the traditional systems.
TECHNICAL WEAKNESS
