USING OPENSTREETMAP DATA TO GENERATE BUILDING MODELS WITH THEIR
INNER STRUCTURES FOR 3D MAPS
Zhiyong Wang∗
, Alexander Zipf
Heidelberg university, Im Neuenheimer Feld 368, 69120 Heidelberg, Germany - (zhiyong.wang, zipf)@uni-heidelberg.de
Commission IV, WG IV/5
KEY WORDS:3D generation, algorithm, OpenStreetMap
ABSTRACT:
With the development of Web 2.0, more and more data related to indoor environments has been collected within the volunteered geographic information (VGI) framework, which creates a need for construction of indoor environments from VGI. In this study, we focus on generating 3D building models from OpenStreetMap (OSM) data, and provide an approach to support construction and visualization of indoor environments on 3D maps. In this paper, we present an algorithm which can extract building information from OSM data, and can construct building structures as well as inner building components (e.g., doors, rooms, and windows). A web application is built to support the processing and visualization of the building models on a 3D map. We test our approach with an indoor dataset collected from the field. The results show the feasibility of our approach and its potentials to provide support for a wide range of applications, such as indoor and outdoor navigation, urban planning, and incident management.
1. INTRODUCTION
3D building Models are useful in many application areas, such as incident management, urban planning, and location based services (Wang et al., 2016; Coors and Zipf, 2007; Khoshelham and Zlatanova, 2016; Biljecki et al., 2015). With the rapid growth of the volume of Volunteered Geographic Information (VGI), there is an increasing interest in using VGI to construct 3D city models (Goetz, 2013; Jochem and Goetz, 2012; Wu, 2009).
Following the advent of Web 2.0 technologies, Volunteered Geographic Information (VGI) has attracted much attention in academic and industry (Bakillah et al., 2014; Horita et al., 2013; Senaratne et al., 2017; Fonte et al., 2015). The term VGI was coined by Goodchild (2007) and represents a new trend of collaboratively generating spatial information. With the help of VGI frameworks, citizens (volunteers) contribute to the collection and sharing of data about the environments. One of the most well-known VGI projects is OpenStreetMap (OSM) (Neis and Zielstra, 2014b). OpenStreetMap is a web mapping platform where volunteers can gather geographic data of real-world objects, store it in a central database, and disseminate it through web services. The data in the OSM database is structured in the form of OSM elements i.e., nodes, ways, relations, and tags. Using the OSM infrastructure, the interested volunteers capture a variety of natural and man-made features, such as streets, rivers, railways, and even buildings. Driven by the availability of high-resolution satellite imagery from Bing, the OSM database has grown rapidly in the past few years, and has provided large amounts of geographic data for a wide range of applications, such as disaster management (Eckle et al., 2016; Soden and Palen, 2014; Rahman et al., 2012), route planning (Schmitz et al., 2008; Neis and Zielstra, 2014a; Luxen and Vetter, 2011), traffic simulation (Dallmeyer et al., 2014; Xu et al., 2016; Rieck et al., 2015).
As OSM has been widely used to model objects in outdoor environments, more and more attention has been devoted to
∗
Corresponding author
mapping indoor environments in OpenStreeMap. Some researchers investigated the quality of building footprint data in the OSM database (Fan et al., 2014). They found that the OSM footprint data in some cities of Germany has a high degree completeness and semantic accuracy, which shows the potentials of using OSM to model building structures. Although it is difficult to directly describe 3D geometries with the current OSM data schema, in recent years some efforts have been made to address this issue by introducing new OSM tags. Along with these efforts, a couple of OSM data schemas have emerged to capture indoor components (e.g., doors, rooms, and elevators) and their relationships, such as IndoorOSM (Goetz and Zipf, 2011), Full 3D Buildings (F3DB) schema (OSM Wiki, 2017a), and Simple Indoor Tagging (OSM Wiki, 2017b). Based on these schemas, some indoor mapping projects have been conducted to map certain types of buildings (e.g., universities, train stations, and museums), which leads to a couple of indoor maps, such as OpenLevelUp (www.openlevelup.net), OSMTools indoor map (http://clement-lagrange.github.io/osmtools-indoor). However, the maps mentioned above only provide 2D visualization of building floors and don’t involve any 3D construction of buildings, which limits their applications.
open source and provide public APIs, which makes it easy to integrate them into web or mobile applications. It is even possible to add live spatial data to some of these applications. Nevertheless, due to lack of consideration of 3D reconstruction of inner components of buildings, most of these projects only visualize outer shape of buildings and don’t provide 3D representation of their inner structures.
In this study, we aim at constructing 3D building models from OpenStreetMap data and visualizing them on a 3D map. Our work is inspired by the previous work of (Goetz, 2013), but focuses on the reconstruction of the buildings with their inner components (e.g., rooms, windows, and doors) for 3D maps. Based on the indoor mapping schema IndoorOSM (Goetz and Zipf, 2011), we develop an algorithm to support generation of 3D building models using OSM data, and build a web application for 3D visualization. The remainder of this paper is structured as follows: Section 2 gives a brief overview of IndoorOSM. Section 3 presents the system architecture of the web-application developed for generation and visualization of 3D buildings. In Section 4, we present the algorithm developed for 3D construction of building models from OSM data. We show some preliminary results of our application in Section 5. This paper is ended with some conclusions and future works in Section 6.
2. A BRIEF OVERVIEW OF INDOOROSM
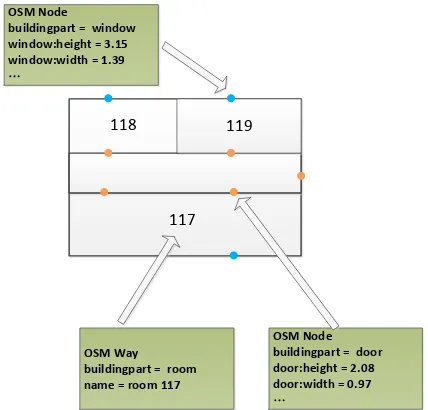
IndoorOSM is selected for indoor mapping in this research. It is defined based on the definition of a 3D Building Ontology, following a hierarchically organized structure. In IndoorOSM, each building is modeled as an OSM relation, which is attached with general information (e.g., address, postcode, country). The building relation is the main relation and consists of a certain amount of levels (representing floors). Inner building parts (such as rooms, corridors) are modeled as OSM closed ways and are associated with their corresponding level as its members. The openings (such as doors and windows) of a room are modelled as OSM nodes, which correspond to the centre points on their 2D footprints and are attached to room boundaries. Additional information of the openings (e.g., height, breast, and width) is included as tags. Figure 1 shows an example of using IndoorOSM to model rooms with windows and doors. To support representation of 3D information, the tags “level ” and “height ” are introduced to indicate which level this building part is located at and the height information respectively. Based on this information, the height information of other building parts (e.g., doors and windows) can be derived. More details of IndoorOSM can be found in Goetz and Zipf (2011).
3. SYSTEM ARCHITECTURE FOR GENERATION OF
3D BUILDING MODELS
For generation of 3D building models from OpenStreetMap data, in this paper, we design and develop a web application to support extraction and visualization of building data. Figure 2 describes the system architecture of our web application, which consists of two parts: client side and server side. On the client side, we use OSMBuildings (www.osmbuildings.org), which is a JavaScript library built based on WebGL, to visualize the 3D environments. In OSMBuildings, the 3D data is organized and imported in GeoJSON. On the server side, a java application is built to process the indoor OSM data, extract the height information, and construct building components. The building data is structured according to the specifications defined by OSMBuildings. Once the client side sends the Http request to
OSM Node
Figure 1: An example of using IndoorOSM to model rooms with windows and doors. The OSM nodes that represent windows and doors are coloured in blue and in brown respectively.
the server for building information, the java application processes the request, generates building information, and sends GeoJSON-encoded data back to the client via Http response. Then the client application extracts the building data from the response, and renders the buildings via the OSMBuildings library.
Figure 2: The system architecture of the web application for 3D construction of building models.
4. THE PROPOSED ALGORITHM FOR 3D
CONSTRUCTION OF BUILDINGS
The algorithm for 3D construction of buildings
1:extract building relations from OSM data
2:foreach buildingdo
3: process the height information of all floors
4: foreach floordo
5: extract rooms from the current level relation
6: foreach roomdo
7: create a polyline that represents the boundary of the room
8: find the opening setOassociated with the room 9: foreach openingo∈Odo
10: ifois a windowthen
11: add the window with the upper and lower wall parts
12: else ifois a doorthen
13: add the door with the upper wall part
14: end if
15: end for
16: end for
17: add shells
18: add roofs
19: add corridors
20: end for
21: end for
22: return 3D building models in GeoJSON
Figure 3: The proposed algorithm for 3D construction of building models.
(a) The center line of walls (derived from the OSM way of a room)
(b) Splitting the wall outline with openings
Figure 4: The extraction of walls considering openings. The brown lines represents doors. The blue lines represent windows.
The construction algorithm first extracts all building relations. For each building, it collects the height information of all floors and derives the elevation of each floor. For each floor, it extracts room information, and takes OSM ways that represent rooms. Because rooms usually contain openings like windows and doors, the generation of rooms is combined with the processing of the information of windows and doors. A polyline is created for each room based on the corresponding OSM closed way, and represents the centerline of its walls. Then the algorithm iterates the OSM nodes along the OSM way and finds the nodes that are openings. Based on the location and width information of the openings, we create line segments that correspond to the openings, and split the polyline of the room into several parts, as shown in Figure 4. In this study, we assume that all walls and openings have the same thickness, so we introduce a buffer
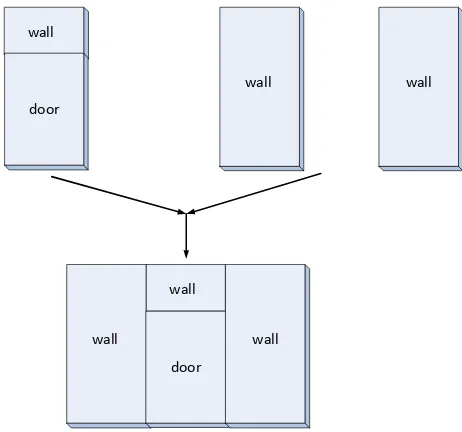
around each line segment to represent their 2D footprints. To extrude the wall of rooms, each wall buffer is attached with height information of the corresponding level. On line 11 in Figure 3, each window is generated with two wall parts, one above and one below the window (as illustrated in Figure 5). The window and the wall parts share the same center line, but are attached with different height values, which are derived according to the information of windows (i.e., width, height and breast). In a similar way, we create the doors (as shown in Figure 6), and add them into the walls. Roofs, shells, corridors are generated accordingly. Finally, the algorithm outputs 3D building data in the format of GeoJSON.
wall wall
wall
window
wall
wall
wall
window wall
wall
Figure 5: The construction of a window with its adjacent wall parts.
wall wall
wall
door wall
wall
wall door
Figure 6: The construction of a door with its adjacent wall parts.
5. APPLICATION RESULTS
building (Berliner Str. 41-45) The Mathematikon building contains seven floors (five floors above the ground and two floors under the ground). We used the Java OpenStreetMap Editor (JOSM) to gather the data based on the evacuation plans of the building. The proposed construction algorithm was implemented in the Java application on the server side to process the OSM data and to generate building models. The building data is transferred to the client side and is visualized on a 3D map.
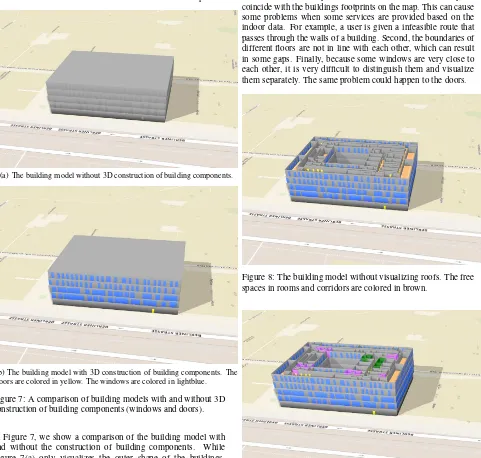
(a) The building model without 3D construction of building components.
(b) The building model with 3D construction of building components. The doors are colored in yellow. The windows are colored in lightblue.
Figure 7: A comparison of building models with and without 3D construction of building components (windows and doors).
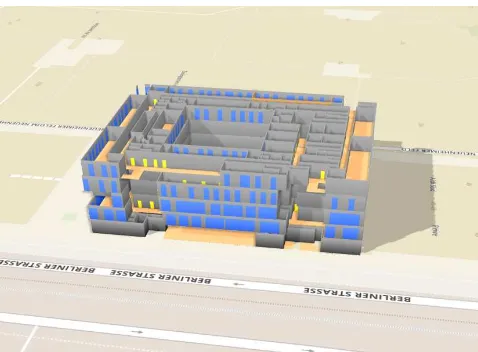
In Figure 7, we show a comparison of the building model with and without the construction of building components. While Figure 7(a) only visualizes the outer shape of the buildings, Figure 7(b) gives more details and shows the features in the outer walls of the building, i.e., windows and doors. Especially the entrances, they are used by people to enter the building, and play an important role in connecting indoor and outdoor environments. Figure 8 shows the building without visualization of roofs. From this figure, we can see the inner building components (rooms, corridors, and doors) at the fourth floor of the building. Rooms with different functions can be highlighted with different colors (see Figure 9 for an example), which can help people to find the intended rooms. Figure 10 shows the building without visualization of roofs and outer walls. From this figure, we can see the open areas where they can move inside the buildings. By visualizing building models on 3D maps, people can not only see the information of surrounding environments of buildings, such as street names, but also have an
overview of the indoor environments (e.g., rooms, doors, corridors). This can be very useful for many applications, such as indoor and outdoor navigation, urban planning, and incident managements.
The results also reveal some issues that should be considered in further analysis of indoor OSM data. First of all, due to the errors in the data collection process, the collected indoor data may not coincide with the buildings footprints on the map. This can cause some problems when some services are provided based on the indoor data. For example, a user is given a infeasible route that passes through the walls of a building. Second, the boundaries of different floors are not in line with each other, which can result in some gaps. Finally, because some windows are very close to each other, it is very difficult to distinguish them and visualize them separately. The same problem could happen to the doors.
Figure 8: The building model without visualizing roofs. The free spaces in rooms and corridors are colored in brown.
Figure 9: The building model with highlighted rooms. The rooms colored in purple are toilets. The rooms colored in green are meeting rooms.
6. CONCLUSIONS AND FUTURE WORK
Figure 10: The building model without visualizing walls and roofs
building components (e.g., rooms, windows, and doors). Based on the indoor mapping schema IndoorOSM, we have developed an algorithm to support the generation of building models from OSM data. A web application using a JavaScript rendering engine has been built to visualize the 3D environments. The results demonstrate the feasibility of our approach in the construction of building models, and show the potentials of using OSM data to support modelling of the built environments.
It should be mentioned that due to the limitations of IndoorOSM, currently the vertical parts inside buildings, such as stairs, elevators, and escalators, are not considered. Such building information is very important for deriving the network topology for some special applications, like indoor navigation. Furthermore, the building models constructed in this paper contain only flat roofs and rectangle windows. To generate realistic roof and window geometries, the detailed 3D geometry information is required. But it is difficult to directly introduce 3D geometries with the current OSM framework. One of the promising ways to address this issue is to introduce some tags for storing the information of roofs and windows (e.g., shape, materials) and to define certain rules for transforming the semantics information to 3D geometries. Another possible way is to use footprints to detect and reconstruct the building structures (Dehbi et al., 2016; Henn et al., 2013). Furthermore, due to the limitation of the visualization tool we used, the building parts that are underground are not visualized. Such visualization requires further advancements in 3D visualization technology.
In future works, we would like to modify the data schema IndoorOSM to include more building information, such as the vertical connections (e.g., stairs) and obstacles inside buildings. This will allow us to generate building models with a higher level of details. New methods should be designed to support the construction of these detailed building elements for 3D maps. Because the thickness of walls may vary between rooms, the storing of such information is also important for generation of more realistic building models, and requires further developments in the indoor mapping schema. Furthermore, we will also study the use of 3D building models to support different kinds of applications, such as estimation of the propagation of noise, fire simulation, and emergency response. New approaches would be needed to extract the relevant information for different purposes. For example, for integration of indoor and outdoor navigation, new algorithms are required to
derive a complete routing graph, which combines indoor and outdoor networks. For the applications of indoor OSM data, the OSM data quality is also an important issue and needs to be addressed. Currently the indoor OSM data is mainly collected by hand and can involve different kinds of errors. So another important step will be to develop effective approaches to check the fitness of indoor OSM data.
ACKNOWLEDGEMENTS
We would like to thank the Klaus Tschira Stiftung Heidelberg for their support to establish the “Heidelberg Institute for Geoinformation Technology” (HeiGIT), which provides resources for this research.
REFERENCES
Bakillah, M., Lauer, J., Liang, S. H., Zipf, A., Jokar Arsanjani, J., Mobasheri, A., Loos, L. and Karimi, H., 2014. Exploiting big vgi to improve routing and navigation services. Big data techniques and technologies in geoinformaticspp. 177–192.
Biljecki, F., Stoter, J., Ledoux, H., Zlatanova, S. and C¸ ¨oltekin, A., 2015. Applications of 3d city models: State of the art review. ISPRS International Journal of Geo-Information4(4), pp. 2842– 2889.
Coors, V. and Zipf, A., 2007. Mona 3d–mobile navigation using 3d city models.LBS and Telecartography.
Dallmeyer, J., Lattner, A. D. and Timm, I. J., 2014. Gis-based traffic simulation using osm. In: Data Mining for Geoinformatics, Springer, pp. 65–82.
Dehbi, Y., Gr¨oger, G. and Pl¨umer, L., 2016. Identification and modelling of translational and axial symmetries and their hierarchical structures in building footprints by formal grammars. Transactions in GIS.
Eckle, M., Albuquerque, J. P. d., Herfort, B., Wolff, R., Zipf, A., Leiner, R. and Jacobs, C., 2016. Leveraging openstreetmap to support flood risk management in municipalities: A prototype decision support system.
Fan, H., Zipf, A., Fu, Q. and Neis, P., 2014. Quality assessment for building footprints data on openstreetmap. International Journal of Geographical Information Science 28(4), pp. 700– 719.
Fonte, C. C., Bastin, L., See, L., Foody, G. and Lupia, F., 2015. Usability of vgi for validation of land cover maps. International Journal of Geographical Information Science29(7), pp. 1269– 1291.
Goetz, M., 2013. Towards generating highly detailed 3d citygml models from openstreetmap. International Journal of Geographical Information Science27(5), pp. 845–865.
Goetz, M. and Zipf, A., 2011. Extending openstreetmap to indoor environments: bringing volunteered geographic information to the next level. Urban and Regional Data Management: Udms Annual 2011pp. 47–58.
Goodchild, M. F., 2007. Citizens as sensors: the world of volunteered geography.GeoJournal69(4), pp. 211–221.
Horita, F. E. A., Degrossi, L. C., de Assis, L. F. G., Zipf, A. and de Albuquerque, J. P., 2013. The use of volunteered geographic information (vgi) and crowdsourcing in disaster management: a systematic literature review.
Jochem, R. and Goetz, M., 2012. Towards interactive 3d city models on the web. International Journal of 3-D Information Modeling (IJ3DIM)1(3), pp. 26–36.
Khoshelham, K. and Zlatanova, S., 2016. Sensors for indoor mapping and navigation.Sensors.
Luxen, D. and Vetter, C., 2011. Real-time routing with openstreetmap data. In: Proceedings of the 19th ACM SIGSPATIAL international conference on advances in geographic information systems, ACM, pp. 513–516.
Neis, P. and Zielstra, D., 2014a. Generation of a tailored routing network for disabled people based on collaboratively collected geodata.Applied Geography47, pp. 70–77.
Neis, P. and Zielstra, D., 2014b. Recent developments and future trends in volunteered geographic information research: The case of openstreetmap.Future Internet6(1), pp. 76–106.
OSM Wiki, 2017a. Full 3D Building. http://wiki. openstreetmap.org/wiki/F3DB. [accessed on 30 April 2017].
OSM Wiki, 2017b. Simple Indoor Tagging. http:// wiki.openstreetmap.org/wiki/Simple_Indoor_Tagging. [accessed on 30 April 2017].
Over, M., Schilling, A., Neubauer, S. and Zipf, A., 2010. Generating web-based 3d city models from openstreetmap: The current situation in germany. Computers, Environment and Urban Systems34(6), pp. 496–507.
Rahman, K. M., Alam, T. and Chowdhury, M., 2012. Location based early disaster warning and evacuation system on mobile phones using openstreetmap. In: Open Systems (ICOS), 2012 IEEE Conference on, IEEE, pp. 1–6.
Rieck, D., Sch¨unemann, B. and Radusch, I., 2015. Advanced traffic light information in openstreetmap for traffic simulations. In:Modeling Mobility with Open Data, Springer, pp. 25–34.
Schmitz, S., Zipf, A. and Neis, P., 2008. New applications based on collaborative geodatathe case of routing. In: Proceedings of XXVIII INCA International Congress on Collaborative Mapping and Space Technology.
Senaratne, H., Mobasheri, A., Ali, A. L., Capineri, C. and Haklay, M., 2017. A review of volunteered geographic information quality assessment methods. International Journal of Geographical Information Science31(1), pp. 139–167.
Soden, R. and Palen, L., 2014. From crowdsourced mapping to community mapping: The post-earthquake work of openstreetmap haiti. In: COOP 2014-Proceedings of the 11th International Conference on the Design of Cooperative Systems, 27-30 May 2014, Nice (France), Springer, pp. 311–326.
Wang, Z., Zlatanova, S. and Steenbruggen, J., 2016. Traffic incident management in the presence of hazards. ISPRS-International Archives of the Photogrammetry, Remote Sensing and Spatial Information Sciencespp. 45–49.
Wu, H., 2009. Integration of 2d architectural floor plans into indoor openstreetmap for reconstructing 3d building models. Master’s thesis, TU Delft.