* Corresponding author.
ESTIMATION OF MEASUREMENT UNCERTAINTY IN THE DETERMINATION OF Fe
CONTENT IN POWDERED TONIC FOOD DRINK USING GRAPHITE FURNACE ATOMIC
ABSORPTION SPECTROMETRY
Harry Budiman*, Fransiska Sri H. Krismastuti, and Nuryatini
Research Centre for Chemistry, Indonesian Institute of Sciences, Kawasan PUSPIPTEK Serpong, Banten 15314, Indonesia
Received June 10, 2009; Accepted July 22, 2009
ABSTRACT
The evaluation of uncertainty measurement in the determination of Fe content in powdered tonic food drink using graphite furnace atomic absorption spectrometry was carried out. The specification of measurand, source of uncertainty, standard uncertainty, combined uncertainty and expanded uncertainty from this measurement were evaluated and accounted. The measurement result showed that the Fe content in powdered tonic food drink sample was 569.32 µg/5g, with the expanded uncertainty measurement ± 178.20 µg/5g (coverage factor, k = 2, at confidende level 95%). The calibration curve gave the major contribution to the uncertainty of the final results.
Keywords:uncertainty, powdered tonic food drink, iron (Fe), graphite furnace AAS INTRODUCTION
Nowadays, the testing and calibration laboratories have to provide high confidence and globally acceptable of measurement results in order to support the important action or decision based on it, especially for international trade and customer satisfaction. Therefore, according to guide ISO/IEC 17025, the measurements should be carried out by using validated method of analysis, defining the internal quality control procedures, participating in proficiency testing schemes and establishing the traceability and uncertainty of the measurement results. The importance for uniform approach of measurement in estimation of uncertainty and its reporting has attracted metrologist globally. An evaluation, or at least full consideration, of all identifiable components that contribute to the uncertainty of a test result will allow valid results to be obtained and indicate the aspects of the test that require attention to improve procedures. In addition, systematic assessment of the factors influencing the results and its uncertainty forms a key of validation method. According to EURACHEM/CITAC, the uncertainty can be defined as ‘a parameter associated with the result of measurement, which characterizes the dispersion of the values that could reasonably be attributed to the measurand’ [1]. In the other word, the estimation of uncertainty is a result of the various components which affects to the measurement.
The evaluation of uncertainty requires the analyst to look closely at all the possible sources of uncertainty. Many possible sources of uncertainty may be arisen in practice such as sampling, sample effects (matrix effects and interferences), instrument effects, storage conditions, reagent purity, assumed stochiometry,
measurement condition, uncertainties of masses and volumetric equipment, reference values, computational effect, blank correction, operator effect, and random effect. In estimating the overall uncertainty, it may be necessary to take each source of uncertainty and treat it separately to obtain the contribution from that source. Each of the separate contributions of uncertainty is referred to as an uncertainty component, and known as standard uncertainty if it is expressed as a standard deviation. For a measurement result, the total uncertainty, termed combined standard uncertainty is calculated and obtained by combining all the uncertainty components. Furthermore, an expanded uncertainty should be used for most purposes in analytical chemistry. The expanded uncertainty provides an interval within which the value of measurand is believed to lie with a higher level confidence.
properties or performance. Thus if two competent laboratory examine different sub samples from the same sample source by the same method and obtain numerically different results, these results may not be different when uncertainty of measurement is taken into account [1-4].
This paper describes the evaluation of uncertainty of measurement in determination of Fe content in powdered tonic food drink using graphite furnace atomic absorption spectrometry. The specification of measurand, source of uncertainty, standard uncertainty, combined uncertainty and expanded uncertainty from this measurement were evaluated and accounted. The purpose of the evaluation of uncertainty in this measurement is to provide the bias taken place which depended on the various components or measurands that effect to the measurement. This is required for the laboratory participating in the Proficiency Testing Scheme: Analysis of Proximates (Moisture, Fat, Protein, and Ash) and Minerals (Iron, Calcium, and Sodium) in Powdered Tonic Food Drink held by Food Nutrition Research Institute, Department of Science and Technology, Philippines (FNRI-DOST). The estimation of uncertainty measurement of each laboratory is needed by proficiency testing provider for comparison with the standard deviation for proficiency assesment (σP) that
represents fitness-for-purposes over a whole application sector in proficiency testing scheme [5].
EXPERIMENTAL SECTION
Material
All chemicals were purchased from MERCK and for analysis grade. NANOpure deionized water (17.8 MΩcm, Barnstead) was used for all solution preparation. The dilute of HNO3 solution was used in the preparation of
powdered tonic food drink sample such as 6 M; 0.1 M; and 0.01%. Calibration of standard Fe solution was prepared by the dilution of titrisol of Fe solution 1000 ± 0.002 mg/L as stock solution. The test sample is powdered tonic food drink which prepared and distributed by FNRI-DOST.
Instruments
Hotplate Cymarec 2 and muffle furnace Sibata were used in the preparation of powdered tonic food drink sample by means of dry digestion. Graphite furnace atomic absorption spectrometer SpectrAA-880 Zeeman Varian was used to determine the concentration of Fe contained in sample.
Sample Preparation
The powdered tonic food drink sample was prepared by dry digestion method according to AOAC Official Method 999.11 [6].
Drying step. The 5 g of sample was weighed in the crucible and heated on a hot plate at temperature 100 °C until the sample blacken was formed.
Ashing step. The crucible was put in the furnace at initial temperature not higher than 100 °C and the temperature of furnace was slowly raised to 450 °C at rate nomore than 50 °C/h. The sample was ashed for at least 8 h or overnight. Then, the crucible was taken out from the furnace and let it cool. The ash was wetted with 1-3 mL water and evaporated on hotplate. The crucible was put back in furnace with temperature set up the same as the first step of ashing above. The procedure was repeated until the sample was completely ashed, ash should be white/grey or slightly colored.
Dissolving step. The ash was dissolved in 5 mL of 6 M HCl and evaporated on hotplate. The residue was dissolve in 10-30 mL, to the nearest 0.1 mL, of 0.1 M HNO3. Finally, the solution was transferred into
volumetry flask and added with the 0.01% HNO3 until
50 mL.
RESULT AND DISCUSSION
Specification of Measurand
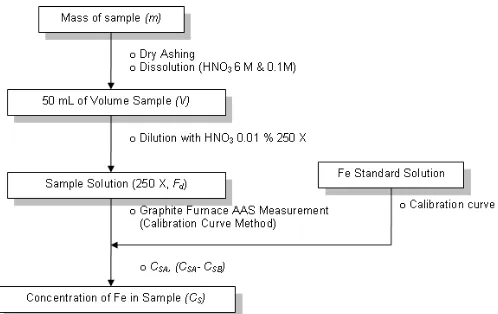
The specification of measurand, first step in estimation uncertainty, is carried out to describe the measurement procedure. This specification consists of a listing of the measurement steps and a mathematical statement of the measurand and the parameters upon which it depends on. The measurement sequence to determine of Fe content in powdered tonic food drink using graphite furnace atomic absorption spectrometry was shown in the following flowchart Figure 1.
According to the measurement sequence above, the measurand of the procedure can be determined. The measurand was the concentration of Fe in sample,
which depends on concentration of Fe obtained by the graphite furnace AAS measurement using curve calibration, volume of sample, dilution factor, the mass of sample and the recovery value obtained from method validation. The mathematic statement to determine the concentration of Fe in sample was shown in the following formula.
Re
SA SB d
S
C C xVxF
C
mx c
(1)
where :
CS : Concentration of Fe in sample (ng/g)
CSA : Concentration of Fe from Graphite furnace AAS
measurement after plotting the absorbance of sample into curve calibration (µg/L)
CSB : Concentration of Fe from Graphite furnace AAS
measurement after plotting the absorbance of blank into curve calibration (µg/L)
V : Volume of sample (mL) Fd : Dilution factor
M : Mass of sample (g)
Rec : Recovery from validation of method
Sources of Uncertainty
All of the sources of uncertainty were identified in determination of Fe content in powdered tonic food drink using graphite furnace atomic absorption spectrometry. They consists of the uncertainties from concentration of Fe obtained by the graphite furnace AAS, the uncertainties of mass of sample, the uncertainties of dilution factor, the uncertainties of volume of sample and the uncertainties of repeatability. The cause-effect diagram in Figure 2 was used to describe the sources of uncertainty in this measurement so that the relation between the sources of uncertainty and their influence to the uncertainty of result were shown.
Quantifying Uncertainty [2,7,8]
Weighing sample
The 5.001 g of powdered tonic food drink samples were weighed by the difference between container plus sample and empty container. The standard uncertainty of balance is ± 0.0003 g at 95% confidence level which is stated in the certificate of calibration. The standard deviation from balance was calculated by dividing 0.0003 by percentage point of the normal distribution at 95% confidence level. A 95% confidence interval is calculated using a value 1.96≈2, in equation (2). The contribution uncertainty from the balance was calculated by the equation (3). The value 0.00015, in equation (3), was multiplied by 2, considering two times weighing (container plus sample and empty container)
0.0003
0.00015 2
Balance
(2)
Figure 2. The sources of uncertainty in the determination of Fe content in powdered tonic food drink using graphite furnace atomic absorption spectrometry.
μ μ 2
( )m 2( Balance) 0.00021213g (3)
Dissolving sample
After dry ashing preparation, sample was dissolved with dilute HNO3 until 50 mL in volumetric
flask. The manufacturer quotes a volume for the flask of 50 mL ± 0.06 mL measured at temperature 20 °C. The value of uncertainty is given without confidence level or distribution information. So that the standard uncertainty from calibration of volumetry flask was calculated by equation (4), assuming rectangular distribution (divided by
3
).μ 0.06 0.034641 3
CAL mL (4)
The uncertainty due to temperature effect can be calculated from the estimation of temperature difference and the coefficient of the volume expansion. The temperature difference was estimated as ± 3 °C since the dissolving process was carried out at temperature 23 °C. Meanwhile, the volume expansion of the liquid (2.1 × 10⁻⁴°C-1 at 20°C, for water) is considerably greater than that flask (10 × 10-6°C-1 for borosilicate glass flask), so only the former needs to be considered. The standard uncertainty due to the temperature effect was calculated using the assumption of rectangular distribution for the temperature variation, in equation (5).
μ 50 3 2.1 10 /4 0.0182
3
o o
Temp
mL C C
mL
(5)
The two contributions of uncertainty, calibration and effect temperature, were combined to give the standard uncertainty µ(V) of the volume (V), in equation (6).
μ μ μ
μ
2 2
2 2
( ) ( ) ( )
( ) (0.034641) (0.018187) 0.0391
CAL Temp
V
V mL
Dilution Factor
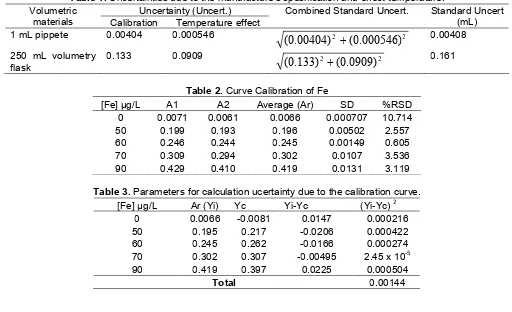
In order to fit the concentration of Fe of sample in working range analytical curve, the sample solution was diluted 250 times with dilute nitric acid in 250 mL volumetric flask. Contribution of uncertainty due to the variation within specification limits and temperature effect were determined and combined for each type of glassware (1 mL of pipette and 250 mL of volumetry flask). Table 1. is a summary of the calculation of uncertainties arising from the variation within specification limits and temperature effect.
There was an uncertainty associated with the initial and final volumes taken, so the dilution factor was associated with them. The uncertainty from the dilution factors, µ(Fd), were calculated as:
μ μ μ
μ μ
2 2
V1 V250
2 2
2 2
2 2
( ) ( ) ( )
250 1 250
(0.00408) (0.161) ( ) 250
1 250
( ) 1.032
d
d
d
F
F F
(7)
Concentration of Fe
The amount of Fe in sample is calculated using prepared calibration curve. For this purpose, five
calibration standards of Fe, with a concentration 0 µgL
-1
, 50 µgL-1, 60 µgL-1, 70 µgL-1, 90 µgL-1, were prepared from Fe stock solution 1000 ± 0.002 mgL-1. Five calibration standards were measured two times each by Atomic Absorption Spectrometry (AAS), providing the results in Table 2.
Average value of concentration of calibration standards each, Table 2, were submitted to a linear regression analysis to obtain the coefficient “a” and “b” in equation (8)
Y= bX + a (8)
And the results of linear square fit were coefficient “a” and “b”, respectively 0.0045 and -0.0081.
The uncertainty due to the calibration curve can be calculated from the absorbance value read by AAS instrument and the absorbance value obtained from the calculation using the regression linear equation, in equation (9).
-2 /
( )
( )
( 2) i C Y X
Y Y rsd S
n
(9)Where
Yi : Absorbance read from the AAS instrument Yc : Absorbance obtained from the calculation using
the regression linier equation
n : amount of concentration standard used for generating curve calibration
Table 1.Uncertainties due to the manufacture’s spesification and effect temperature. Uncertainty (Uncert.)
Volumetric
materials Calibration Temperature effect
Combined Standard Uncert. Standard Uncert (mL)
1 mL pippete 0.00404 0.000546 2 2
)
000546
.
0
(
)
00404
.
0
(
0.00408250 mL volumetry flask
0.133 0.0909 2 2
)
0909
.
0
(
)
133
.
0
(
0.161Table 2.Curve Calibration of Fe
[Fe] µg/L A1 A2 Average (Ar) SD %RSD
0 0.0071 0.0061 0.0066 0.000707 10.714
50 0.199 0.193 0.196 0.00502 2.557
60 0.246 0.244 0.245 0.00149 0.605
70 0.309 0.294 0.302 0.0107 3.536
90 0.429 0.410 0.419 0.0131 3.119
Table 3.Parameters for calculation ucertainty due to the calibration curve.
[Fe] µg/L Ar (Yi) Yc Yi-Yc (Yi-Yc)2
0 0.0066 -0.0081 0.0147 0.000216
50 0.195 0.217 -0.0206 0.000422
60 0.245 0.262 -0.0166 0.000274
70 0.302 0.307 -0.00495 2.45 x 10⁻⁵
90 0.419 0.397 0.0225 0.000504
The calculation of uncertainty due to the calibration curve was shown in the Table 3, and equation below.
-So the uncertainty of Fe concentration obtained by plotting to the calibration curve (Sx) was calculated by
dividing the uncertainty due to calibration curve with the slope “b” from the linear regression equation, in equation (11) and the uncertainty of Fe concentration, 4.87, was multiplied by 2 because Fe concentration in the sample recorded by instrument was subtracted with the concentration of blank, in equation (12).
μ
Method Validation Parameters
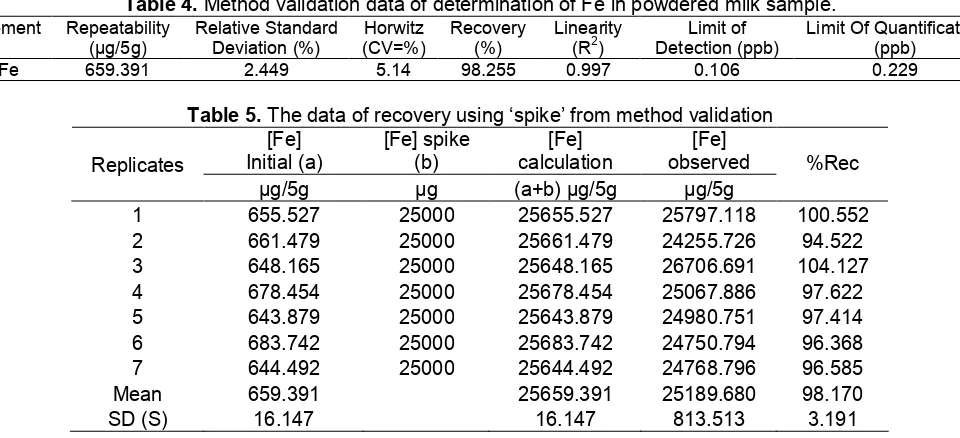
In order to assure the method which used for determination of Fe is valid and accurate, the method validation of determination of Fe using graphite furnace AAS and dry ashing preparation sample was carried out. The powdered milk was used as sample in method validation. The analytic parameters related to method validation consisted of limit of detection, limit of quantification, linearity, repeatability and recovery were investigated, as shown in Table 4.
Repeatability
Method validation showed a repeatability of the determination of Fe in powdered milk sample by graphite furnace AAS of 2.449% (as % rsd), as shown in Table 4. This value was used directly for the calculation of the combined uncertainty associated with the different
repeatability terms. The standard uncertainty of repeatability equals to the Relative Standard Deviation (RSD) of repeatability which was 0.02449 ng/g, equation (13).
Recovery is calculated as percentage of recovery from comparable reference material or representative spiking. In this measurement, bias was estimated by the recovery calculation through the addition of analyte to the sample (spike). The value of recovery was obtained from the validation method, as shown in Table 5.
When a ‘spike’ is used to estimate recovery, the recovery of the analyte from the sample may differ from the recovery of the spike so that an uncertainty needs to be evaluated. The standard uncertainty of recovery using ‘spike’ was calculated by the formula in equation (14).
OBS NATIVE SPIKE
S
Rec : Recovery from method validation
SOBS : standard deviation of concentration observed
(µg/5g)
SNATIVE : standard deviation of initial concentration of
sample (µg/5g)
COBS : concentration observed (µg/5g)
CNATIVE : initial concentration of sample (µg/5g)
CSPIKE : Spiking concentration of standard (µg)
Table 4.Method validation data of determination of Fe in powdered milk sample.
Element Repeatability
Limit Of Quantification (ppb)
Fe 659.391 2.449 5.14 98.255 0.997 0.106 0.229
Table 5.The data of recovery using ‘spike’ from method validation [Fe]
1 655.527 25000 25655.527 25797.118 100.552
2 661.479 25000 25661.479 24255.726 94.522
3 648.165 25000 25648.165 26706.691 104.127
4 678.454 25000 25678.454 25067.886 97.622
5 643.879 25000 25643.879 24980.751 97.414
6 683.742 25000 25683.742 24750.794 96.368
7 644.492 25000 25644.492 24768.796 96.585
Mean 659.391 25659.391 25189.680 98.170
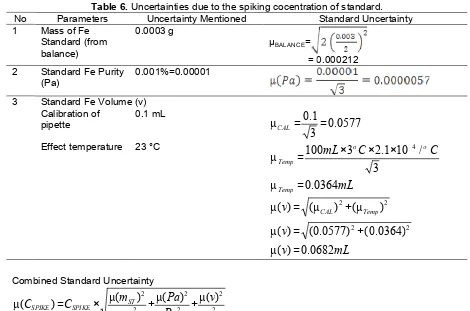
Table 6.Uncertainties due to the spiking cocentration of standard. No Parameters Uncertainty Mentioned Standard Uncertainty 1 Mass of Fe 2 Standard Fe Purity
(Pa)
0.001%=0.00001
Standard Fe Volume (v) Calibration of
Effect temperature 23 °C
mL
Combined Standard Uncertainty
g
The uncertainty due to the spiking concentration of standard (CSPIKE) was estimated by considering the
uncertainty of mass of Fe standard, the uncertainty of standard Fe purity, and the uncertainty of standard Fe volume, Table 6.
The standard uncertainty of recovery using ‘spike’ was calculated by submitting the values from the Table 5 and Table 6 into equation as follows.
μ
(Re ) 0.9817 0.012347
(25189.6 6 ) 25000
c
(15)
Combined Standard Uncertainty
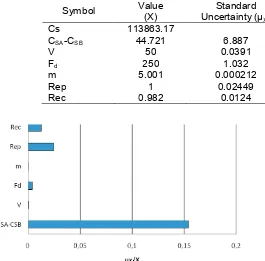
The value of parameters for calculation of Fe concentration in sample, equation (1), their standard uncertainties and their relative standard uncertainties were summarized in Table 7.
Using the values given in Table 7., the concentration of Fe in the sample can be calculated as follows.
69.32
44.721 50 250
113863.17 / 5 / 5
5.001 0.982
S
C ng g g g
(16)
For a multiplicative expression in equation (1) and equation (16), the combined standard uncertainties were used as follows
μ μ μ μ μ μ
( ) 113863.2 (0.154) (0.000783) (0.00413) (4.13 10 ) (0.025) (0.0126)
( ) 17819.78 /
Expanded Standard Uncertainty
Expanded Uncertainty of concentration Fe in sample, U(CS), was obtained by multiplying the
combined standard uncertainty by a coverage factor 2 (at confidence level 95%), in equation (18).
78.20
( S) 2 17819.78 / 35639.56 / 1 / 5
U C ng g ng g g g (18)
Table 7.Uncertainties in the Determination of Fe in powdered tonic food drink by graphite furnace AAS
Symbol Value
(X)
Standard Uncertainty (µX)
Relative Standard
Uncertainty (µX/X) Unit
Cs 113863.17 ng/g
CSA-CSB 44.721 6.887 0.154 µg/L
V 50 0.0391 0.000783 mL
Fd 250 1.032 0.00413 times
m 5.001 0.000212 4.242 x 10⁻⁵ g
Rep 1 0.02449 0.02449 (µREP/1)
Rec 0.982 0.0124 0.0126
Figure 3. Uncertainty contributions in the determination of Fe content in powdered tonic food drink sample
obtained by the calibration curve generated by AAS for determination of Fe concentration in the sample.
CONCLUSION
The Fe content in powdered tonic food drink sample analyzed by graphite furnace AAS was 569.32 µg/5g, with the expanded uncertainty measurement ± 178.20 µg/5g (coverage factor, k = 2, at confidence level 95%). The sources of uncertainty in the determination of Fe in sample by graphite furnace AAS were the uncertainties of concentration of Fe obtained by the graphite furnace AAS, the uncertainties of mass of sample, the uncertainties of dilution factor, the uncertainties of the volume of sample, the uncertainties of repeatability and the uncertainties of recovery. The uncertainty estimation of different sources in analysis Fe demonstrated that the calibration curve was the major contribution to the uncertainty of the final results.
ACKNOWLEDGEMENT
Authors would like to thanks to Eli Susilawati, Yenni Apriliany Devy for their support, the Food Nutrition Research Institute, Department of Science and
Technology, Philippines (FNRI-DOST) as Proficiency Testing Provider who prepared and distributed the sample, and Indonesian Institute of Sciences-Research Centre for Chemistry who facilitated and funded this project.
REFERENCES
1. Ellison, S.L.R., Rosslein, M., and Williams, A., 2000, EURACHEM/CITAC Guide CG 4, Quantifying Uncertainty in Analytical Measurement, Second Edition,
2. Singh, S., Arora, M., and Ramkishore, 2007, MAPAN-J. Metrology. Soc. of India, 22, 4, 263-268. 3. National Standard Method, Uncertainty of Measurement in Testing, Standards Unit, Evaluations and Standards Laboratory Centre for Infections, 2005
4. Kirkup, L., 2007, Calculating and Expressing Uncertainty in Measurement, University of Technology Sydney,.
5. Portugal, T.R., Udarbe, M.A., Rosales, J.D.C., Bisonaya, M.V., and Soliven, J.O., 2008, FNRI-DOST Proficiency Test Report No.02, Round 2 Powdered Tonic Food Drink: Proximates (Moisture, Fat, Protein, and Ash) and Minerals (Iron, Calcium, and Sodium), Food Nutrition Research Institue, Department of Science and Technology, Philippines.
6. Horwitz, W., 2000, Official Methods of Analysis of AOAC International: Food Composition, Additives, Natural Contaminants, 17th edition, vol 2, AOAC International, Maryland-USA
7. Chui, S.Q.H., 2007, J. Braz. Chem. Soc., 18, 2, 424-430.