P-ISSN.2503-0817, E-ISSN.2503-0825
CrossMark
Abstract
Objective: The purpose of this study is to evaluate the effect of three storage temperatures on microhardness of high- and low-viscosity bulk-fill materials and compare them with conventional resin-based composite materials.
Material and Methods: Six composite resin-based materials were used in this study (TN, TNB, TNF, FZ250, FB, and FBF), samples were subdivided into three groups based on the pre-curing storage temperature (5°C, 23°C, 37°C). Light polymerization for each material was performed based on the manufacturer’s recommendation using a Bluephase G2 curing unit (Ivoclar Vivadent, Schaan, Liechtenstein) in a high-intensity mode with an irradiance of 1200 mW/cm2. Vickers hardness values of the top and
the bottom surfaces of each sample were evaluated using a NOVA 130series, Vickers and Knoop hardness testing instrument under a 200-gram load and a dwell time of 10 seconds.
Results: When the tested materials were stored at room temperature (23°C) before testing in the present study, they failed to reach the minimum 80% of the mean bottom to top hardness value ratio except for FZ250 and FBF, where they reached 97.8% and 83.2% respectively.
Conclusion: Despite the promising results from this preliminary study, regarding improvement of microhardness with refrigerated composite resins, further research has to be conducted. The enhancement of hardness values associated with preheated composites could be beneficial in countries with warm climates, such as Saudi Arabia.
Keywords: Composite, Material, Hardness, Temperature
Cite this Article: Alomozainy M. 2018. Influence of storage temperature on vickers microhardness of resin composite.Journal of Dentomaxillofacial Science 3(2): 70-78. DOI: 10.15562/jdmfs.v3i2.736
Influence of storage temperature on
v
ickers
microhardness of resin composite
Mayyadah Alomozainy*
Introduction
Resin based composite materials have been used in dentistry for many years and they are considered a successful replacement of posterior amalgam restora-tions.1
Bulk-fill materials have been introduced to the market with an attempt to overcome some of the disadvantages of 2 mm incremental packing by being able to be placed as a bulk of 4mm thickness. Currently, two classes of bulk-fill materials are available in the market, viscous and flowable.2,3
Due to the simplified procedure of bulk-fill resin materials, more practitioners are interested in using them.4
The main advantages of bulk fill resin mate-rials are the increased depth of cure that could be related to their high translucency, low polymeriza-tion shrinkage stress as a result of modificapolymeriza-tions in the filler content and organic matrix with the help of advanced technology.5
Hardness, as well as flexural strength and modu-lus of elasticity, are all improved with increased filler volume in resin-based composite materials. Filler size and weight also affect different composite characteristics.6-9
Several studies reported improvement of mechanical properties of preheated composites as a result of increased rate of cure and a higher degree of conversion, although the effect of preheating could vary according to the brand of material.10,11
The high viscosity of packable composites would make marginal adaptation a critical issue, especially if heavily filled materials were used.10
The viscosity of resin-based composites is temperature depen-dent and directly related to the handling character-istics of the composite.12-14
Rheology studies indicated that resin compos-ites, being visco-elastic materials by nature, respond to an increase in external temperature, which results in the exponential decrease in their viscosity.14-16
As a result of decreased paste viscosity, free radicals and propagating polymer chains become more mobile and react to a greater extent, resulting in a complete polymerization reaction and greater cross-linking. The increase in polymerization may lead to improved mechanical properties and increased wear resistance.12,17,18 Also, preheated composites have a better surface hardness and greater depth of cure.19,20
The recent literature reported that by increasing the temperature of composite resins with high filler loading before polymerization, the flowability of the composite resin would be enhanced. Moreover, as a result of enhanced flowability the placement and adaptation of composites will be facilitated, thus increasing the durability of the restoration.21,22 King Saud University
*Corresponding to:
Mayyadah Alomozainy, King Saud University [email protected]
Although storing resin-based materials refriger-ated is a common practice to increase their shelf life as recommended by the manufacturers, few studies have investigated the effect of cooling of resin-based composites and their results were controversial. The degree of conversion is increased at a 60°C and decrease at 3°C.23
On the other hand Walter and his group reported that the pre-cooling of the composite resin might decrease the shrinkage.11 Other studies found no adverse effects from using materials directly from refrigerated storage.24,25 Lack of literature and the fact that manufacturers usually recommend keeping the composite syringes inside the refrigerator justifies the investigation in the present study on the effect of pre-cooling on the microhardness of the tested composite resins.
The purpose of this study is to evaluate the effect of three storage temperatures on microhard-ness of high and low viscosity bulk fill materials and compare them with conventional resin based composite materials. To evaluate the curing effi-ciency of various resin based composite materials in the present study, vickers hardness measurements were performed.26
Material and Methods
Four bulk-fill materials with different viscosi-ties (high and flowable) have been tested, while two nanohybrid composites materials served as control. The specimens were subdivided into three subgroups according to the storage temperature before their use, {subgroup 1= storage at room temperature 23° C, subgroup 2 = preheating temperature 37° C and subgroup 3 = precooling temperature 5° C}. Material specifications are presented in table 1.
Samples were prepared using a custom-made cylindrical mould with 5 mm diameter and 4 mm height for bulk-fill materials and 2 mm height for nanohybrid composites. Thick glass slap was used as a base for the mould and composite resins were backed as one increment. To ensure a smooth surface of the samples with no need for finishing and polishing, a myler strip and a glass slide were placed over the composite resins before curing. Light polymerization for each material was performed based on the manufacturer’s recommen-dation using a Bluephase G2 curing unit (Ivoclar Vivadent, Schaan, Liechtenstein) in a high-inten-sity mode with an irradiance of 1200 mW/cm2. The
distance between the light source and the material was constant throughout the experiment process as 1 mm, which represented the thickness of the glass slide. The samples were dry stored in a light proof
containers for 24 hours in an incubator at 37°C to complete the polymerization process before testing. To determine the microhardness of composite resin materials used in this study, vickers hardness values of the top and the bottom surfaces of each sample were evaluated using a NOVA 130series, Vickers and Knoop hardness testing instrument under a 200-gram load and a dwell time of 10 seconds. Three indentations with the random distance of 1 mm were taken from the top and the bottom surfaces of each sample and a mean vickers hardness (VHN) value was calculated (n=18 top and n=18 bottom). The microhardness was determined through measuring the diameters of indentation which was produced by the pyramidal square-base diamond indenter. The mean bottom/top ratio was calculated by dividing VHN of the bottom surface by VHN of the top surface.
Statistical analysis
Data was analyzed using SPSS version 21.0 (IBM Inc., Chicago, USA) statistical software. Descriptive statistics (mean and standard devia-tion) were used to describe the quantitative vari-able (measurement of the top, bottom and ratio) of microhardness of resin composite materials. Student’s paired t-test was used to compare between the mean values of top and bottom measurements of each of the six materials. One-way analysis of variance was used to compare the mean values in relation to the categorical variables (six types of materials and three levels of storage temperature), followed by Turkey’s multiple comparison test. General linear model was used to identify the effect of type of material and level of temperature on the top, bottom, and ratio measurements. A p-value of < 0.05 was used to report the statistical significance of results.
Results
The study has evaluated the effect of three levels of storage temperatures on the measurements (top, bottom and its ratio) of microhardness among the six types of materials which consists of high- and low-viscosity bulk-fill materials and conventional resin-based composite materials. For each mate-rial, 18 samples were prepared and these samples were tested at three levels of storage temperatures (23°C, 5°C and 37°C).
significant difference in the mean values where the mean values of top surface measurements are statistically significantly higher than the bottom surface measurements in all the six materials and at all the three levels of storage temperature table 2.
The comparison of the mean ratio of the bottom and top surface measurements among the six study materials (TN, TB, TBF, FZ250, FB and FBF) shows high statistically significant difference (F=67.342; p<0.0001). The pairwise comparison among the six materials shows the mean ratio values of the two materials; FZ250 and FB to be significantly higher than the three materials (TN, TB and TBF), whereas the mean ratio values of the three mate-rials (TN, TB and TBF) are significantly lower than the other four materials. Moreover, there is no significant difference between the mean ratio values of FBF material and the other two materials (FZ250 and FB) table 3.
The comparison of the mean ratio of the bottom and top surface measurements among the three levels of storage temperature (23°C, 5°C and 37°C) not considering the type of material, shows highly statistically significant difference (F=43.292, p<0.0001). The pairwise comparison among the three levels of temperature indicates that the mean ratio values are different with each other table 4.
There is no statistically significant difference in the mean values of topside measurements among bottom measurements, and its ratio, in each of the six materials (TN, TB,TBF, FZ250, FB and FBF ) across the three levels of storage temperatures (23°C, 5°C, and 37°C) and also the comparison of the mean values of the top and the bottom measure-ments and its ratio at each of the three storage temperatures (230C, 50C and 370C) among the six materials (TN, TB, TBF, FZ250, FB and FBF) shows highly statistically significant difference table 6.
The model with the top measurement values along with the six materials and three levels of storage temperatures shows high statistically significant difference (F=155222.26; p<0.001) and also the interaction of levels of storage temperature and type of material (F=5044.15; p<0.0001). This indicates that the topside measurement values are signifi-cantly changing across the type of material and the level of storage temperature. A similar pattern was observed with the bottom measurement values (F=154196.87, p<0.0001; F=3230.94, p<0.0001) and also with the ratio values (F = 4855.118, p < 0.0001;
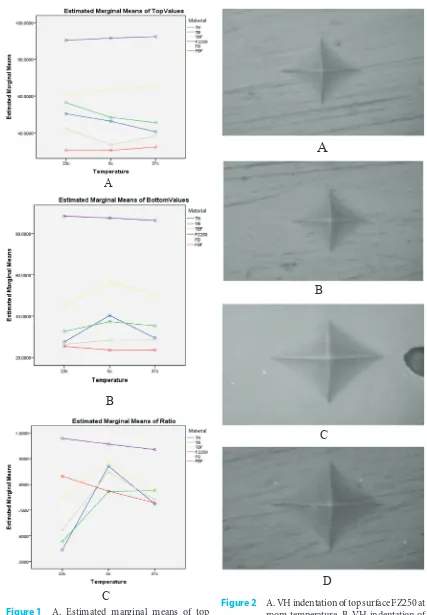
In the top surface measurement mean values, among the six materials, FZ250 has higher mean values and its value is higher at 37°C when compared with other two levels of storage temperature. In the bottom surface measurement mean values, FZ250 material has higher mean values and its value is higher at 23°C when compared with other two levels of storage temperature. Moreover, in the ratio measurement mean values, among the six materials, the FZ250 material has higher mean values and its value is higher at 23°C when compared with other two levels of storage temperature. After this material, in the ratio measurement of mean values similar pattern was observed in the FBF and FB materials, but the higher mean ratio values at 5°C with FB material and at 23°C with FBF material. For the other three materials (TN, TB and TBF), the ratio of mean values is higher at 5°C and 37°C storage temperatures when compared with the ratio of mean values at 23°C storage temperature.
Discussion
Hardness tests are the most frequently used method to evaluate the curing depth and the polymer cross-linking of dental composites27-32 as well as the polymer cross linking of dental composites.33,34 Additionally, the microhardness data for a specific material provides information on its wear, polishability and abrasive effect on antagonist's teeth.35 The Vickers microhardness test (VHN) has been commonly used to evaluate the hardness of dental materials, as it is usually used for brittle materials and small film thickness materials.
Hardness is often expressed in percentage; the surface hardness is always compared to 100%, which represents the maximum surface hardness. An acceptable curing depth is achieved if bottom hardness corresponds to at least 80% of the top surface hardness.36Experience has shown that the simple hardness measures (top and bottom) corre-spond well to the more thorough hardness profile measurements.37
Figure 1 A. Estimated marginal means of top surface, B. Estimated marginal means of bottom surface, C. Estimated marginal means of the ratio of bottom: top surfaces
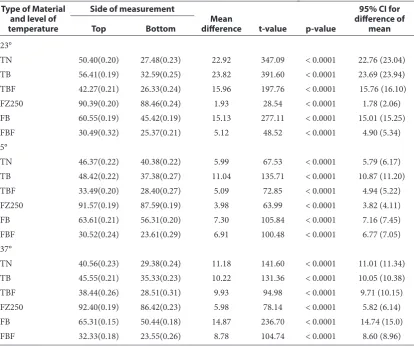
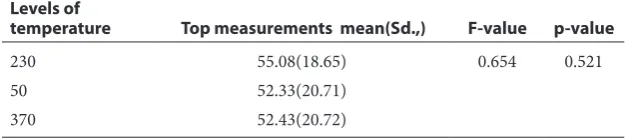
Figure 2 A. VH indentation of top surface FZ250 at room temperature, B. VH indentation of bottom surface FZ250 at room tempera-ture, C. VH indentation of top surface TN at room temperature, D. VH indentation of bottom surface TN at room temperature
A
B
C
D
C
B
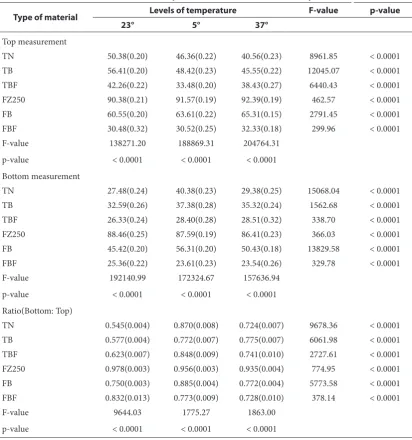
Table 2 Comparison between the mean values of top and bottom side measurements among the six study materials at three levels of temperature
Type of Material and level of temperature
Side of measurement
Mean
difference t-value p-value
95% CI for difference of
mean Top Bottom
23°
TN 50.40(0.20) 27.48(0.23) 22.92 347.09 < 0.0001 22.76 (23.04)
TB 56.41(0.19) 32.59(0.25) 23.82 391.60 < 0.0001 23.69 (23.94)
TBF 42.27(0.21) 26.33(0.24) 15.96 197.76 < 0.0001 15.76 (16.10)
FZ250 90.39(0.20) 88.46(0.24) 1.93 28.54 < 0.0001 1.78 (2.06)
FB 60.55(0.19) 45.42(0.19) 15.13 277.11 < 0.0001 15.01 (15.25)
FBF 30.49(0.32) 25.37(0.21) 5.12 48.52 < 0.0001 4.90 (5.34)
5°
TN 46.37(0.22) 40.38(0.22) 5.99 67.53 < 0.0001 5.79 (6.17)
TB 48.42(0.22) 37.38(0.27) 11.04 135.71 < 0.0001 10.87 (11.20)
TBF 33.49(0.20) 28.40(0.27) 5.09 72.85 < 0.0001 4.94 (5.22)
FZ250 91.57(0.19) 87.59(0.19) 3.98 63.99 < 0.0001 3.82 (4.11)
FB 63.61(0.21) 56.31(0.20) 7.30 105.84 < 0.0001 7.16 (7.45)
FBF 30.52(0.24) 23.61(0.29) 6.91 100.48 < 0.0001 6.77 (7.05)
37°
TN 40.56(0.23) 29.38(0.24) 11.18 141.60 < 0.0001 11.01 (11.34)
TB 45.55(0.21) 35.33(0.23) 10.22 131.36 < 0.0001 10.05 (10.38)
TBF 38.44(0.26) 28.51(0.31) 9.93 94.98 < 0.0001 9.71 (10.15)
FZ250 92.40(0.19) 86.42(0.23) 5.98 78.14 < 0.0001 5.82 (6.14)
FB 65.31(0.15) 50.44(0.18) 14.87 236.70 < 0.0001 14.74 (15.0)
FBF 32.33(0.18) 23.55(0.26) 8.78 104.74 < 0.0001 8.60 (8.96)
Table 1 Materials specifications
Material Resin Filler Photoinitiator Filler % Curing time Manufacturer
Filtek bulk-fill flowable composite (FBF)
BisGMA, BisEMA, Procry-lat, UDMA
Zirconia or silica, ytterbium trifluoride
Camphoroquinone 64.5 wt / 42.5 vol 20 sec 3M ESPE
Tetric N-Flow Bulk-fill (TBF)
monomethacrylates and dimethacrylates
barium glass, ytterbium trifluoride, and copolymers
Ivocerin 68.2 wt / 46.4 vol. 10 sec Ivoclar Vivadent
Tetric N-Ceram (TN) BisGMA, UDMA,
TEGDMA, EthoxylatedBis-EMA
Barium aluminium silicate glass, ytterbium trifluoride, mixed oxide, Prepolymer
80-81 wt / 55–57 vol 10 sec Ivoclar Vivadent
Tetric N-Ceram Bulk-fill (TB)
dimethacrylates barium glass, prepolymer, ytterbium trifluoride and mixed oxide
Ivocerin 75-77 wt / 53-55 vol 10 sec Ivoclar Vivadent
Filtek Bulk-fill posterior (FB)
AUDMA, UDMA and 1, 12-dodecane-DMA
Zirconia/silica, ytterbium trifluoride
Camphoroquinone 76.5 wt / 58.4 vol 20 sec 3M ESPE
Filtek Z250 (FZ250) BIS-GMA, UDMA,
Bis-EMA
These results are in agreement with a previous study where they showed that at room temperature only 50% to 75% conversion of monomers could be achieved.21,38 Low monomer conversion rate reduces the mechanical strength of restoration, and oxidation of unsaturated monomers may give rise to composite colour changes as well as allergic reactions. An increase in the degree of conver-sion improves surface hardness, flexural strength, modulus, fracture toughness, diametral tensile strength, and wear resistance.39
In the current study, the hardness values of the bottom surface of all tested materials at the differ-ent storage temperatures were lower than the hard-ness values of top surfaces. This can be related to the proximity of top surfaces to the light source and thus receiving higher energy density.40-43
Another explanation could be due to the insuffi-ciency of curing time that was recommended by the manufacturers and followed in this study. Where the tested samples which were cured for 10
seconds, failed to reach accepted hardness ratio.44 Others studies had also suggested increasing the polymerization time more than the manufacturers’ recommendation to improve the bulk fill materials performance especially the hardness value.29,45,46
If we look deeper to the result of the top and bottom hardness values for the materials that failed to reach the 80% hardness ratio at 23°C, we can observe an enhancement in the hardness values at the bottom surfaces of the samples at 5°C and 37°C.
The enhancement in the preheated samples high could be explained by the fact that temperature increase results in increased molecular mobility and thus; the postponement of diffusion, controlled propagation and reaction diffusion controlled termi-nation and auto deceleration, thereby allowing the system to reach higher limiting conversions before verification. Moreover, the temperature increase could result in higher cross linked polymer network or oligomeric network formation.12,17
Another explanation could be related to the effect of temperature increase in reducing the rate of the polymerization process before reaching the final degree of conversion; therefore less unreacted residual monomer remains free accordingly it leads better mechanical properties.29,47
Preheating of resin-based materials prior to their use, will lower their viscosity and help in the handling properties, this will lead to better adapta-tion to cavity walls.48
The results of the present study of the mean hardness ratio of bottom and top surface among the three levels of storage temperature (23°C, 5°C and 37°C) not considering the type of material, shows that the best hardness ratio was obtained with the refrigerated samples at 5°C (85.1%), which has a highly statistically significant difference from the other groups (F=43.292, p<0.0001). A possible justification for the improvement of hardness of refrigerated resin composites is that samples were less affected by the heat generated by the curing unit, generating less stress during its polymeriza-tion.29
These results suggest that the refrigera-tion allowed the composite resin to react similarly to the “soft start polymerization method” because, the low temperature could have proportioned less monomer mobility, decreasing the reaction velocity and providing an extension of the pre-gel phase without decreasing hardness values.49 Another study demonstrated that cooling before light-curing did not result in differences in hardness for the composite resins after polymer-ization. Also, it was observed that the pre-cooling of the composite resin might decrease the shrinkage.11
Table 3 Comparison of mean values of ratio of bottom: top measurements among the six study materials
Type of material Ratio (Bottom: Top) mean(Sd.,) F-value p-value
TN 0.714(0.13)ǂ 67.342 < 0.0001
TB 0.708(0.09)ǂ
TBF 0.737(0.09)ǂ
FZ250 0.956(0.02)*
FB 0.802(0.06)*
FBF 0.778(0.04)
*Significantly higher than other materials; ǂ Significantly lower than other materials
Table 4 Comparison of mean values of ratio of bottom: top measurements across the three temperature levels of observation
Levels of
temperature Ratio (Bottom: Top) mean(Sd.,) F-value p-value
230 0.718(0.15)* 43.292 < 0.0001*
50 0.851(0.06)*
370 0.779(0.07)*
*Significantly different from each other
Table 5 Comparison of mean values of top measurements across the three temperature levels of observation
Levels of
temperature Top measurements mean(Sd.,) F-value p-value
230 55.08(18.65) 0.654 0.521
50 52.33(20.71)
It was reported that surface hardness of composite resin material is influenced by resin matrix, filler type, filler loading and degree of conversion.50 The results of the current study reflect that where FZ250 has the highest filler content (60% vol.) exhibit the highest mean hardness ratio among all the tested materials at the different storage temperatures.
Conclusion
Within the limitations of this study, the associa-tion of precooled composite resin and the use of
the LED curing units could be recommended to improve resin based composite hardness.
The enhancement of hardness values associated with preheated composites could be beneficial in countries with warm climates, such as Saudi Arabia, where this study took place since manufacturers’ recommendations about storing conditions could be less strictly followed.
Preheating and precooling could affect the hardness of the resin composite materials, but it mainly depends on the type of composite resins used.
Table 6 Comparison of mean values of top, bottom and ratio of bottom: top measurements across the three levels of temperature in each of the six study materials
Type of material Levels of temperature F-value p-value
23° 5° 37°
Top measurement
TN 50.38(0.20) 46.36(0.22) 40.56(0.23) 8961.85 < 0.0001
TB 56.41(0.20) 48.42(0.23) 45.55(0.22) 12045.07 < 0.0001
TBF 42.26(0.22) 33.48(0.20) 38.43(0.27) 6440.43 < 0.0001
FZ250 90.38(0.21) 91.57(0.19) 92.39(0.19) 462.57 < 0.0001
FB 60.55(0.20) 63.61(0.22) 65.31(0.15) 2791.45 < 0.0001
FBF 30.48(0.32) 30.52(0.25) 32.33(0.18) 299.96 < 0.0001
F-value 138271.20 188869.31 204764.31
p-value < 0.0001 < 0.0001 < 0.0001
Bottom measurement
TN 27.48(0.24) 40.38(0.23) 29.38(0.25) 15068.04 < 0.0001
TB 32.59(0.26) 37.38(0.28) 35.32(0.24) 1562.68 < 0.0001
TBF 26.33(0.24) 28.40(0.28) 28.51(0.32) 338.70 < 0.0001
FZ250 88.46(0.25) 87.59(0.19) 86.41(0.23) 366.03 < 0.0001
FB 45.42(0.20) 56.31(0.20) 50.43(0.18) 13829.58 < 0.0001
FBF 25.36(0.22) 23.61(0.23) 23.54(0.26) 329.78 < 0.0001
F-value 192140.99 172324.67 157636.94
p-value < 0.0001 < 0.0001 < 0.0001
Ratio(Bottom: Top)
TN 0.545(0.004) 0.870(0.008) 0.724(0.007) 9678.36 < 0.0001
TB 0.577(0.004) 0.772(0.007) 0.775(0.007) 6061.98 < 0.0001
TBF 0.623(0.007) 0.848(0.009) 0.741(0.010) 2727.61 < 0.0001
FZ250 0.978(0.003) 0.956(0.003) 0.935(0.004) 774.95 < 0.0001
FB 0.750(0.003) 0.885(0.004) 0.772(0.004) 5773.58 < 0.0001
FBF 0.832(0.013) 0.773(0.009) 0.728(0.010) 378.14 < 0.0001
F-value 9644.03 1775.27 1863.00
Further research is needed to evaluate the influence of the storage temperature on the other mechanical properties.
Despite the promising results from this prelim-inary study, regarding improvement of microhard-ness with refrigerated composite resins, further research has to be conducted keeping the moulds at 37°C to simulate the intraoral conditions in a better manner.
Ac
knowledgment
The author would like to express the deepest appreciation to Professor Nahid Ashri, Depart-ment of Periodontics and Community Dentistry, College of Dentistry, King Saud University for her support in executing this study and her advice in writing the manuscript.
Conflict of Interest
The author has no conflicts of interest to declare.
References
1. Lazarchik DA. Hardness comparison of bulk-filled/trans-tooth and incremental-filled/occlusally irradiated composite resins. J Prosthet Dent 2007;98: 129-40.
2. Burgess J, Cakir D. Comparative properties of low-shrinkage composite resins. Compend Contin Educ Dent 2010;2: 10-15.
3. Ilie N, Hickel R. Investigations on a methacrylate-based flowable composite based on the SDR technology. Dent Mater 2011;27: 348-355.
4. Ilie N, Kessler A, Durner J. Influence of various irradia-tion processes on the mechanical properties and polymer-isation kinetics of bulk-fill resin based composites. J Dent 2013;41: 695-702.
5. Leprince JG. Physico-mechanical characteristics of commercially available bulk-fill composites. J Dent 2014;42: 993-1000.
6. Scougall-Vilchis RJ. Examination of composite resins with electron microscopy, microhardness tester and energy dispersive x-ray microanalyzer. Dent Mater J 2009;28: 102-112.
7. Faltermeier A. Influence of filler level on the bond strength of orthodontic adhesives Angle Orthod 2007;77: 494-498. 8. Czasch P, Ilie N. In vitro comparison of mechanical
properties and degree of cure of bulk-fill composites. Clin Oral Investig 2013;17: 227-235.
9. Bucuta S, Ilie N. Light transmittance and micro-mechanical properties of bulk-fill vs. conventional resin based composites. Clin Oral Investig 2014;18: 1991-2000. 10. Uctasli MB. Effect of preheating on the mechanical properties
of resin composites. Eur J Dent 2008;2: 263-268.
11. Walter R. Effects of temperature on composite resin shrinkage. Quintessence Int 2009;40: 843-847.
12. Daronch MFA, Rueggeberg, De Goes MF. Monomer composites according to variations in monomer and filler composition. Dent Mater 2006;22: 515-526.
15. Mjor IA, Gordan VV. Failure, repair, refurbishing and longevity of restorations. Oper Dent 2002;27: 528-534. 16. Daronch M. Polymerization kinetics of pre-heated
composite. J Dent Res 2006;85: 38-43.
17. Bagis YH, Rueggeberg FA. Effect of post-cure temperature and heat duration on monomer conversion of photo-activated dental resin composite. Dent Mater 1997;13: 228-232.
18. Lucey S. Effect of pre-heating on the viscosity and microhardness of a resin composite. J Oral Rehabil 2010;37: 278-282.
19. Muñoz C. Effect of pre-heating on depth of cure and surface hardness of light-polymerized resin composites. Am J Dent 2008;21: 215-222.
20. Deb S. Pre-warming of dental composites. Dent Mater 2011;27: e51-59.
21. Osternack FH. Effects of preheating and precooling on the hardness and shrinkage of a composite resin cured with QTH and LED. Oper Dent 2013;38: E1-8.
22. Daronch M. Clinically relevant issues related to preheating composites. J Esthet Restor Dent 2006;18: 340-350. 23. Bausch JR, de Lange C, Davidson CL. The influence of
temperature on some physical properties of dental composites. J Oral Rehabil 1981;8: 309-317.
24. Hagge SM. Effect of refrigeration on shear bond strength of three dentin bonding systems. American J Dent 1999: 131-133.
25. Flury S. Depth of cure of resin composites: is the ISO 4049 method suitable for bulk-fill materials?. Dent Mater 2012;28: 521-528.
26. Poggio C. Evaluation of Vickers hardness and depth of cure of six composite resins photo-activated with different polymerization modes. J Cons Dent 2012;15: 237-241. 27. Torres CRG. Influence of concentration and activation
on hydrogen peroxide diffusion through dental tissues in vitro. Sci World J 2013: 5.
28. Osternack FH. Impact of refrigeration on the surface hardness of hybrid and microfilled composite resins. Braz Dent J 2009;20: 42-47.
29. DeWald JP, Ferracane JL. A comparison of four modes of evaluating depth of cure of light-activated composites. J Dent Res 1987;66: 727-730.
30. Ferracane JL. Developing a more complete understanding of stresses produced in dental composites during polymer-ization. Dent Mater 2005;21: 36-42.
31. Bouschlicher MR, Rueggeberg FA, Wilson BM. Correlation of bottom-to-top surface microhardness and conversion ratios for a variety of resin composite compositions. Oper Dent 2004;29: 698-704.
32. Cenci MS. Relationship between gap size and dentine secondary caries formation assessed in a microcosm biofilm model. Caries Res 2009;43: 97-102.
33. Fróes-Salgado NR. Composite pre-heating: effects on mar-ginal adaptation, degree of conversion and mechanical properties. Dent Mater 2010;26: 908-914.
34. Marovic D. Degree of conversion and microhardness of dental composite resin materials. J Mol Struct 2012;1044: 299-304.
35. Watts DC, Amer O, Combe EC. Characteristics of visible-light-activated composite systems. Br Dent J 1984;156: 209-15.
36. Pilo R, Cardash HS. Post-irradiation polymerization of different anterior and posterior visible light-activated resin composites. Dent Mater 1992;8: 299-304.
37. Ayub KV. Effect of preheating on microhardness and viscosity of 4 resin composites. J Can Dent Assoc 2014;80: e12. 38. Prasanna N. Degree of conversion and residual stress of
preheated and room-temperature composites. Indian J Dent Res 2007;18: 173-176.
39. Feng L, Carvalho R, Suh B. Insufficient cure under the condition of high irradiance and short irradiation time. Dent Mater 2009;25: 283-289.
41. Soh MS, Yap AU, Siow KS. The effectiveness of cure of LED and halogen curing lights at varying cavity depths. Oper Dent 2003;28: 707-15.
42. Lindberg A, Peutzfeldt A, Van-Dijken JW. Effect of power density of curing unit, exposure duration, and light guide distance on composite depth of cure. Clin Oral Investig 2005;9: 71-76.
43. Maghfiroh H, Nugroho R, Probosari N. The effect of carbonated beverage to the discoloration of polished and unpolished nanohybrid composite resin. J Dentomaxillofac Sci 2016;1: 16-19.
44. Zorzin J. Bulk-fill resin composites: polymerization properties and extended light curing. Dent Mater 2015;31: 293-301.
45. Cohen ME. Statistical estimation of resin composite polymerization sufficiency using microhardness. Dent Mater 2004;20: 158-166.
46. Jim M, Kim S. effect of pre-heating on some physical properties of composite resin. J Korean Acad Conserv Dent 2009;34: 30-37.
47. Trujillo M, Stansbury JW. Thermal effects on composite photopolymerization monitored by realtime NIR. J Dent Res 2003: 82.
48. Dall'Magro E. Effect of different photoactivation techniques on the bond strength of a dental composite. Braz Dent J 2007;21: 220-224.
49. Galvao MR. Evaluation of degree of conversion and hardness of dental composites photo-activated with different light guide tips. Euro J Dent 2013;7: 86-93.