Abstract
I
nformation technology is deemeda necessity for an organization to compete in today’s competitive world. Thus, organizations seek to use the most cost effective tools in infor-mation systems. The use of informa-tion systems, which Whitten et al. (2001) defined as “an arrangement of people, data, processes, communi-cations, and information technology that interact to support and improve day-to-day operations in a business, as well as support the problem-solving and decision-making needs of man-agement and users,” is considered as one of the options for cost a effective solution. The open source software would be such an option for managers
to consider when deciding the tools to be invested in.
Studies have shown that the implemen-tation of OSS can save cost and that the transition and migration from one plat-form to another requires significant in -vestments as it involves training, data migration as well as hardware cost (Morgan and Finnegan, 2007; Ven and Verelst, 2006). The study by Hauge et al. (2010)study showed “the complete
calculations of the true costs and sav-ings of (1) introducing OSS products into organizations, and (2) keeping the OSS products operational over a long-er plong-eriod of time” wlong-ere considlong-ered the challenges to the organizations.
Noor Ismawati Jaafar
University of Malaya [email protected]
Sharifah Fazlinda Sheikh Yahya
University of Malaya [email protected]
InnOVaTIOn In OrganIzaTIOnS
a Managerial perspective on Its adoption
This study identifies the factors that have a direct effect on a manager’s decision towards Open Source System (OSS) enterprise system adoption in Malaysia. Using the Technology-Organization-Environment (TOE) framework, the research is initiated by inviting the managers in Malaysian or-ganizations who implemented OSS. A survey was conducted via online OSS social communities and by sending emails to shortlisted public. A total of 124 managers from 124 organizations responded to the survey and the results showed that four out of six factors were found significant in this study. In the technological context, ‘perceived relative advantage’, ‘perceived compatibility and trialability’ and ‘perceived complexity’ factors were found significant in the OSS adoption. In the organizational context, ‘management support, knowledge and expertise’ was identified as the adoption factor. Two factors in the environmental context that was not supported were the ‘technology skills and services’ and ‘platform long term viability’ although previous studies suggested otherwise.
What is the level of adoption of OSS enterprise systems? (2) What are the significant factors that influence a manager’s adoption of OSS enterprise systems in organizations?
Literature review
Open Source Software (OSS)
Coppola and Neelley (2004) defines OSS as “software programs that are distributed with the source code which allows users the freedom to run the program for any purpose, to study and modify the program, and to free-ly redistribute copies of the original or modified program”. The improve -ments of the OSS are being contrib-uted mainly by users or usually in a community who have fixed the prob -lems or added new features to it. Sev-eral success stories show that a huge number of people worldwide using Apache, Linux, Firefox and mySQL (chamili et al., 2012).
The OSS may appear to be software that is cost free but it also gives an op-portunity for business, where the users may use the system as needed or the users may offer it as a service to oth-ers. This means, the software can be commercialized (coppola and neel-ley, 2004) by offering services such as implementation, training, and support; packaging and integrating open source software to make its installation and use easier for a wider market; and cre-ating complementary, add-on, or en-hanced software for sale
The distribution of the modified soft-ware must also be the same as the original software. The license may restrict the modified software from being distributed only if the enhance-a survey conducted by the Open
Source competency center Malaysia in July, 2009 shows that more than 70% of Malaysian government offices were running on open source software (OSS adoption Statistics Malaysian public Sector Open Source Software programme, 2010).This value in-creased in the year 2010 where 97% of the adoption rate was reported in the public sector (Open Source compe-tency center (OScc) Laporan adop-tion chart Tahun 2011, 2012). Look-ing at this statistic, it is can be fairly said that the implementation of the OSS in Malaysia is increasing. at pre-sent, there is still lack of studies about the OSS enterprise systems adoption, especially in Malaysia. Hence, this study will be valuable to organizations as it evaluates on the factors determin-ing the adoption of OSS.
This study will explore the adoption of the OSS enterprise systems through sets of technological, organizational and environmental factors by man-agers in organizations. It would also be beneficial for the organizations to know the factors that contribute to the adoption of OSS besides the benefits of free software. This study is also ex-pected to reinforce the factors of pre-vious studies as well as to offer more perspectives of organizations on the adoption of OSS enterprise systems.
Diffusion of Innovation (DOI) has be-come the basis for current adoption theory studies (rogers, 1962). rogers’ works elaborate on the concept of in-novation and the factors that affect the innovation’s adoption rate. His model outlines five stages of the adoption process; (1) knowledge of the innova-tion, (2) persuasion by influencing fac -tors or entities, (3) a decision to adopt, (4) implementation of the innovation; and (5) confirmation of the decision to adopt. rogers’ (2003) Diffusion of In-novation theory lists five characteris -tics of innovations. relative advantage is the degree to which an innovation is perceived as better than the idea, which it supersedes. compatibility is the degree to which an innovation fits with the existing values, past ex -perience, and needs of the potential adopter. Complexity is the degree to which an innovation is perceived as difficult to understand and use. Trial -ability is whether an innovation may be experimented with on a limited basis. Observability is the degree to which the results of an innovation are visible to others. rogers’ framework has some limitation when applied to organizational innovations. It focuses on the diffusion of mass-produced items which is through individuals in the population (chau and Tam, 1997). Therefore, a more relevant model is needed to take into account the factors that can affect the propensity of adop-tion within the specific context of the technological, organizational and the environmental circumstances.
Technology-organization-environ-ment (TOE) framework
In their study of technological innova-tion adopinnova-tion, Tornatzky and Fleischer (1990)developed the technology-orga-ment is through ‘patch files’ to ensure
the integrity of the author’s source code. The distribution of the modified OSS should not discriminate against persons or groups of persons, use of program in a specified field or endeav -our, and redistribution of the OSS with the same rights. The license too must not be specific to a product or restrict other software and it must be technol-ogy-neutral.
Over the years, the revenue from OSS has increased as reported in the World-wide Open Source Software 2009-2012 Forecast (IDc, 2008). In the same re-port, it was revealed that worldwide revenue from OSS will grow at a 22.4% compound annual growth rate (cagr) to reach $8.1 billion by 2013. This growth is expected due to the cur -rent economic crisis.
Diffusion of innovation (DOI)
er, was not seen as relevant (Morgan and Finnegan, 2010).
The organizational context
The organizational component de-scribes the resources available in the organization to support the technolo-gies. Rogers (2003)has identified that the organizational characteristic such as formalization, centralization, sys-tem openness, interconnectedness, or-ganizational slack and size are related to the adoption of innovation. Open source adoption is perceived as an oc-casion for rapidly developing effective new business applications, even in the context of shrinking IT resources and a poor relationship between IT and the rest of the organization. IT man-agement and staff see the potential to improve their strained relationship with users, and improve their image of themselves as product developers and explorers (Allen andGeller, 2012).
The organizational factors are often cited by previous studies as factors be-hind the managerial decision to adopt the OSS (goode, 2005; Morgan and Finnegan, 2010; Varian and Shapiro, 2003). Factors such as management support and the internal knowledge and expertise are also identified as the important factor in considering the adoption of the OSS (glynn et al., 2005; goode, 2005; Morgan and Finnegan, 2010). It was found that re-sources, competences, and knowledge can themselves be a source of innova-tion. This means that in some cases the competences serve the need of simply importing external sources within the firm (Di Stefano, Gambardella and Verona, 2012).The lack of internal knowledge and expertise would im -pede a decision to work with the open nization-environment (TOe)
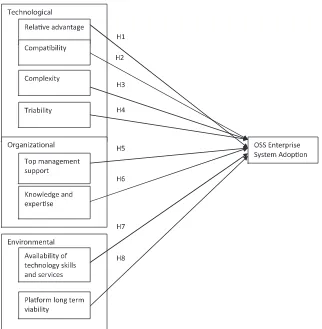
frame-work. This framework allowed the structure of various adoption factors from different contexts into a coherent framework (Ven and Verelst, 2012). The three contexts described here which would influence the adoption decision are the technological con-text, the organizational context and the environmental context. A num -ber of literatures have analyzed and used the TOe framework as a foun-dation for the adoption of OSS in an organization(chau and Tam, 1997; De-drick and West, 2003, 2004; ellis and Belle, 2009; Morgan and Finnegan, 2007, 2010; Ven and Verelst, 2006, 2012).
The technology context
howev-represents the constraints and oppor-tunity for the technologies adopted. Rogers (1993) also identified adopter characteristics as the environmental attributes. Factors such as the avail-ability of external supports and skills, avoidance of vendor lock-in are often cited (Dedrick and West, 2004; goode, 2005; Morgan and Finnegan, 2007). The lack of those factors and owner-ship are among the drawbacks – which encourage the companies to search for available skills and support. This differs with the proprietary software where there is a legal comfort from a signed guaranteed maintenance con-tract signed. after much deliberation on the related literatures and previous studies done by other researchers, a proposed framework for the study is illustrated in Figure 1.
source software. another factor to consider is the IT innovativeness, i.e., where the adoption of the new tech-nology is based on the timing of when it is adopted into the organization (el-lis and Belle, 2009). In this study, we will focus on the management support and the internal knowledge and exper -tise factors.
Environment context
The environmental component is the platform the organization to conducts its business. The environmental com-ponents of the organization include the industry in which the business is conducted, its competitors, and the regulations affecting the organi-zation and its relationship with the government(chau and Tam, 1997). It
jor factor as mentioned in Dedrick and West’s study. The respondents prefer the platform with the largest variety of applications. Skill sets of the IT staff in the organization also plays as a deter-minant role in the adoption as it would ensure a smooth and manageable adap-tation of the new technology(Dedrick and West, 2004). Therefore, in this study the aspects of technology and skills are explored to see whether they could influence the adoption. Thus, we reflect on the second hypothesis:
H2: Perceived higher compatibility of OSS is positively related to the adoption of OSS.
Complexity is the level to which an innovation is perceived as difficult to understand and use (rogers, 2003). Lack of the IT skills as well as knowl-edge on OSS would be a resulted in complexity issue causing it to be a technical drawback(ellis and Belle, 2009; Morgan and Finnegan, 2007). The organization will find it difficult to find the right expertise and to develop the right skills (Morgan and Finnegan, 2007). It would be a high investment for the organization to train the exist -ing resources and thus this becomes a barrier in adopting the software. Hy-pothesis 3 is then developed as below:
H3:Perceived complexity of OSS is negatively affecting the adoption of OSS.
Trialability can be defined as the abil -ity to try out the software at a very low cost as it could be downloaded for free from various sources or run on the existing hardware(DedrickandWest, 2004). as supported by rogers (2003), the organization would be more likely to adopt the OSS in which the
inno-researcH MetHod
Development of hypotheses
Based on the literature review and pri-or studies, hypotheses were developed for the study.Rogers (2003)defines rel -ative advantage as the degree to which innovation is perceived as better than the idea it supersedes. a number of rigorous studies (Dedrick and West, 2003, 2004; Morgan and Finnegan, 2007, 2010) also indicate that relative advantage is one of the factors that influence the decision in the adoption decision. Dedrick and West (2003)in their study of Linux adoption states that the relative advantage of OSS as compared to proprietary systems is perceived in terms of cost and reliabil-ity. cost consists of the hardware and software cost which were deemed as important relative to the advantage of OSS. Switching cost for the labor and human to adopt the new technology which includes the cost of training and evaluation depend largely on the avail-ability of IT skills in the organization (Dedrick and West, 2003). Therefore, Hypothesis 1 reflects the relationship described here:
H1: Perceived higher relative advan-tage of OSS is positively affecting the adoption of OSS.
ma-adopt OSS. The Hypothesis 6 is de-rived as below:
H6: Higher knowledge and expertise of OSS is positively related to the adoption of OSS.
In the context of external environ -ment, most literatures stressed the importance of the availability of ex -ternal support and services and also the lack of it would be the reason for certain management rejections as well as business drawbacks (goode, 2005; Morgan and Finnegan, 2007). OSS us-ers have to rely on the collaborative support from the online community, whose services are not guaranteed to be available (Dedrick and West, 2003). This affects large corporations who have the necessary resources to pay for formal support agreements and has less of an effect on small businesses that often rely on in-house skills and community support. Vendor lock-in was also often being cited as one of the difficulties to extend the use of the software (Dedrick and West, 2003; Miralles et al.,2005; Ven and Verelst, 2012). The following hypothesis can therefore be established:
H7: Higher availability of technologi-cal skills and services is positively related to the adoption of OSS.
It is an important factor to ensure that the OSS product is viable for a long term. Many organizations prefer plat-forms which are perceived to be the winning standard (Dedrick and West, 2003). Broadly accepted technology standards will have a greater invest-ment as well as vendor support. This is also supported by most of the OSS adoption studies (chau and Tam, 1997; Dedrick and West, 2003) where high vation can be tried and assimilated in
small chunks over time. It is then pro-posed that hypothesis 4 is to be con-structed as below:
H4:Perceived trialability of OSS is positively related to the adoption of OSS.
according to glynn et al. (2005), in OSS development, it is critical for the support from the top management as this contravenes the traditional model where support is legally guaranteed by a vendor. Morgan and Finnegan (2007) in their study also revealed the necessity of having top management support for OSS adoption. Both the benefits and drawbacks of an OSS in -fluenced the decision to adopt OSS in organizations. Hence, Hypothesis 5 is derived as:
H5: Greater top management support of OSS is positively affecting the adoption of OSS.
IT managers who were involved in decision making of adopting the OSS systems. Designation of the IT manag-ers and non IT managmanag-ers for the target population may include IT Manager, Team leader, project manager and middle management.
Data Collection Procedure
This study used quantitative survey to collect the primary data using a struc-tured, closed item questionnaire. The questionnaire was divided into four sections; Section a - to collect the re-spondents’ demographics data includ-ing gender, age, education level and current role in the organization. Sec-tion B -to collect respondents’ organi-zation’s profile such as the organiza -tion name, the type of industry, size of the company and also what are the OSS system used in the company. Sec-tion c – to collect data on the wheth-er or not the organization adopt OSS and measured the impact of the OSS on business performance and busi-ness process. Section D – to collect the OSS determinants factors based on the hypotheses developed for this study.
The measurements of Section c and Section D were using the seven-point Likert scale, where a ‘seven point’ score meant that the item was the most agreeable and a ‘one point’ score meant that it was the most disagree-able item. In the data collection phase, the survey was made available to both public and private organizations. The mode of data collection is via an on-line survey. The questionnaires were updated to the online survey and its urL was sent to each of the respond-ent via online OSS communities and to the shortlisted public organizations derived from the 2012 OSS Initiative perceived performance for
multiven-dor standards would be a characteristic of the open systems innovation. Based on this, hypothesis 8 is proposed as be-low:
H8: Greater platform long-term vi-ability is positively affecting the adoption of OSS.
Development of questionnaires
a questionnaire was developed and designed to measure the perceptions on each of the hypotheses that have been developed. Questionnaire survey has been commonly used in previous organizational technological innova-tion adopinnova-tion (chau and Tam, 1997). The development of the questionnaire is based on the measurements ad-opted from previous studies that used Tornatzky and Fleischer (1990) TOe model. The measurements of the vari-ables is an essential part of research and a significant aspect of quantitative research design (cavana et al.,2001). The following sections will discuss in detail on measurement of variables.
Measurement of Scales
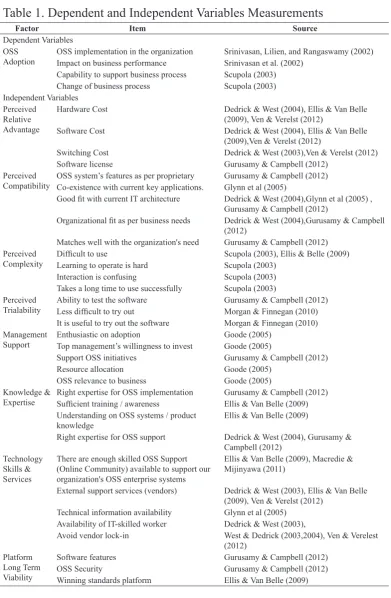
The dependent variable and independ-ent variables that were used to test the validity of the hypotheses are summa-rized and categosumma-rized in Table 1. In-struments of these variables are taken from prior researches. However, the items for each of the constructs in the variables were being rephrased to re-flect the OSS implementation.
Sampling Design
other online OSS community forum. The administrator of the page also promoted the posting to attract the par-ticipation of the survey. The question-naire contained a cover letter and the reports by MaMpu (2005).
Selec-tion of the designaSelec-tions are IT officers and above. request to participate the online survey was being posted in the OSDc.my Facebook page as well as
Table 1. Dependent and Independent Variables Measurements
Factor item source
Dependent Variables OSS
adoption
OSS implementation in the organization Srinivasan, Lilien, and rangaswamy (2002) Impact on business performance Srinivasan et al. (2002)
capability to support business process Scupola (2003) change of business process Scupola (2003) Independent Variables
perceived relative advantage
Hardware cost Dedrick & West (2004), ellis & Van Belle (2009), Ven & Verelst (2012)
Software cost Dedrick & West (2004), ellis & Van Belle (2009),Ven & Verelst (2012)
Switching cost Dedrick & West (2003),Ven & Verelst (2012) Software license gurusamy & campbell (2012)
perceived compatibility
OSS system’s features as per proprietary gurusamy & campbell (2012) Co-existence with current key applications. glynn et al (2005)
Good fit with current IT architecture Dedrick & West (2004),glynn et al (2005) , gurusamy & campbell (2012)
Organizational fit as per business needs Dedrick & West (2004),gurusamy & campbell (2012)
Matches well with the organization's need gurusamy & campbell (2012) perceived
Complexity Difficult to useLearning to operate is hard Scupola (2003), ellis & Belle (2009) Scupola (2003) Interaction is confusing Scupola (2003)
Takes a long time to use successfully Scupola (2003) perceived
Trialability
ability to test the software gurusamy & campbell (2012) Less difficult to try out Morgan & Finnegan (2010) It is useful to try out the software Morgan & Finnegan (2010) Management
Support
enthusiastic on adoption goode (2005) Top management’s willingness to invest goode (2005)
Support OSS initiatives gurusamy & campbell (2012) resource allocation goode (2005)
OSS relevance to business goode (2005) Knowledge &
Expertise Right expertise for OSS implementationSufficient training / awareness gurusamy & campbell (2012)ellis & Van Belle (2009) Understanding on OSS systems / product
knowledge
ellis & Van Belle (2009)
Right expertise for OSS support Dedrick & West (2004), gurusamy & campbell (2012)
Technology Skills & Services
There are enough skilled OSS Support (Online community) available to support our organization's OSS enterprise systems
ellis & Van Belle (2009), Macredie & Mijinyawa (2011)
External support services (vendors) Dedrick & West (2003), ellis & Van Belle (2009), Ven & Verelst (2012)
Technical information availability glynn et al (2005) availability of IT-skilled worker Dedrick & West (2003),
avoid vendor lock-in West & Dedrick (2003,2004), Ven & Verelest (2012)
platform Long Term Viability
a negative correlation has coefficient of -1.0 (coakeset al., 2010).
Multiple Regression Analysis
regression analysis is used in a situa-tion where one independent variable is hypothesized to affect one dependent variable (Sekaran and Bougie, 2010). Simple regression uses a single pre-dictor of the dependent variable and multiple regression uses two or more predictors of the dependent variable (Field, 2009). There are three major regression models: standard or simul-taneous, hierarchical and stepwise re-gression. In standard or simultaneous method, the independent variables are entered in the equation all at once to examine the relationship between the whole set of predictors and the depen-dent variable. In the hierarchical mul-tiple regression, the determinants of the order of independent variable en-try is based on theoretical knowledge (coakes et al., 2010).
resuLt and discussion
Descriptive Statistic
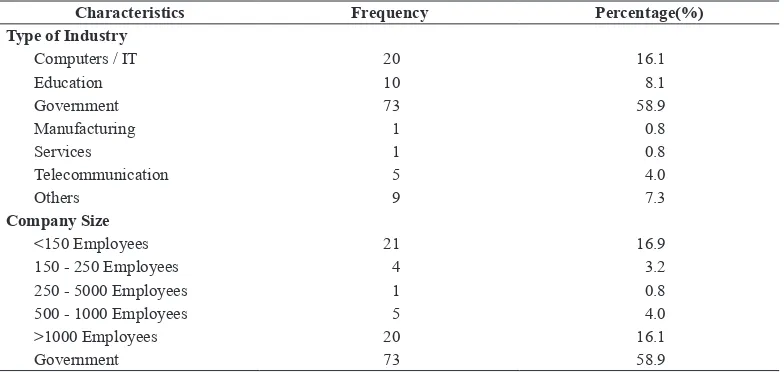
The highest figure for the industry type of the organization is the government sector (59%) followed by16% from the computer / IT sector, 8% from the education industry, 4% are from the telecommunication industry and the remaining7.3% from other industries. The rest of it is well distributed in the manufacturing and services industries. For the company size other than gov-ernment sector, 17% have less than 150 employees, about 16% of the compa-nies have more than 1000 employees, 3.2% have 150 – 250 employees, 0.8% have 250 – 500 employees and the rest have about 500 – 1000 employees.The results are shown in Table 2.
questionnaire form. The cover letter explained the purpose and objective of the survey. The respondents were assured of the confidentiality of their responses. It was requested that the survey was being completed within a week from the date the respondent re-ceived the questionnaire.
Descriptive Data Analysis
Descriptive statistics were used to ana-lyze the demographic profile of the re -spondents and the mean for each of the factors. To measure the dispersion of the interval scale, variance and stand-ard deviation was being used (Sekaran and Bougie, 2010).
Reliability Analysis
zikmund et al. (2012) defined reliabil -ity as “the degree to which measures are free from random error and there-fore yield consistent results”. cron-bach’s alpha is an adequate test of in-ternal consistency reliability in most cases (Sekaran and Bougie, 2010). The cronbach’s alpha indicates how highly the items in the questionnaire are interrelated in order to determine the instrument’s reliability.
Correlation Analysis
tend to agree that the ability to test out the open source system for free and the usefulness of the OSS were among the reason for the adoption of the OSS. The results also indicate that by im-plementing OSS, it provides relative advantage to the organization. This is shown by having a mean of 4.65 out of 7. Therefore, based on overall results of descriptive statistics, the respond-ents indicate that the OSS implemen-tation is not complex, easy to be used and learn as well as a shorter time for the OSS to be implemented success-fully is shown in the perceived trial-ability.
In the organizational context, the mean response to this was positioned ‘slight-ly agree’ on interval of the agreement scale (mean~ 4.6). This is reflected in The survey also requested the
re-spondent to indicate the OSS system implemented. The results are shown in Table 3. about 80% of the respondents implemented OSS for their operating system and database.another highly-implemented system is in enterprise portals where the percentage of imple-mentation is about 38.7%. Implemen-tation of OSS in accounting/financial and human resource recorded about 11.3% and 14.5% respectively whilst manufacturing recorded the lowest with 3% implementation.
Table 4 summarizes the descriptive statistic of independent and depend-ent variables. In the technology con-text, perceived trialability recorded the highest means of 5.26 out of 7. This shows that on average, the respondents
Table 2. Demographic Profile of the Companies
characteristics Frequency Percentage(%)
type of industry
Computers / IT 20 16.1
education 10 8.1
government 73 58.9
Manufacturing 1 0.8
Services 1 0.8
Telecommunication 5 4.0
Others 9 7.3
company size
<150 employees 21 16.9
150 - 250 employees 4 3.2
250 - 5000 employees 1 0.8
500 - 1000 employees 5 4.0
>1000 employees 20 16.1
government 73 58.9
Table 3. OSS System Implementation
Frequency Percent*
Operating System 99 79.8%
Database 98 79.0%
Manufacturing 4 3.2%
Accounting / Financial 14 11.3%
Marketing / Sales 10 8.1%
Human resource 18 14.5%
enterprise portals 48 38.7%
Others 31 25.0%
ond highest mean of 5.09. The results showed that on average, the factors of adopting the OSS are based on the fea-tures of the software, whether or not the solution is viable in the long term. The respondents ‘moderately’ agree that there are enough IT skilled work-ers, availability of online community support as well as external support ser -vices by the vendors. Overall, the re-the management support item, where
the mean is reported at 4.66 and the internal knowledge and expertise at 4.43. This showed that the respondents slightly agree that both factors play a role in adopting the OSS to the organi-zation.
In the environmental context, platform long term viability factor had the
sec-Table 4. Descriptive Statistics for OSS adoption Independent Variables
independent variables descriptive statistics
n Minimum Maximum Mean std. deviation
open source system adoption 124 1.5 7 5.04 1.32
technology context
relative advantage 124 1 7 4.67 1.17 perceived compatibility 124 2 7 4.99 1.09
Perceived Complexity 124 1 6 3.53 1.20
perceived Trialability 124 2 7 5.26 1.08
organizational context
Management Support 124 1.80 7.00 4.66 1.33 Knowledge & Expertise 124 1.00 7.00 4.43 1.33
environmental context
Technology Skills & Services 124 2.00 7.00 4.45 1.15 platform Long Term Viability 124 2.00 7.00 5.09 1.05
dependent variables descriptive statistics
n Minimum Maximum Mean std. deviation
oss adoption 124 1.5 7 5.04 1.32
Implemented OSS in systems
and apps 124 1 7 5.27 1.50
Implemented with big impact
to business process 124 1 7 5.05 1.46 Implemented with capabilities
to support business process 124 1 7 5.12 1.41 Implementation substantially
changed business process 124 1 7 4.72 1.42
Table 5. reliability Statistics for research Variables
reliability statistics cronbach’s
alpha
cronbach’s alpha Based
on standardized items n of items
oss adoption 0.933 0.933 4
technology context
relative advantage 0.817 0.815 4 perceived compatibility 0.917 0.918 5
Perceived Complexity 0.880 0.882 4
perceived Trialability 0.815 0.813 3
organizational context
Management Support 0.938 0.938 5
Knowledge & Expertise 0.916 0.916 4
environmental context
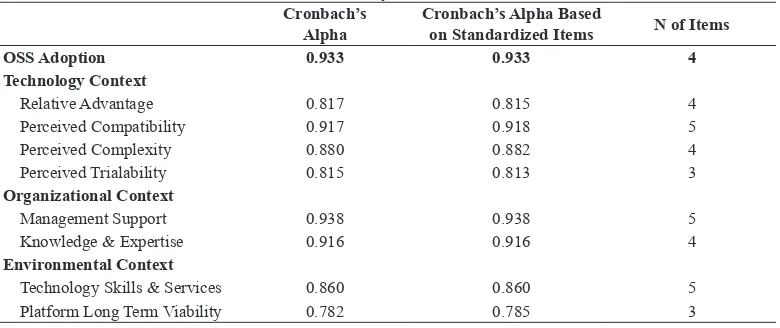
variables. The alpha for the OSS adop-tion variable is 0.933. In technology context, perceived relative advantage’s alpha is 0.817, perceived compatibili-ty’s alpha is 0.917, perceived complex -ity is 0.88 and perceived trialabil-ity is 0.815. The overall cronbach’s alpha result was high for the organizational context resulted high where the man -agement support construct recorded with the highest alpha of 0.938 and knowledge and expertise with a record of 0.916. Thus, both items are highly reliable and valid for this analysis. In environmental context, the technology skills and services’ alpha is 0.860 and spondents agree that by implementing
OSS, the organization can avoid ven-dor lock-in. This is reported by having the mean of 4.45 out of 7 for technol-ogy skills and services. For the OSS adoption dependent variable, a mean of 5.04 was reported with standard de-viation of 1.32. Further analysis was done based on each of the item in the OSS adoption.
Reliability and Validity
Table 5 summarizes the results from the reliability testing done on each of the constructs. The cronbach’s alpha results shows consistently high in all
Table 6. correlation Table
technological correlations
relative advantage
perceived compatibility
perceived
Complexity Trialabilityperceived OSS adoption r 0.489** 0.739** -0.383** 0.557**
Sig. (2-tailed) 0.000 0.000 0.000 0.000 relative advantage r 1.000 0.466** 0.012 0.296**
Sig. (2-tailed) 0.000 0.891 0.001
perceived compatibility r 1.000 -0.314** 0.717
Sig. (2-tailed) 0.000 0.000 0.000
Perceived Complexity r 1.000 -0.162
Sig. (2-tailed) 0.000 0.000 0.000
perceived Trialability r 1.000
Sig. (2-tailed) 0.000 0.000 0.000 **. Correlation is significant at the 0.01 level (2-tailed).
organisational correlations
Open Source adoption
Management Support
Knowledge & Expertise Open Source adoption r 1 0.633** 0.668**
Sig. (2-tailed) 0.000 0.000
Management Support r 1 0.791**
Sig. (2-tailed) 0.000
Knowledge & Expertise r 1
Sig. (2-tailed)
**. Correlation is significant at the 0.01 level (2-tailed).
environmental correlations
Open Source adoption
Technology Skills & Services
platform Long Term Viability Open Source adoption r 1 0.524** 0.576**
Sig. (2-tailed) 0.000 0.000
Technology Skills & Services r 0.524** 1 0.595**
Sig. (2-tailed) 0.000 0.000
platform Long Term Viability r 0.576** 0.595** 1
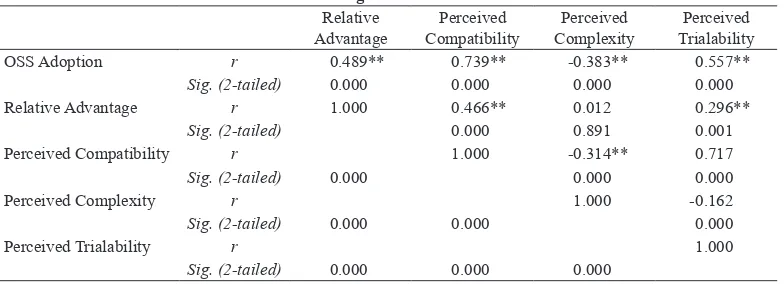
tive or negative and also the strength of the relationship (pallant, 2011). The results are shown in Table 6.
Multiple Regression
The standard multiple regression was applied to test the research hypoth-eses. This is due to the dependent vari-able which is a continuous varivari-able and because as the scores are normally distributed (pallant, 2011). The regres-sion analysis is used to “predict an outcome variable from one predictor (simple regression) or several predic-tor variables (multiple regression)” platform long term viability is 0.782.
Further analysis was done to item tech-nology skills and services’ and found out that if item avoid vendor lock in is deleted, it can increased the alpha to 0.870. Thus, this item is taken out for the rest of analysis. nunnally (1978) recommended a minimum level of 0.7 for the cronbach’s alpha.
Testing of Hypotheses
Pearson correlation is used to explore the relationship between two variables. This will give an indication of the re-lationship direction whether it is
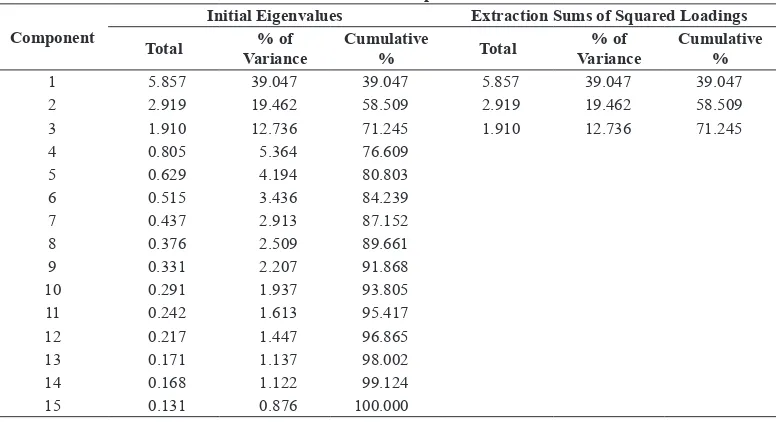
posi-Table 7. Total variance explained for the Technological context
total variance explained
component
initial eigenvalues extraction sums of squared Loadings
total % of
variance
cumulative
% total
% of variance
cumulative %
1 5.857 39.047 39.047 5.857 39.047 39.047 2 2.919 19.462 58.509 2.919 19.462 58.509 3 1.910 12.736 71.245 1.910 12.736 71.245 4 0.805 5.364 76.609
5 0.629 4.194 80.803 6 0.515 3.436 84.239 7 0.437 2.913 87.152 8 0.376 2.509 89.661 9 0.331 2.207 91.868 10 0.291 1.937 93.805 11 0.242 1.613 95.417 12 0.217 1.447 96.865 13 0.171 1.137 98.002 14 0.168 1.122 99.124 15 0.131 0.876 100.000 Extraction Method: Principal Component Analysis
Table 8. Total Variance Explained for the Organizational Context
total variance explained
component
initial eigenvalues extraction sums of squared Loadings
total % of
variance
cumulative
% total
% of variance
cumulative %
1 6.468 71.872 71.872 6.468 71.872 71.872 2 0.797 8.858 80.729
results were as per Table 11. It is re-ported that the significance value is 0.00, where there is about zero chance in 1000 type 1 error. This also shows that the data reliability with the OSS adoption decision is strongly related. From the correlation in Table 12, two factors have high correlations with the dependent variable. The pearson cor-relation r value for perceived compat-(Field, 2009). The first analysis is done
on the correlation of the new factors with the dependent variable. In Table 10, the R square explained that the model explains 64.5% of the variance in OSS adoption.
To look at the significance of the re-lationship between the factors, the anOVa analysis was conducted. The
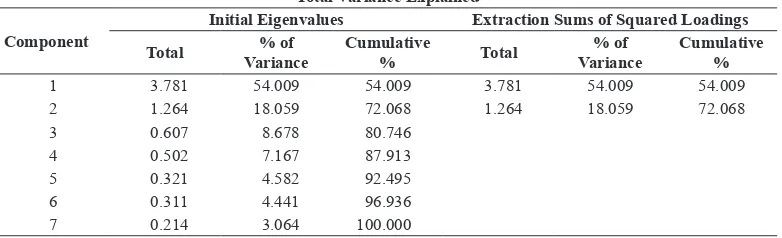
Table 9. Total Variance Explained for the Environmental Context
total variance explained
component
initial eigenvalues extraction sums of squared Loadings
total % of
variance
cumulative
% total
% of variance
cumulative %
1 3.781 54.009 54.009 3.781 54.009 54.009 2 1.264 18.059 72.068 1.264 18.059 72.068 3 0.607 8.678 80.746
4 0.502 7.167 87.913 5 0.321 4.582 92.495 6 0.311 4.441 96.936 7 0.214 3.064 100.000 Extraction Method: Principal Component Analysis.
Table 10. Model Summary
Model summaryb
Model r r square adjusted r square std. error of the estimate
1 0.803a 0.645 0.627 0.79751
a. Predictors: (Constant), Platform Long Term Viability, Perceived Complexity, Relative Advantage, Technology Skills & Services, Management Support, Knowledge & Expertise, Perceived Compatibility & Trialability b. Dependent Variable: Open Source adoption
Table 11. anOVa Table
anovaa
Model sum of squares df Mean square F sig.
1 regression 135.131 6 22.522 35.41 .000b
residual 74.415 117 0.636 Total 209.546 123
a. Dependent Variable: Open Source adoption
b. Predictors: (Constant), Platform Long Term Viability, Perceived Complexity, Relative Advantage, Technology Skills & Services, Management Support, Knowledge & Expertise, Perceived Compatibility & Trialability
Table 12. Coefficient Table
Coefficientsa
Model unstandardized
Coefficients standardized Coefficients correlations collinearity statistics
B std.
error Beta t sig.
Zero-order Partial Part tolerance viF
1 (constant) 0.646 0.521 1.239 0.218
relative advantage 0.217 0.059 0.216 3.65 0.000 0.387 0.320 0.201 0.868 1.152
perceived compatibility & Trialability 0.485 0.120 0.375 4.025 0.000 0.720 0.349 0.222 0.349 2.862
Perceived Complexity -0.208 0.066 -0.191 -3.168 0.002 -0.383 -0.281 -0.175 0.832 1.202
Management Support, Knowledge & Expertise 0.269 0.092 0.259 2.929 0.004 0.685 0.261 0.161 0.387 2.586
Technology Skills & Services -0.029 0.077 -0.027 -0.371 0.712 0.459 -0.034 -0.02 0.580 1.725
grouped together. The fifth hypothesis (H5) states the relationship between management support and the OSS adoption while (H6) relates the knowl-edge and expertise with the OSS adop -tion. The beta value is at 0.259 and the significance level is at 0.004. Hence this results shows that management support, knowledge and expertise significantly contributed to the OSS adoption for the significant p<0.05 and does support H5 and H6.
In the environmental context, the sev -enth hypothesis (H7) relates the tech-nological skills and services to the OSS adoption. as shown in the table above, the standardized coefficient is-0.27 and the p-value is 0.712, which is more than p at 0.05. Hence, the result does not support for H7 and H7 is in-significantly relates to the OSS adop -tion.
The last hypothesis (H8) tested on the platform long term viability rela-tionship with the OSS adoption. The results in the table above shows that the coefficient beta is 0.091 and the p-value is 0.251. This means that the platform long term viability does not make a significant unique contribution to the OSS adoption. Hence, the result does not support H8.
Overall, two hypotheses are not sup-ported by the results of the analysis and both of which are under the envi-ronmental context. On the other hand, both technology and the organization-al context do have a significant con-tribution to the decision on the OSS implementation in the organizations. a summary of the hypotheses testing is shown in Table 13.
ibility and trialability is 0.720 with and significance at p=0.00. The other fac -tor is management support, knowledge and expertise resulted r=0.685 and its significance is at p=0.00.
Hypothesis Testing
The first hypothesis (H1) tested on the relationship between perceived rela-tive advantage and OSS adoption. as reported in the coefficient analysis in Table 12, the standardized coefficient between perceived relative advantage and OSS adoption is 0.216 and the significance at 0.000, which is signifi -cant at p< 0.05. In other words, there is high level perceived relative advan-tage of OSS adoption in the organiza-tion. Thus, the result provides support for H1.
The second and fourth hypothesis (H2, H4) tests the relationship of perceived compatibility and trialability with OSS adoption. The standard coefficient beta is 0.375 with significant level at p=0.000. This shows that the item is significant at p< 0.05. With this, the perceived compatibility and trialabil-ity does significantly contribute to the OSS adoption in an organization.
The third hypothesis (H3) tests the relationship of perceived complexity with the OSS adoption. The regres-sion table state the coefficient beta at -0.191 and it is significantly contrib-uted to the OSS adoption by having a significant level which is less than 0.05 (p=0.002). Thus, it is perceived that complexity has a unique contribu -tion to the OSS adop-tion.
in technological context, four factors were being used: relative advantage, compatibility, complexity and trial -ability. all the factors were found significant to the adoption of OSS. Managers should consider the relative advantage when evaluating the OSS application to the organization. These include the cost of implementation for hardware, software and switching cost related to adopting the OSS. Thus, comparison of financial implication between the traditional approach of acquiring software and OSS must be evaluated before organizations decide to move to OSS.
In the study, compatibility and trial-ability were also found as important factors in OSS adoption. The respond-ents preferred more compatible OSS platform to the existing applications to ease the transition process. With the compatibility of OSS, managers in organizations would be able to justify the investment made thus gain recog-nition that it is beneficial in the long run. Managers in organizations would also like to be able to test the software before implementing it. This enables end-users to have hands-on experience of the features and functions of sys-tems developed using OSS. In addi-Discussion
This research also attempts to identify the variables and significant factors that relate to the OSS adoption as well as the level of the adoption. Thus the first question addressed in this research is “What is the level of adoption of OSS enterprise systems in Malaysia?”
Based on the results, the level of adop-tion is high especially in the govern-ment sector in Malaysia. The results also show a very high implementation in operating systems (79.8%) as well as the databases(79.0%). These find -ings are different from that in devel-oped countries. In the uS, the famous OSS applications are web servers fol-lowed by web browsers (Spinellis and giannikas, 2012).The research was then further conducted to analyze the significant factors that influence the manager’s decision by constructing the second question “What are the
significant factors that influence a
managers’ adoption of OSS enterprise system”.Thus, this research provides answers to the antecedents of OSS adoption in organizations as implica-tions for research.
nonetheless, there are also implica-tions for practice for all the anteced-ents of OSS adoption. For example,
Table 13. Summary of Hypothesis Testing results
no Hypothesis conclusion
technological context
H1 perceived higher relative advantage of OSS is positively affecting the adoption of OSS. Supported H2 perceived higher compatibility of OSS is positively related to the adoption of OSS. Supported H3 Perceived complexity of OSS is negatively affecting the adoption of OSS. Supported H4 perceived triability of OSS is positively related to the adoption of OSS. Supported
organizational context
H5 greater top management support of OSS is positively affecting the adoption of OSS. Supported H6 Higher knowledge & expertise of OSS is positively related to the adoption of OSS. Supported
environmental context
H7 Higher availability of technological skills and services is positively related to the adoption of OSS.
rejected
skills and services were not found to affecting the OSS adoption. With the internal skill and services developed within the organization, innovation among the organization level would be increased.
Similarly, for platform long-term vi-ability, the results showed that this factor was not found to affect the OSS adoption. as mentioned earlier in this study the users or the community who have fixed or added new features to the software is contributing the improve-ment of OSS. Thus, it is not required for the OSS to be winning standards or enriched features in order for the users to implement the OSS.
Limitation to the study
This study has several limitations that affect the generalization of the findings. The first limitation is due to the unfairly distribution between the public and private sector. The second limitation to this research is the collec-tion method of this survey. The main method of distribution is via email and the distribution list is only on the public sector based on the OSS adop-tion report by OScc. Due to time con-straints, the target respondents were being contacted via email. The third limitation is due to the location of the organization where most of the organi-zations were located in the Klang Val-ley and putrajaya. Only a few of the organizations are from other states in Malaysia which do not represent the overall findings. Lastly, this study was taken at the point of time of the OSS implementation. The results might dif-fer by doing surveys on continuous usage or cross sectional surveys of the OSS implementation.
tion, if OSS is less complex, it is more likely to be accepted by the managers who make IT decision in organiza-tions. They would like to see systems developed using OSS less complex to encourage end users to switch to OSS.
Two factors of the organizational con-text were identified, namely manage -ment support as well as knowledge and expertise. The results show that these factorsare significant in relation to the OSS adoption. It is therefore important for any OSS implementation to have support from the top management as well as having internal knowledge and expertise. This is to ensure the success of the implementation. Managers in organizations, which intend to adopt OSS, must be able to convince the top management to move away from those systems developed through the tradi-tional software.
The last context discussed in this study is the environment. Two factors were being identified; technological skills and services and platform long term viability. These factors were be-ing highlighted, as important factors in adopting OSS in numerous studies but it have been proven unsupported in this study. It could be due to the fact that Malaysian organizations consider other factors, which are more impor-tant such as the monetary aspect or the relevance and requirements of the OSS to the organizations.
fered to the organization. Other practi-tioners in other regions to test out the effects especially in developing coun-tries can also duplicate this research.
Conclusion
This study provides empirical evi-dence of the technological, organiza-tional and environmental factors that affect the OSS adoption among com-panies in Malaysia. The findings give managers some insights before adopt-ing OSS enterprise systems. This study shows that from the TOe framework, only two contexts are applicable in Malaysian perspective. The contexts are technological and organizational. This shows that a different finding may result when conducted in a dif-ferent region than the originated study. The findings from this study add evi-dence to existing studies on the OSS adoption specifically to those using the TOe framework.
Suggestions for future research It would be interesting to do an explor -atory research of this study to investi-gate further the actual perceptions of managers on the OSS adoption. This is to address any other factors that were not counted such as the security fea-tures of the systems and source code availability. Further study can also be done to differentiate the effects in the public and private sector separately as this study is generalized for both sec-tors. The significant factors might be different between the two sectors. This study also can be extended to different levels of respondents. Data can be col-lected from the top management level in an organization to the end users. This is to explore different views of the OSS adoption in an organization. Data can be collected from other states in Malaysia to generalize the findings. The external support in the market could also use this research to create a better support and services to be
of-allen, J. p.& geller, D. (2012). Open source deployment in local government: rapid innovation as an occasion for revitalizing organizational IT. Information Technology & People, 25(2),136-155.
cavana, r., Delahaye, B. L. &Sekeran, u. (2001). Applied business research: Qualitative and quantitative methods. Milton, Queensland: John Wiley & Sons
australia.
chamili, K., Jusoh, y.y., yahaya, J.H.&pa, n.c. (2012). Selection criteria for open source software selection criteria for open source software adoption in Malaysia. Asian Transactions on Basic and Applied Sciences, 02(02).
chau, p.y.K. &Tam, K.y. (1997). Factors affecting the adoption of open systems: an exploratory study. MIS Q., 21(1), 1-24. doi: 10.2307/249740
coakes, S.J., Steed, L.g. &Ong, c. (2010). SPSS: analysis without anguish: ver-sion 17 for Windows: John Wiley & Sons australia, Ltd.
coppola, c. &neelley, e. (2004). Open source - opens learning. Why open source makes sense for education. http://www.rsmart.com/assets/OpenSourceOpens -LearningJuly2004.pdf accessed July 11, 2014.
Dedrick, J. &West, J. (2003). Why firms adopt open source platforms: A ground-ed theory of innovation and standards adoption. MISQ Special Issue Work-shop on Standard Making: A Critical Research Frontier for InformationSys-tems,236-257.
Dedrick, J. &West, J. (2004). An exploratory study into open source platform adoption. proceedings from the 37th Annual Hawaii International Conference on System Sciences (HICSS’04) - Track 8 - Volume 8.
Di Stefano, g., gambardella, a. & Verona, g. (2012). Technology push and de-mand pull perspectives in innovation studies: Current findings and future re -search directions. Research Policy, 4,1283–1295.
ellis, J. &Belle, J.-p.V. (2009). Open source software adoption by South african MSes: Barriers and enablers. Proceedings from the 2009 Annual Conference of the Southern African.
Field, a. (2009). Discovering statistics using SPSS: Sage publication Ltd.
Glynn, E., Fitzgerald, B. &Exton, C. (2005). Commercial adoption of open source software: an empirical study. Proceedings from International Conference on Empirical Software Engineering.
goode, S. (2005). Something for nothing: management rejection of open source software in Australia’s top firms. Information & Management, 42(5), 669-681.
gurusamy, K. &campbell, J. (2012). enablers of open source software adoption: a case study of apS organisations. Australasian Journal of Information Sys-tems.
Hauge, Ø., ayala, c. &conradi, r. (2010). adoption of open source software in software-intensive organizations - a systematic literature review. Inf. Softw. Technol., 52(11).
IDc. (2008). Worldwide Open Source Software 2009-2012 Forecast: IDc.
Malaysian public Sector Open Source Software Initiative. (2005): MaMpu.
Morgan, L. &Finnegan, p. (2007). How perceptions of open source software
in-fluence adoption: An exploratory study. proceedings from the 15th European
Conference on Information Systems, university of St gallen , Switzerland.
Morgan, L. &Finnegan, P. (2010). Open innovation in secondary software firms: An exploration of managers’ perceptions of open source software. SIGMIS Da-tabase, 41(1),76-95. doi: 10.1145/1719051.1719056
nunnally, J.c. (1978). Psychometric theory: Mcgraw-Hill.
Open Source competency center (OScc) Laporan adoption chart Tahun 2011. (2012).Malaysian Administrative Modernisation and Management Planning Unit.
OSS adoption Statistics Malaysian public Sector Open Source Software
pro-gramme. (2010).OSCC MAMPU.
pallant, J. (2011). SPSS survival manual - A step by step guide to data analysis using SPSS. australia: allen & unwin.
rogers, e.M. (2003). Diffusion of innovations. New York: Free Press.
Spinellis, D. &giannikas, V. (2012). Organizational adoption of open source soft-ware.The Journal of Systems and Software, 85, 666–682.
Sekaran, u. &Bougie, r. (2010). Research methods for business: A skill building approach: John Wiley & Sons.
Tornatzky, L. & Fleischer, M. (1990). The processes of technological innovation.
Lexington Books.
Varian, H.R. &Shapiro, C. (2003). Linux adoption in the public sector: An eco -nomic analysis. Working paper, University of California, Berkeley.
Ven, K. &Verelst, J. (2006). The organizational adoption of open source server software by Belgian organizations. In Damiani, e., Fitzgerald, B., Scacchi, W., Scotto, M. &Succi, g. (eds.), Open Source Systems, 203, 111-122: Springer uS.
Ven, K. &Verelst, J. (2012). a qualitative study on the organizational adoption of open source serversoftware. Information Systems Management, 29(3),170-187.
West, M.a. &Farr, J.L. (1990). Innovation and creativity at work: Psychological and organisational strategies. Oxford: John Wiley and Sons
Whitten, J. ., Bentley, L.D. &Dittman, K.c. (2001). Systems analysis and design methods (5th ed.): Mcgraw-Hill Irwin.
zhu, K., Kraemer, K.L. &Xu, S. (2002). a cross-country study of electronic busi-ness adoption using the Technology-Organization-environment framework. proceedings from the 23rdInternational Conference on Information Systems.