Analysis of Rainfall Characteristicsfor Flood Estimation in Way
Awi Watershed
Kusumastuti, D.I.1*, Jokowinarno, D.1, van Rafi’i, C.H.1, Yuniarti, F.1
Abstract: This study investigates rainfall intensity distribution in Way Awi watershed located in Bandar Lampung, and how their impacts on flood peak and flood hydrographs. Hourly rainfall data is examined to obtain design rainfall intensity and rainfall intensity distribution at rainfall duration from three to eight hours. Rainfall-runoff model, i.e. Rational method is used to calculate flood peak while unit hydrograph method is used to develop flood hydrograph. This study shows that in Way Awi watershed 88.3% to 96.4% of 24-hour rain occurs in three to eight hour durations. In addition, rainfall with three hour duration generates the highest flood peak, followed by four hour duration rainfall. When rainfall duration and design rainfall intensity are the same but rainfall intensity distribution is different, generated flood hydrograph may have different flood peak magnitude and timing. Result of this study is useful for flood analysis and mitigation in Way Awi watershed.
Keywords: Design rainfall intensity; flood hydrograph; flood peak; rainfall intensity distribution
Introduction
In addition to land use and topography, rainfall properties such as intensity and duration of rainfalls, interstorm period, and within-rainfall pattern are the main factor in determining flood peak [1-5]. It is not only the total amount of rainfall that causes destruction to nature and buildings but also high peaks of rainfall intensity during short period of time [1-5]. Rainfall intensity is a measure of the amount of rain (rainfall depth) that falls during a given period and usually used to calculate flood peak or flood hydrograph. It is common in engineering practice to specify a rainfall event as design rainfall
(unit in mm) which must reflect required levels of protection, local climate, and watershed conditions as well as to ensure safe, economical and stan-dardized design of hydraulic structures.
Design rainfall intensity distributions are used to represent the typical variation of design rainfall intensities during a typical rainfall event. A number of hydrology analyses in Indonesia used an assump-tion of rainfall intensity distribuassump-tion to determine flood peak or flood hydrograph [6,7].
1 Civil Engineering Department, Engineering Faculty, Lampung University (UNILA), Lampung, INDONESIA.
* Corresponding authour; e-mail: [email protected]
Note: Discussion is expected before June, 1st 2016, and will be published in the “Civil Engineering Dimension” volume 18, number 2, September 2016.
Received 10 March 2015; revised 03 November 2015; accepted 20 February 2016.
One of the assumptions used is based on Van Breen observation using rainfall data of Java Island [8-10], assuming that 90% of the rain falls in one day (24 hours) are concentrated within four hours. It is also assumed that the temporal rainfall intensity distribution in the four hour duration is 10%, 40%, 40%, and 10% for the first, second, third, and fourth hours respectively.
Based on the assumption of rainfall intensity distri-bution described above, design rainfall intensity usually is considered as 40% of the 90% design rainfall. The value of 40% is taken into account as the highest rainfall intensity and can be used to calculate peak flow such as in the Rational method [10]. However, the assumption of rainfall intensity distribution may not be appropriate to be applied in a particular watershed without further study on rainfall intensity distribution of the watershed. Hence, one needs to investigate rainfall intensity distribution pattern in order to define design rainfall intensity. As it is suggested earlier, determining rainfall intensity is essential in estimating flood peak in a particular watershed.
basin occurs when all parts of the watersheds contribute to flow and that rainfall is distributed uniformly over the watershed area. Design rainfall intensity is one of the key parameters in determining flood peak using the Rational method.
Design rainfall intensity is important to determine peak flow in flood peak model such as Rational method, while rainfall intensity distribution is important in continuous flow model. For larger watershed area in which channel storage may be significant, simple peak-flow methods are not sufficient for the evaluation of runoff. In this case, response to rainfall events tend to be slower, and it is necessary to evaluate the variation of runoff over time. In this respect, Unit Hydrograph Models are the most widely-used techniques for evaluating runoff [11]. The unit hydrograph reflects the ensem-ble of the physical characteristics of the watershed. The unit hydrograph (UH) of a watershed is defined as the hydrograph resulting from an effective rainfall of 1 mm evenly distributed over the basin during a certain time [13]. For a particular reference duration of effective rainfall, the ordinates of the hydrograph are proportional to rainfall. The temporal distri-bution of rainfall intensity within the design rainfall is an important factor that affects the runoff volume and magnitude and timing of the peak discharge.
This study examines rainfall data in Way Awi watershed to find out temporal rainfall intensity distribution as well as design rainfall intensity. Based on the findings, flood design will be calculated using rainfall-runoff methods. The aims of this study are (1) to investigate design rainfall intensity and temporal rainfall intensity distribution, (2) to inves-tigate the impact of rainfall intensity distribution on flood peaks, (3) to investigate the impact of rainfall intensity distribution on flood hydrograph.
Method
The study area is Way Awi watershed, located in Bandar Lampung city, Lampung Province (Figure 1). The area of the watershed is 7.967 km2.
Figure 1. Way Awi watershed [14]
The research method includes analysis of design rainfall intensity, rainfall intensity distribution, and flood design. There are two methods used in deter-mining flood design, (1) defining the peak discharge using Rational method and (2) defining the flood hydrograph using derived unit hydrograph method.
Analysis for Rainfall Intensity Distribution
Series of hourly rainfall data from 2000 – 2014 were obtained from the Meteorological and Geophysics Berueu Panjang, Lampung Province [15]. A whole year missing data was found in 2002 due to raingauge failure. The average annual rainfall was approximately 1670 mm. The series of hourly rain-fall data was grouped according to rainrain-fall durations, with the shortest and longest durations are three and eight hours respectively. An example of rainfall events with duration of three, four, and five hours are presented in Figure 2.a to c respectively.
Figures 2a shows an example of a rainfall event with a duration of 3 hours. It shows that there are some other rains occur during 24 hours or one day. However, it cannot be considered as a storm event, as the duration of the rain less than 3 hours. In addition, the minimum rainfall depth considered in the analysis is 20 mm/day. According to Triatmodjo [13], rainfall depth 20 – 50 mm/day is considered as normal rain and above 50 mm/day is considered as heavy rain. Rainfall depth less than 20 mm is considered as light rain. Figure 2b and 2c show examples of rainfall events with four and five hour durations respectively. Similarly there may be some other rainfalls during 24 hours.
The rainfall depth of the three hour duration rainfall event presented in Figure 2a is 22.5 mm, while the rainfall depth within 24 hours is 26.5 mm. Therefore the percentage of accumulative rainfall depth compared to 24-hour rainfall depth is 84.9%. In Figure 2b the rainfall depth of the four hour duration rainfall event is 22.5 mm and the rainfall depth within 24 hours is 25 mm giving the percentage of accumulative rainfall depth compared to 24-hour rainfall depth as 90%. Similarly, the rainfall depth of the five hour duration rainfall event as shown in Figure 2c is 22.5 mm, while that of 24 hours is 24.575 mm. Thus the percentage of accumulative rainfall depth compared to 24-hour rainfall depth is 91.56%.
Figure 2. Example of Temporal Rainfall Intensity Distri-bution Within one Day where Rainfall is Concentrated Within (a) three hours, (b) four hours, (c) five hours
Design Rainfall Intensity and Design Rainfall
Design rainfall intensity is defined as the highest rainfall intensity within hourly rainfall intensity distribution. Prior to calculating the value of design rainfall intensity, one needs to determine design rainfall. Design rainfall is calculated using frequency analyses which are used to estimate the probability of the occurrence of a given hydrologic event. Data required for design rainfall is maximum daily rainfall in a year. The calculation of the magnitudes of extreme events uses suitable probability dis-tribution for available data, which the probability distribution can be Normal, Log Normal, Log Pearson Type III or Gumbel distribution.
Runoff Estimation using Rational Method
Application of Rational method is based on a simple formula that relates runoff of the watershed, Q (m3/sec), rainfall intensity for a particular length of time (the time of concentration), I (mm/hour), and the watershed drainage area, A (km2), [10,11] shown in Equation 1
Q = 0.278 C I A (1)
where, C is the runoff coefficient (dimensionless).
Land use of Way Awi watershed consists of 60% residential area, 32% vacant land, 2% road, and 6% other buildings [14]. Based on that land use and runoff coefficients, the average runoff coefficient of the watershed is 0.584 [13].
Determination of Design Flood using Derived Unit Hydrograph Method
The peak discharges of a streamflow due to rainfall can be obtained from the multiplication of design rainfall with unit hydrograph, either a derived or synthetic unit hydrograh. In this research a derived unit hydrograph for Way Awi watershed was obtained from previous work by Kusumastuti and Jokowinarno [16] as presented in Figure 3. Detail description about derived unit hydrograph is explained by Chow et al. [17]. If there are m pulses of effective rainfall and n pulses of direct runoff in the rainfall event considered, derivation of a unit hydrograph includes the computation of direct runoff
Qn given effective rainfall Pm and the unit hydro-graph According to Chow et al. [17] the equation to calculate derived unit hydrograph is presented in Equation 2:
∑
(2)
This unit hydrograph will be used to calculate design flood hydrograph using rainfall intensity distribution obtained from this research.
Figure 3. Observed Unit Hydrograph of Way Awi Water-shed and Corresponding Hyetograph [16]
Result and Discussion
Parameters of rainfall data investigated in this study includes number of events within 14 year rainfall data series, maximum rainfall depth, minimum rainfall depth, and the percentage of rainfall depth of
the rainfall event compared to total rainfall within 24 hours. Table 1 shows the characteristics of rainfall data in Way Awi watershed. Among other rainfall durations, rainfall event of three-hour occurred more often compared to rainfall event at longer durations. Rainfall event with the duration of one and two hours are not taken into account as the duration is too short and in most events, they are followed by another rainfall event which have longer rainfall duration and higher rainfall depth. Previous work done by Robinson and Sivapalan [1] also considered a rainfall event to have duration at least 3 hours.
The result presented in Table 1 shows that number of rainfall event decreases at longer rainfall dura-tion. In addition, the result shows the highest maxi-mum total rainfall is produced by 4-hour rainfall, followed by 3-hour rainfall. General trend of rainfall data demonstrates that the maximum rainfall depth increases until duration of four hours then decreases. In contrast, the minimum rainfall depth increases as the rainfall duration increases.
Rainfall depth of the rainfall event compared to accumulative rainfall depth within 24 hours shows that the percentage ranges from 88% to 96%. It means that most rain falls at that particular rainfall event. This result is in line with Van Breen method [8-10] which considered that 90 percents of one-day rain falls within certain rainfall duration.
Table 1. Rainfall Parameters Rainfall data
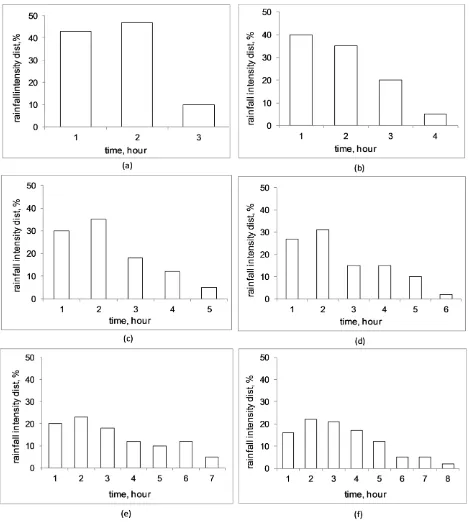
The hourly rainfall intensity distribution for each duration is presented in Figure 4. The hourly rainfall intensity distribution is obtained by averaging rainfall intensities for the same hour for all rainfall events with the same duration. For example for the three hour rainfall duration, the first hourly rainfall intensity is obtained by averaging the rainfall intensity at the first hour of all rainfall events with three hour rainfall duration. The rainfall intensity at
the second and third hours are calculated in the same way.
For rainfall durations of three to six hour (Figures 4a-d) the first two hours are 12% to 37% higher compared to the next hours. The highest rainfall intensity occurs at the second hour except for rainfall duration of four hours (Figure 4b), where the highest rainfall intensity occurs at the first hour. Rainfall intensity distributions for the rainfall durations of seven and eight hours (Figure 4e-f) show different trend, where the highest rainfall intensity does not differ considerably compared to the rest of the hourly rainfall intensities. For rainfall duration of seven hours the hourly rainfall intensities are distributed between 5% to 23% (Figure 4e). For rainfall duration of eight hours the hourly rainfall intensities at the first to the fifth hours are distributed between 12% to 22%, while the rest hourly rainfall intensities are 2% to 5% (Figure 4f). The result demonstrates that shorter period of rainfall tends to have high rainfall intensity. A preliminary work by Kusumastuti et al.
[17] on the characteristics of rainfall intensity distribution which used shorter length of rainfall data shows similar trend.
For rainfall duration of four hours, the highest percentage of rainfall depth distribution obtained from this research was 40% (Figure 4b). That value is the same as the percentage of the highest value as
in Van Breen’s method. The difference between the
result of this study and Van Breen method is in the hourly rainfall intensity distribution. Usually rain-fall intensity distribution used was low in first hour, and significantly high in the second and third hours and considerably decreases in the fourth hour, i.e. 10%, 40%, 40%, 10% for the first, second, third, and fourth hours respectively. While the results of the study show that the distribution pattern was high in beginning hours and lower toward the end, i.e. 40%, 35%, 20% and 5% for the first, second, third, and fourth hours respectively (Figure 4b).
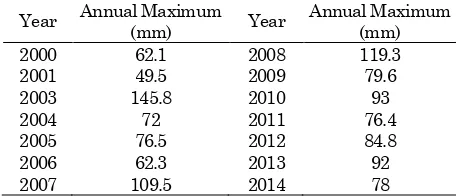
The design rainfall intensity is calculated based on the design rainfall. The annual maximum daily rainfall data used to calculate design rainfall is presented in Table 2.
Statistical analysis of the annual maximum of daily rainfall data gives the average of annual maximum (yavr) of 85.771 mm, standard deviation () 25.224, coefficient of variance (Cv) 0.294, coefficient of skew-ness (Cs) 1.058, and coefficient of kurtosis (Ck) 4.789. Using those statistical parameters for selecting appropriate probability distribution as described in Triatmodjo [13], it is found that the suitable proba-bility distribution is Log Pearson Type III. Design rainfall intensity using Log Pearson Type III is calculated using the Equation 3:
(3)
where y is the design rainfall for a certain return period, yavr is the average of annual maximum, KT is statistical coefficient for Log Pearson III, and is standard deviation. The design rainfall for return periods two, five and ten years are calculated as 81.4006 mm, 104.7012 mm, and 119.5865 mm respectively as shown in Table 3.
Table 3. Calculated Design Rainfall
Return period (Year) KT y (mm)
2 -0.1733 81.4006
5 0.7505 104.7012
10 1.3406 119.5865
Using these findings, design rainfall intensity for Way Awi watershed can be calculated as 40% of 90% of design rainfall (in one day). Thus calculated design rainfall intensity for two, five, and ten year return periods are 29.304 mm/hour, 37.692 mm/hour, and 43.051 mm/hour respectively.
Flood peaks calculated using Rational method at rainfall durations of three to eight hours are presented in Figure 5. It shows that using Rational method, rainfall intensity distribution does not give any impact on determining flood peak. Rather, design rainfall intensity which is obtained from the highest intensity within rainfall intensity distribu-tion determine flood peak. The percentages of the highest intensity from the rainfall events (Figure 4) are 50, 40, 31, 32, 20, and 22 percents for durations of 3, 4, 5, 6, 7, and 8 hours respectively and those values are manifested in the flood peaks as presented in Figure 5. In addition flood peaks calculated using rainfall duration of four hours and using van Breen method as presented in Figure 5 have the same values. This is due to the highest rainfall intensities within rainfall intensity distri-butions at the duration of four hours as presented in Figure 4b and using Van Breen method are the same, i.e. 40% of rainfall depth.
Figure 5. Flood Peaks in Way Awi Watershed Computed using Rational Method
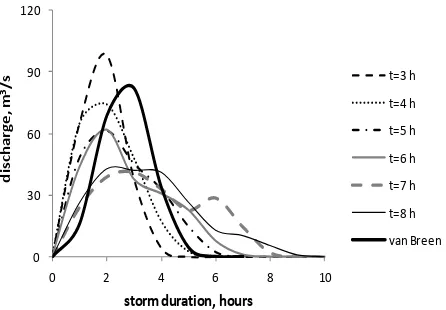
The hydrographs generated using rainfall intensity distribution for rainfall durations of three to eight hours are presented in Figure 6. The hydrographs generated using rainfall intensity distributions for rainfall durations three, four, five, and six hours have the same time to peaks, i.e. two hours. This is due to rainfall intensity distribution patterns which have high rainfall intensities at first and second
hours. Rainfall intensity distribution patterns are different from those for rainfall durations of seven and eight hours. High rainfall intensities at second, third, and sixth hours for rainfall duration of seven hour influence time to peak, flood peak as well as the shape of the hydrograph. Similarly, high rainfall intensities at second, third, and forth hours for rainfall duration of eight hours have an impact on significant variable of the hydrograph as mentioned above. Clearly, using unit hydrograph method rainfall intensity distribution determines not only flood peak but also time to peak and shape of the hydrograph as well as the recession time.
Figure 6. The Hydrographs Generated using Rainfall hydrograph generated using van Breen rainfall intensity distribution is different from the one generated using rainfall duration of four hours since rainfall intensity distributions obtained from those methods are different.
Conclusion
This study emphasizes the importance of analysis of rainfall intensity distribution for a watershed. Using rainfall durations of three to eight hours, it is found that in Way Awi watershed, 88.3% to 96.4 % of 24-hour rain, falls within those durations. The selection of appropriate rainfall duration and corresponding rainfall intensity distribution is significant to calcu-late flood peak or flood hydrograph. Shorter rainfall duration tends to have significantly high rainfall intensity at the first and second hours and con-sequently have higher design rainfall intensity. Rainfall durations of three and four hours produce the highest flood peaks. Longer rainfall durations
(i.e. seven and eight hours) tend to have similar rainfall intensities among hours. Therefore flood peaks resulted from rainfalls with those durations are lower than resulted from the shorter duration of rainfall. Although rainfall duration and design rainfall intensity are the same, different rainfall intensity distributions may lead to different flood hydrographs. The significance of rainfall intensity and rainfall intensity distribution on the magnitude and time to peak of flood is widely known in hydro-logy area; however, the result provides information to develop flood analysis for a particular watershed in Indonesia, which in this study is Way Awi watershed.
Acknowledgment
This research was financially supported by Depart-ment of Higher Education (DIKTI) by the scheme of National Strategic Grant awarded to the first and second authors. This support is gratefully acknow-ledged.
References
1. Robinson, J. and Sivapalan, M., Temporal Scales and Hydrological Regimes: Implications for Flood Frequency Scaling, Water Resources Research, 33(12), 1997, pp. 2981–2999.
2. Arnaud, P., Bouvier, C., Cisneros, L., and Dominguez, R., Influence of Rainfall Spatial Variability on Flood Prediction, Journal of Hydrology, 260(1–4), 2002 , pp. 216–230.
3. Kusumastuti, D. I., Struthers, I., Sivapalan, M., and Reynolds, D.A., Threshold Effects in Catchment Storm Response and the Occurrence and Magnitude of Flood Events: Implications for Flood Frequency, Hydrology and Earth System Sciences, 11, 2007, pp. 1515–1528.
4. Viglione, A. and Blöschl, G., On the Role of Storm Duration in the Mapping of Rainfall to Flood Return Periods, Hydrology and Earth System Sciences, 13, 2009, pp. 205-216.
5. Yulius, E., Rainfall Analysis for Intensity Duration Curve of Bekasi Catchment, Bentang, 2(1), 2014, pp. 1-8.
6. Ilmiaty, R.S., Susanto, R.H., Setiawan, B., Suryadi, F.X., and Bonar, G., Drainage Effects of Sangkuriang Indah Residential Area on
Condition Existing Drainage System in Watershed Borang River Palembang City,
International Journal of Biological, Ecological and Environmental Sciences (IJBEES), 1(4), 2012, pp. 154-158.
7. Fauziyah, S., Sobriyah, and Susilowati, Analisis Karakteristik dan Intensitas Hujan Kota Sura-karta, Matriks Teknik Sipil, 2013, pp. 82-89. 8. Agustianto, D.A., Model Hubungan Hujan dan
Runoff (Studi Lapangan), Jurnal Teknik Sipil dan Lingkungan, 2(2), 2014, pp.215-224.
9. Susilowati and Kusumastuti, D.I., Analisa Karakteristik Curah Hujan dan Kurva Inten-sitas Durasi Frekuensi (IDF) di Propinsi Lam-pung, Rekayasa, 14(1), 2010, pp.47-56.
10. Kusumastuti, D.I., Hydrology Analysis for the Johor River Using Synthetic Unit Hydrograph Gama I, Rekayasa, 13(3), 2009, pp. 219-228. 11. ASCE - American Society of Civil Engineers,
Design and Construction of Urban Stormwater
Management Systems, ASCE Manuals and
Reports on Engineering Practice No.77 and Water Pollution Control Federation Manual of Practice RD-20, New York, 1992.
12. Young, C., McEnroe, B., and Rome, A., Empi-rical Determination of Rational Method Runoff Coefficients, Journal of Hydrology Engineering, 14(12), 2009, pp.1283–1289.
13. Triatmodjo, B., Hidrologi Terapan, Beta Offset, Yogyakarta, 2008.
14. Bappeda Bandar Lampung, Bandar Lampung Spatial Plan, Bandar Lampung, 2010.
15. BMKG Panjang, Rainfall Data, Bandar Lam-pung, 2015
16. Kusumastuti, D.I. and Jokowinarno, D., Time Step Issue in Unit Hydrograph for Improving Runoff Prediction in Small Catchment, Journal of Water Resource and Protection, 4, 2012, pp. 686-693
17. Chow, V.T., Maidment, D.R., and Mays, L.W.,
Applied Hydrology, McGraw-Hill, New York, 1988.
![Figure 1. Way Awi watershed [14]](https://thumb-ap.123doks.com/thumbv2/123dok/3991882.1935302/2.595.60.277.609.768/figure-way-awi-watershed.webp)
![Figure 3. Observed Unit Hydrograph of Way Awi Water-shed and Corresponding Hyetograph [16]](https://thumb-ap.123doks.com/thumbv2/123dok/3991882.1935302/3.595.72.295.84.437/figure-observed-unit-hydrograph-way-water-corresponding-hyetograph.webp)