Faculty of Economics
University of Cambridge
Text of the Annual Distinguished Lecture, Asian Development Bank, Manila, 3 October 2007.
Theory and Application
P
ARTHAD
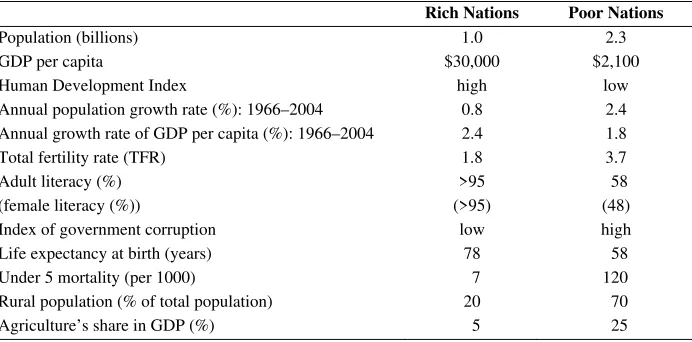
ASGUPTAIn development economics (in welfare economics, more generally), three questions can be asked in connection with human well-being in an economy: (i) how are people doing there?, (ii) how have they been doing in recent years?, and (iii) what should they do? Question (i) describes the current state of affairs, (ii) evaluates recent performance, and (iii) seeks to evaluate choices. Table 1, which collates well known statistics about rich and poor countries, is proto-typical of the way (i) is addressed these days. The table describes, it offers no comment on the way (ii) or (iii) may be addressed and answered. There is no evaluation in Table 1.
No matter which of the three questions we ask, however, we need to have an appropriate measure of human well-being. In recent years, debates on how to measure of human well-being have been influenced by two dichotomies: (1) the constituents vs. the determinants of human well-being, and (2) current vs. sustainable well-being.1 In publications from international organizations, much has been made of the former dichotomy (e.g., UNDP, 1994). It is, however, the case that the most well-known indices of social well-being—Gross National Product (GNP) per head and the United Nations Development Programme’s Human Development Index—are for all practical purposes measures of current well-being. Given the attention “sustainable development” continues to receive in international discourse, we need an index with which to check whether current policies are consistent with sustainable development.
1
Table 1. Rich and Poor
Rich Nations Poor Nations
Population (billions) 1.0 2.3
GDP per capita $30,000 $2,100
Human Development Index high low
Annual population growth rate (%): 1966–2004 0.8 2.4 Annual growth rate of GDP per capita (%): 1966–2004 2.4 1.8
Total fertility rate (TFR) 1.8 3.7
Adult literacy (%) >95 58
(female literacy (%)) (>95) (48)
Index of government corruption low high
Life expectancy at birth (years) 78 58
Under 5 mortality (per 1000) 7 120
Rural population (% of total population) 20 70
Agriculture’s share in GDP (%) 5 25
Source: World Development Indicators (World Bank, 2005)
In this lecture I argue that the right way to judge the economic performance of a country (or for that matter of any economic unit: household, village, district, state, country, the world as a whole) is to study movements in its productive base. By an economy’s productive base I mean its institutions and its capital assets. Institutions are different from capital assets, in that the former comprise the social infrastructure (e.g., laws, property rights, beliefs, and the extent of trust among people) for guiding the allocation of resources, including the capital assets themselves. By the latter I mean not only manufactured capital (roads, building, machines), human capital (education, skills, and health), and publicly available knowledge (science and technology), but also natural capital (minerals, oil and natural gas; fisheries, forests, soil; more generally, ecosystems). In what follows, we will call the social worth of an economy’s productive base its inclusive wealth. I shall then use some very crude data to ask what progress the world’s poorest regions have made in recent decades (our question (ii)). We will confirm that China has performed much better than the other two poor regions of the world, namely, sub-Saharan Africa and the Indian subcontinent, but we will discover that China’s wealth creation has been far more muted than its expansion of GNP. If degradation of such forms of natural capital as soil and the atmosphere were to have been included, China’s wealth creation would probably look even more muted.
1. DEFINITION OF SUSTAINABLE DEVELOPMENT
generations. The index of social well-being I shall work with is the present value of the flow of each generation’s well-being. This is of course a familiar concept in development economics. It was adopted long ago in the theory and empirics of national saving rates and it has been the foundation of the theory and empirics of social cost benefit analysis. So, by “sustainable development” I shall mean an economic programme along which average well-being of present and future generations, taken together, does not decline over time.
A. Sustainable Development and Inclusive Investment
It can be shown that an economy enjoys sustainable development if and only if, relative to its population, its inclusive wealth (at constant prices) does not decline.2 Naturally, we call a change in inclusive wealth over time (at constant prices), inclusive investment. The result I am appealing to says that an economy would enjoy sustainable development if and only if, relative to its population, inclusive investment is not negative.3 This is the sense in which inclusive wealth is a measure of intergenerational well-being. It is also the sense in which accumulation of wealth corresponds to sustained development. Inclusive investment is thus a key to economic progress.
A capital asset’s worth is its quantity multiplied by the present value of the flow of social benefits an extra unit would be able to generate over time. That present value is called the asset’s shadow price. So, by an economy’s inclusive wealth we mean the shadow value of its productive base and by inclusive investment we mean the shadow value of the net change in its productive base. Of course, even if some assets have decumulated, inclusive wealth would increase if there were a compensatory accumulation of other assets in the economy. Similarly, even if some assets have accumulated (building, roads, machines), inclusive wealth would decline if there was a substantial decumulation of other forms of capital assets (e.g., wetlands, coastal waters, forests, the atmosphere as a sink for pollutants).
Inclusive investment is to be contrasted from recorded investment. Because a wide range of services obtained from natural capital are missing from standard economic accounts, recorded investment could be positive even if inclusive investment were negative—a possibility I explore below (Table 2). On the other
2
See Dasgupta and Mäler (2000) for the case of constant population, and Dasgupta (2001 [2004]) and Arrow, Dasgupta, and Mäler (2003a,b) for the case of variable population.
3
hand, current accounting practice does not recognise that nutrition, health care, and potable water are not merely consumption goods, they are simultaneously investment goods. So, there is a corresponding undercount in recorded investment.
The notion of investment I am advocating here is not only inclusive of various types of capital assets, it is also sensitive to individual and locational differences. A pond in one location is a different asset from a pond in another, because their ecological characteristics are likely to differ and because the communities making use of them are likely to face different economic circumstances. It follows that seemingly identical ponds should have different shadow prices. Of course, in practice such refinements may not be attainable. But it is always salutary to be reminded that macroeconomic reasoning glosses over the heterogeneity of Earth’s resources and the diverse uses to which they are put - by people residing at the site and by those elsewhere. Shadow prices depend not only technology and consumer preferences, but also on institutions, and their combined effect on people’s lives.
B. Substitution Possibilities and Sustainable Development
It is important to realize that even if an economy satisfies the sustainability criterion (viz., that, relative to population, inclusive investment is not negative) today, or has satisfied the criterion in the recent past, it might not continue to do so in the future. Whether it is able to do so depends on the scale of the economy (as measured by, say, GDP), among other things. If the scale becomes too large relative to the natural capital base of the economy, the economy will be unable to maintain its inclusive wealth. Specifically, as an economy’s scale increases, natural capital (e.g. ecosystems) becomes more scarce relative to the size of the economy. Consequently, the amount of other types of capital needed to substitute for natural capital—that is, the shadow price of natural capital—may rise. The extent to which the shadow price rises depends on a number of factors, including the rate of technological progress. There can even come a point where no amount of feasible investment in manufactured capital or human capital can offset further declines in natural capital (Ehrlich and Goulder, 2007).
C. Weaknesses in GNP and HDI
increases (this will be confirmed when we come to study Table 2), which is no doubt a path of economic development we all would like to follow; but it is also possible for a country’s productive base to shrink during a period when GNP grows (this also will be confirmed when we come to study Table 2). The problem is that no one would notice the shrinking if everyone’s eyes were rivetted on GNP. If the productive base continues to shrink, economic growth will sooner or later stop and reverse sign. The standard of living will then decline, but no one would have suspected that a fall was in store. So, growth in GNP per head can encourage us to think that all is well, when it isn’t. Similarly, it is possible for a country’s Human Development Index (HDI) to increase even while its productive base shrinks (Table 2). This means that HDI too can mislead. The moral is telling: GNP (or for that matter, the Human Development Index (HDI)) is not a measure of long run human wellbeing, meaning that movements in GNP (or for that matter, HDI) are a poor basis for judging economic progress.
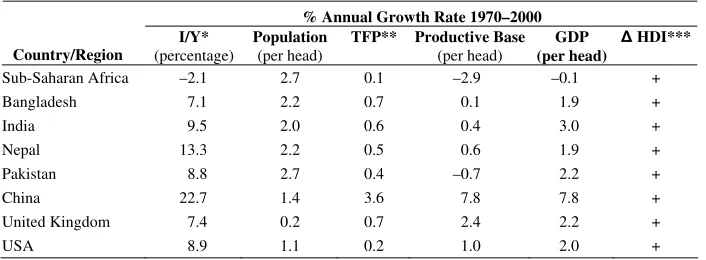
Table 2. The Progress of Nations
% Annual Growth Rate 1970–2000
* inclusive investment as a share of GDP (average over 1970–2000).
** total factor productivity.
*** change in HDI between 1970 and 2000.
Adapted from K. J. Arrow, P. Dasgupta, L. Goulder, G. Daily, P. R. Ehrlich, G. M. Heal, S. Levin, K.-G. Maler, S. Schneider, D. A. Starrett, and B. Walker, “Are We Consuming Too Much?”, Journal of Economic Perspectives,
2004, Vol. 18, No. 3, pp. 147–172.
In advocating HDI over GDP, UNDP (1994: 14–15) castigated those who regard GNP to be an index of an economy’s well-being on the ground that it is a measure of a country’s “opulence”. The criticism is faulty in two ways. First, opulence is a stock concept, and GNP is not a return on any index of opulence that I am aware of.4 Secondly, and more importantly, as we have just noted, it is not a mistake to seek to measure a society’s well-being in terms of an index of opulence. The point is not that opulence misleads, but rather that we should search for the right measure of opulence.
4
II. INSTITUTIONS: WHAT ABOUT THE RESIDUAL?
The aggregate output of an economy is produced by various factors of production. We can therefore decompose observed changes in output over time into its sources: how much can be attributed to changes in labour force participation, how much to accumulation of manufactured capital and human capital, how much to the accumulation of knowledge brought about by expenditure in research and development, how much to changes in the use of natural resources, and so on? If a portion of the observed change in output cannot be credited to any of the above factors of production, that portion is called the change in total factor productivity (TFP). Growth in TFP is known as the residual, to indicate that it is that bit of growth in output which cannot be explained.
Should wealth decline, could growth in TFP not compensate for the decline and ensure that longrun well-being is sustained? Traditionally, labour force participation, manufactured capital, and marketed natural resources have been the recorded factors of production. In recent years partial measures of human capital have been added. Attempts have also been made also to correct for changes in the quality of manufactured capital brought about by research and development. But national accounts mostly still do not include the use of non-marketed natural resources—nor, for that matter, non-marketed labour effort. They do not, for the understandable reason that shadow prices of non-marketed natural resources are extremely hard to estimate. Moreover, how do you estimate unrecorded labour effort? Now imagine that over a period of time the economy makes increasing use of the natural-resource base, or of unrecorded labour effort. The residual would be overestimated. In fact, a simple way to increase the residual would be to “mine” the natural-resource base at an increasing rate. But this would be a perverse thing to do if we seek to measure economic prospects.
What if it is possible to decompose the growth of an economy’s aggregate output in a comprehensive manner, by tracing the growth to the sources originating in all the factors of production? To assume that over the long run the residual could still be positive is to imagine that the country enjoys a “free lunch” (like manna from heaven). Is the latter a possibility? One way to enjoy a free lunch, for poor countries at least, is to use technological advances made in other countries without paying for them. The residual would then reflect increases in freely available knowledge. Note though that adaptation is not without cost. To meet local conditions, adjustments need to be made to product design and to the processes involved in production; all of which require appropriate local institutions, frequently missing in poor countries.
controls, and so forth). We would expect the factors of production to find better uses. As factors realign in more productive fashions, TFP would increase.
In the opposite vein, TFP could decline over a period. Increased government corruption could be a cause, or civil strife, which not only destroys capital assets, but also damages a country’s institutions—public or civic. When institutions deteriorate, assets are used even more inefficiently than previously: TFP declines.
III. WEALTH MOVEMENTS IN POOR COUNTRIES: HAS ECONOMIC DEVELOPMENT IN RECENT DECADES
BEEN SUSTAINABLE?
Recently, economists at the World Bank (Hamilton and Clemens, 1999) have estimated inclusive investment in different countries during the past few decades. They have done that by adding net investment in human capital to existing country-wide estimates of investment in manufactured capital, and then substracting disinvestments in natural capital from that sum. The economists used official estimates of net national saving as proxies for net investment in manufactured capital. For estimates of investment in human capital, they used expenditure on education as a proxy.5 To quantify disinvestments in natural capital, they considered net changes in the stocks of commercial forests, oil and minerals, and the quality of the atmosphere in terms of its carbon dioxide content. Oil and minerals were valued at their market prices minus extraction costs. The shadow price of global carbon emission into the atmosphere is the damage caused by bringing about climate change. That damage was taken to be $20 per tonne, which is in all probability a serious underestimate. Forests were valued in terms of their market price minus logging costs. Contributions of forests to ecosystem functions were ignored.
The World Bank’s list of natural resources is very incomplete. It doesn’t include water resources, fisheries, air and water pollutants, soil, and ecosystems. Their notion of human capital is inadequate because health does not enter the calculus. And their estimates of shadow prices are very very approximate. Nevertheless, one has to start somewhere, and their’s is a first pass at what is an enormously messy enterprise. What I want to do now is to study figures published recently by a group of ecologists and economists (Arrow et al., 2004), who adapted the World Bank estimates of inclusive investment and then went on to determine whether economic development in some of the major countries and regions has been sustainable in recent decades. Table 2 is a refinement of that publication. It remains a crude beginning to the study of sustainable development, but it’s a start.
5
The places in question are sub-Saharan Africa, Bangladesh, India, Nepal, and Pakistan (all poor countries); China (a middle income country); and UK and US (both rich countries). The period under study is 1970–2000. The first column of numbers in Table 2 consists of refinements of the World Bank’s estimates of average inclusive investment as a proportion of gross domestic product (GDP), expressed as percentages. The second column gives the average annual population growth rate. The third column gives estimates of annual growth rates of total factor productivity, which we are interpreting here as the annual percentage rate of change in a combined index of knowledge and institutions. I have used the figures in the first three columns to arrive at estimates of the annual percentage rate of change in the productive base per capita. They are given in the fourth column.
Before summarizing the findings, it will be useful to get a feel for what the numbers in the table are telling us. Consider Pakistan. During 1970–2000 inclusive investment as a proportion of GDP was 8.8% annually. Total factor productivity increased at an annual rate of 0.4%. As both figures are positive, we can conclude that Pakistan’s productive base was larger in year 2000 than it had been in 1970. But take a look at Pakistan’s population, which grew at a high 2.7% rate annually. The fourth column shows that Pakistan’s productive base per capita declined in consequence, at an annual rate of 0.7%, implying that in year 2000 it was about 80% of what it was in 1970.
In contrast, consider the US. Inclusive investment as a share of GDP there was 8.9% a year, which is only a tiny bit larger than Pakistan’s figure. Growth in total factor productivity (an annual 0.2%) was even lower than Pakistan’s. But population grew only at 1.1% a year, meaning that the productive base per capita of the US grew at an average annual rate of 1%. Economic development in the US was sustainable during 1970–2000, while in Pakistan it was unsustainable.
Interestingly, if you had judged their economic performances in terms of growth in GDP per capita, you would have obtained a different picture. As the fifth column of Table 2 shows, Pakistan grew at a respectable 2.2% rate a year, while the US grew at only 1.1% a year. If you now look at the sixth column, you will find that the United Nations’ Human Development Index (HDI) for Pakistan improved during the period. Movements in HDI tell us nothing about sustainable development.
declined. The table confirms that it did, at 2.9% annually. If you now look at the fifth column of numbers, you will discover that GDP per capita in sub-Saharan Africa remained pretty much constant. But the region’s HDI showed an improvement—confirming once again that studying movements in HDI enables us to say nothing about sustainable development.
Pakistan is the worst performer in the Indian sub-continent, but the remaining countries in the region just barely made it when judged in terms of sustainable development. Inclusive investment in each country (Bangladesh, India, and Nepal) was positive, as was growth in total factor productivity. The two together imply that the productive base expanded in each country. But population growth was so high, that the productive base per capita just about grew—at annual percentage rates 0.1, 0.4, and 0.6 respectively. Even these figures are most likely to be overestimates. The list of items the World Bank’s economists used in order to estimate inclusive investment didn’t include soil erosion and urban pollution, both of which are thought by experts to be problematic in the Indian sub-continent. Moreover, the human desire to reduce risk, mentioned earlier, implies that downside risks of natural capital degradation ought to be given a higher weight than a corresponding chance that things will turn out to be better than expected. So, if we allow for risk aversion, estimates of inclusive investment would be lowered. One cannot help suspecting that economic development in the Indian sub-continent was unsustainable during 1970–2000. But you wouldn’t know that from figures for GDP per capita and HDI there. The former grew in each country in the region and the latter improved.
Inclusive investment in China was 22.7% of GDP, a very large figure in the sample of countries in Table 2. Growth in total factor productivity was a high 3.6% annually. Population grew at a relatively low 1.4% annual rate. We shouldn’t be surprised that China’s productive base per capita expanded—as it happens, at 7.8% annually. Per capita GDP also grew at an annual rate of 7.8%, and HDI improved. In China, GDP per capita, HDI, and the productive base per head moved parallel to one another.
There is little to comment on the UK and US. Both are rich, mature economies. Inclusive investment during 1970–2000 was modest, but then so was population growth low. Growth in total factor productivity was low. Although the figures imply that the productive base per capita expanded in both countries, we should be circumspect because, as noted earlier, the World Bank costed carbon emissions at too low a rate. GDP per capita increased in both countries and HDI improved there.
a good deal below its true social cost (or negative shadow price). If we were instead to take the shadow price to be the not-unreasonable figure of $75 per tonne, all the poor countries in Table 2 would show a decline in their productive base per capita during 1970–2000. The message we should take away is sobering: Over the past three decades, sub-Saharan Africa (home to 750 million people today) has become poorer if judged in terms of its productive base per capita; and economic development in the Indian sub-continent (home to over 1.4 billion people today) was either unsustainable or just barely sustainable. That said, it would be wrong to conclude that people in poor countries should have invested more in their productive base by consuming less. The production and distribution of goods and services in poor countries are highly inefficient. It would be wrong to regard consumption and investment in the productive base there as competing for a fixed quantity of funds. Better institutions would enable people in the world’s poorest regions to both consume more and invest more (inclusively, of course!).
REFERENCES
Arrow, K.J., P. Dasgupta, L. Goulder, G. Daily, P.R. Ehrlich, G.M. Heal, S.A. Levin, K.-G. Maler, S. Schneider, D.A. Starrett, and B. Walker (2004), “Are We Consuming Too Much?”, Journal of Economic Perspectives, 18(1), 147–172.
Arrow, K.J., P. Dasgupta, L.H. Goulder, K. Mumford, and K. Oleson (2007), “China, the U.S., and Sustainability: Perspectives Based on Comprehensive Wealth”, Discussion Paper, Department of Economics, Stanford University.
Arrow, K.J., P. Dasgupta, and K.-G Mäler (2003a), “Evaluating Projects and Assessing Sustainable Development in Imperfect Economies.” Environmental and Resource Economics, 26(4), 647–685.
Arrow, K.J., P. Dasgupta, and K.-G. Mäler (2003b), “The Genuine Saving Criterion and the Value of Population.” Economic Theory 21(2): 217–225.
Dasgupta, P. (2001 [2004]), Human Well-Being and the Natural Environment. Oxford: Oxford University Press.
Dasgupta, P. and K.-G. Mäler (2000), “Net National Product, Wealth, and Social Well-Being,”
Environment and Development Economics, 5(1): 69–93.
Ehrlich, P.R. and L.H. Goulder (2007), “Is Current Consumption Compatible with Sustainability? A General Framework and Some Indications for the United States”,
Conservation Biology, 21(5), 1145–1154.
Hamilton, K. and M. Clemens (1999), “Genuine Savings Rates in Developing Countries”,
World Bank Economic Review, 13(2), 333–356.
UNDP (1994), Human Development Report (New York: Oxford University Press for the United Nations Development Programme).
WCED World Commission on Environment and Development (1987), Our Common Future