Fabrication and Properties of
Vegetable-Oil-Based Glass Fiber Composites by
Ring-Opening Metathesis Polymerization
Phillip H. Henna, Michael R. Kessler, Richard C. Larock*
Introduction
Energy, environmental, and societal concerns have increased the interest in utilizing renewable plant-based materials as feedstocks for polymeric materials, while reducing our dependence on a volatile and unstable petroleum market. Furthermore, many renewable plant-based materials are cheaper than petrochemicals.[1] In recent years, considerable attention has been paid on vegetable oils and derivatives as monomers to produce biobased polymers.[2]
Vegetable oil monomers are quite amenable to many different polymerization techniques, including free radical,[3]
step growth,[4] cationic,[5] and ring-opening metathesis
polymerization (ROMP).[6] The resulting biobased
poly-mers offer unique and promising properties encouraging the replacement of petrochemical-based materials in some applications. Some such applications, however, require the use of fiber reinforcement or other fillers to further enhance the mechanical properties.
Fiber-reinforced polymer (FRP) composites typically comprise discontinuous reinforcing fibers surrounded by a polymeric matrix, which binds with the reinforcing fibers so that the load is supported and transmitted through the material from fiber to fiber.[7]FRP composites find numerous applications in the aerospace, automotive, industrial, infrastructure, marine, military, and sports fields.[8] They have the advantage of being lightweight,
possessing good mechanical properties, being resistant to corrosion, and having a low assembly cost.[9]
Fiber-reinforced polymer (FRP) composites can employ either thermoplastic or thermosetting resins. For thermo-plastic FRPs, the molten polymer is blended with the fiber and molded into the desired shape at an elevated P. H. Henna, R. C. Larock
Department of Chemistry, Iowa State University, Ames, IA 50011, USA
Fax:þ1 515 294 0105; E-mail: [email protected] M. R. Kessler
Department of Materials Science and Engineering, Iowa State University, Ames, IA 50011, USA
Glass fiber biobased composites have been prepared by ROMP of a commercially available
vegetable oil derivative possessing an unsaturated bicyclic moiety, and DCPD. The resins and
the corresponding composites have been characterized thermophysically and mechanically.
Higher DCPD content yields materials with
temperature. Thermosetting resins are more commonly used as the polymeric matrix in FRP composites, since they are suitable for injection molding, because of their relatively low viscosity before cure. After the thermosetting resin is injected into a mold with the desired shape, the monomers are heated until crosslinking occurs, which entraps the fiber in the polymeric network.[10]
Vegetable oil-based thermosetting resins have recently been used to make composite materials. We have reported the preparation and characterization of regular and conjugated corn[11] and soybean[10] oil-based glass fiber (GF) composites, and conjugated soybean oil[12] and conjugated corn oil[13] clay nanocomposites by cationic polymeriza-tion. More recently, we have employed spent germ, a by-product from ethanol production, as a filler in a tung oil-based
composite.[14] Others have reported GF-reinforced
soy-bean-based polyurethanes,[15] natural and GF-reinforced
soybean phosphate ester polyurethanes,[16]and acrylated
epoxidized soybean oil composites comprising either butyrated kraft lignin[17]or natural fiber.[9,18]
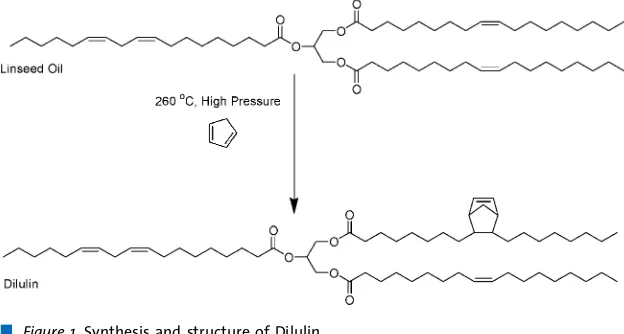
Dilulin is a commercially available oil from Cargill prepared by a high temperature, high pressure Diels-Alder reaction between linseed oil and dicyclopentadiene (DCPD), which cracks at the high temperature to form two molecules of cyclopentadiene (Figure 1).[19] Dilulin appears to be a 95:5 mixture of the modified oil, possessing an average of one bicyclic moiety per triglyceride, and DCPD oligomers.[6b]We have reported the ROMP of Dilulin
with DCPD (Figure 2) and other strained crosslinkers[20]to
produce unique thermosetting resins. Utilizing DCPD, soft and flexible resins have been prepared, with sample
flexibility increasing as the Dilulin content increased from 50 up to 100 wt.-% oil.[6b]Herein, we report the fabrication
and thermal and mechanical testing of short GF mat composites utilizing a Dilulin/DCPD resin. Differing ratios of Dilulin to DCPD have been explored, as has variation in the GF content.
Experimental Part
Materials
The Dilulin was a gift from Cargill (Minneapolis, MN, USA), which was used as received and stored in a refrigerator. DCPD (95%) was obtained from Acros (Geel, Belgium) and used as received. Grubbs second generation catalyst was obtained from Sigma-Aldrich (Milwaukee, WI, USA) and recrystallized by a procedure similar to that found in the literature[21]to allow better
dissolution in the resin. Reagent grade methy-lene chloride, stabilized with amymethy-lene, was obtained from Fisher (Fair Lawn, NJ, USA) and used as received. PTFE release agent (MS-122DF) was obtained from Miller-Stephenson Chemical Co. (Morton Grove, IL, USA). The short GF mat was a gift from Creative Composites (Brooklyn, IA, USA).
Fabrication of Dilulin/DCPD Resins and Composites
The resins have been prepared on an 80 g scale. To a 100 mL glass beaker was added the appropriate amount (30–60 wt.-%) of Dilulin. To this was added the appropriate amount (in Figure 1.Synthesis and structure of Dilulin.
wt.-%) of DCPD. The two monomers were stirred together at a high rotation speed in a fume hood. Then 0.125 wt.-% (based upon the entire resin mixture) of the catalyst was added slowly portion-wise to the stirring monomer. After all of the catalyst was added, the mixture was allowed to stir for a few minutes and then poured into a glass mold, which consisted of two 6 inch (length)4 inch (width) glass plates, clamped and separated by a 1/8 inch rubber gasket. The mold was then placed in a programmable oven (Yamato Scientific America; San Francisco, CA) and cured for 1 h at 658C and post-cured 3 h at 1508C. The resulting resins were yellow, transparent and varied from being hard and strong to soft and flexible. The nomenclature used is as follows. Dilulin is referred to as Dil and dicyclopentadiene is referred to as DCPD. A resin containing 40 wt.-% Dilulin and 60 wt.-% DCPD is designated Dil40-DCPD60.
The composites have been prepared by cutting the short GF chopped strand mat into 6 inch (length) 5 1/4 inch (width) sheets. The sheets of GF were weighed and then placed into a PTFE-coated 6 inch6 inch steel mold, containing two 63/81/8 in3
(lengthwidththickness) spacers on opposite sites. The uncured resin (140 g) was poured onto the GF to ensure complete wetting. The top of the mold (also PTFE-coated) was then put in place and the mold placed into a preheated press (Carver; Wabash, IN, USA) at 658C. Enough pressure was applied to allow some resin to be expelled out of the crevasses of the mold. When gelation onset was observed, the pressure was increased to 325 psi. This temperature and pressure were maintained for 1 h. The mold was then removed from the press and post-cured under atmospheric pressure in an oven for 3 h. After post-cure, the composite was allowed to cool and then weighed to determine the wt.-% of GF. The resulting composites were yellow, translucent, and harder than the corresponding pure resins. In this study, when the resin composition of the composite was changed, a constant GF loading of approximately 40 wt.-% was used. The nomenclature employed for a composite with a resin composition of 60 wt.-% Dilulin and 40 wt.-% DCPD is Dil60-DCPD40c.
Characterization Soxhlet Extraction
Soxhlet extraction has been carried out on the pure resins and composites. Typically, a 2.5 g specimen has been placed into a cellulose thimble and refluxed in methylene chloride at a temperature of 608C. After extraction, the insoluble portion was dried in a vacuum oven overnight at 708C and then weighed.
SEM
SEM analysis has been carried out using a Hitachi S-2460 N (Japan) variable pressure electron microscope at an accelerating voltage of 20 kV under a helium environment of 60 Pa to examine the morphology of the fracture surfaces of the composites after tensile testing.
Dynamic Mechanical Analysis
Dynamic mechanical analysis (DMA) has been carried out on a Q800 DMA (TA Instruments; New Castle, DE) instrument in a three point bending mode with an amplitude of 25mm, a preload force
of 0.0100 N, and a force track of 150%. The frequency used was 1 Hz. Specimens were cut into rectangular shapes with a geometry of 20101.8 mm3(length
widththickness). Each specimen was cooled to608C and held isothermally at that temperature for 3 min. The sample was then heated at 38Cmin1to 250
8C. Only non-solvent-extracted specimens were tested.
Tensile Tests
Tensile tests were performed at 258C, according to ASTM standard D638, using an Instron universal testing machine (model 4502) at a crosshead speed of 5 mmmin1
. The dogbone-shaped test specimen (type I specimen ASTM D638) had a gauge section with a length of 57 mm, a width of 12.5 mm, and a thickness of 3 mm. Only non-solvent-extracted specimens were tested.
Thermogravimetric Analysis
Thermogravimetric analysis (TGA) of the samples was performed on both the pure resins and the composites. An approximately 10 mg specimen was heated in air from room temperature to 6508C at a heating rate of 208Cmin1. Only non-solvent-extracted
specimens were tested.
Results and Discussion
Extraction Analysis of the Resins
The pure thermosetting resins prepared varied from 40 wt.-% (Dil60-DCPD40) up to 70 wt.-% (Dil30-DCPD70) DCPD. All of the thermosetting resins are transparent with a yellow tint. As the concentration of DCPD increases in the feed ratio, the resins go from being soft and weak to quite hard and strong. Entries 1–4 in Table 1 show the Soxhlet extraction analysis of these thermosetting resins. The soluble portion decreases from 17 to 10 wt.-% as the DCPD concentration increases from 40 to 70 wt.-%. These extracts appear to be mixtures of oligomers of Dilulin, DCPD oligomers, and unreacted triglyceride oil[6b] (1H NMR
spectrum not shown). The soluble portion appears to act as a plasticizer, which softens the resin. The plasticizer (soluble portion) and the increased amount of the flexible triglyceride monomer, containing fatty ester side chains that internally plasticize the resin, are responsible for the increased flexibility of the thermosetting resin with increase in the Dilulin content.[22,23]
Thermophysical Properties of the Resins
taken as the maximum peak height of the tand curve. Entries 1–4 in Table 1 and Figure 3 show theTgvalues of
the pure resins. As the concentration of DCPD increases in the crosslinked thermosets, theTgincreases substantially
from 21 to 768C, due to the increased degree of cross-linking and the crosslink density (Table 1) provided by the DCPD.[24]The experimental crosslink densities (ye) have
been calculated at 1008C above the Tg in the rubbery
plateau of the storage modulus curve using the following equation:
E0¼3yeRT
where E0 is the storage modulus in Pa, y
e the crosslink
density, R the gas constant, and T is the absolute temperature in K.[25]Also, the increased flexible
triglycer-ide incorporation and the slightly greater soluble fraction
in the resins possessing more oil lead to a plasticizing effect, softening the resins and hence lowering theTg. The
tan dcurves are much taller and narrower when more DCPD is used, indicating that these resins result in a more homogeneous network.[26]This is interesting, since
cross-linking usually broadens the tan d curve. However, it appears that the Dilulin, with its randomly placed norbornene-like groups in the fatty ester chains, causes a rather heterogeneous network in the backbone. When the Dilulin is decreased, the heterogeneity may be reduced as well. In addition, some of the tand curves with less DCPD have a smaller peak or shoulder at higher temperatures. This points to phase separation in these resins.
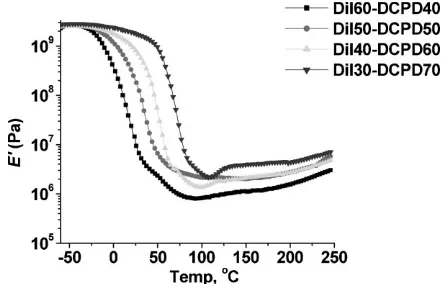
Table 1 (entries 1–4) also shows the room temperature storage modulus (E0) values for these resins. As the DCPD
content of the resin increases, the room temperature storage modulus values increase from 10 to 1 769 MPa. Since the storage modulus is a measure of the stiffness of a sample,[27] it is expected that samples possessing less
flexible triglyceride oil and more rigid DCPD crosslinker would have higher storage modulus values than those samples with higher amounts of oil and less crosslinker. Figure 4 shows the storage modulus curves for these resins. There is a substantial decrease in storage modulus between 0 and 758C that is indicative of the primary relaxation (Ta) peak related to energy dissipation. This is also shown in Figure 3 with the tandpeaks passing though a maximum in this region. The rubbery plateau modulus increases with increasing DCPD content as evidenced in Figure 5. This can be explained by the fact that resins with more DCPD have fewer free dangling side chains in the polymer network and a lower molecular weight between crosslinks (Mc), providing a more rigid material.[26]
Figure 3.Tandcurves for the pure resins.
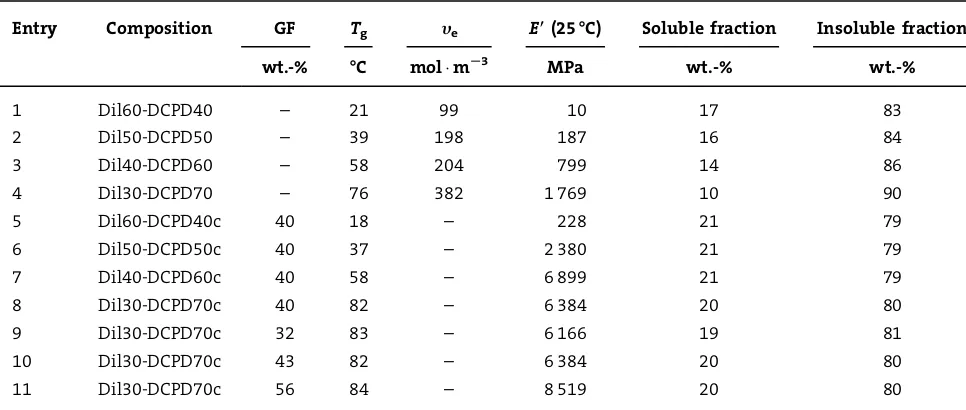
Table 1.DMA and extraction analysis for the pure resins and composites.
Entry Composition GF Tg ye E((25-C) Soluble fraction Insoluble fraction
wt.-% -C molmS3 MPa wt.-% wt.-%
1 Dil60-DCPD40 – 21 99 10 17 83
2 Dil50-DCPD50 – 39 198 187 16 84
3 Dil40-DCPD60 – 58 204 799 14 86
4 Dil30-DCPD70 – 76 382 1 769 10 90
5 Dil60-DCPD40c 40 18 – 228 21 79
6 Dil50-DCPD50c 40 37 – 2 380 21 79
7 Dil40-DCPD60c 40 58 – 6 899 21 79
8 Dil30-DCPD70c 40 82 – 6 384 20 80
9 Dil30-DCPD70c 32 83 – 6 166 19 81
10 Dil30-DCPD70c 43 82 – 6 384 20 80
Mechanical Testing of the Resins
The mechanical properties of the pure resins are shown in entries 1–4 in Table 2. The ultimate tensile strengths (smax)
for these resins increase from 0.5 to 29 MPa as the DCPD content increases and the sample decreases in flexibility. The value of 29 MPa for the Dil30DCPD70 sample is similar to the smax for some high density polyethylene
speci-mens.[28]Figure 5 shows the stress versus strain curves for
all of the samples. The Dil30-DCPD70 sample has a yield point and looks to be the only hard sample. The other samples are relatively soft, which explains why the Young’s modulus (E) for these thermosetting resins decreases substantially from 525 to 0.9, when decreasing the DCPD content from the Dil30-DCPD70 composition to the Dil60-DCPD40 composition. This is expected, since hard and strong samples (Dil30-DCPD70) have higher modulus (elastic deformation) values than soft and weak samples (Dil60-DCPD40), which have low modulus values. The samples with 40 and 50 wt.-% oil lie in between, yet have relatively low Young’s modulus values.
The percent elongation at break (eb) values given in Table 2 for entries 1–4 show that the hard and strong (Dil30-DCPD70) resin extends to about 35% of its original length before breaking. The other samples containing 40– 60 wt.-% Dilulin have greaterebvalues, due to less DCPD crosslinker, which inhibits polymeric chain movement. The 40 wt.-% Dilulin sample did not break, and the value in theebcolumn is how far the sample extended before the instrument stopped testing. The toughness (defined as the area under the stress/strain curve) does not follow any general trend from resin to resin. However, the resins with more DCPD have a greater toughness than those samples with less DCPD (6.7 MPa for Dil30-DCPD70 vs. 0.42 MPa for Dil60-DCPD40). This points to the increased crosslinking ability of DCPD, which helps to resist fracture and improve toughness.
Figure 5.Stress versus strain curves for the pure resins.
Table 2.Mechanical properties of the pure resins and composites.
Entry Composition GF smax E Toughness
wt.-% MPa MPa % MPa
1 Dil60-DCPD40 – 0.5W0.1 0.91W0.1 138W12 0.4W0.1
2 Dil50-DCPD50 – 1.0W0.1 27W5 132W15 1.1W0.2
3 Dil40-DCPD60 – 7.0W0.1 68W11 156.0W0.1 8.1W0.1
4 Dil30-DCPD70 – 29.0W0.3 525W45 35W7 7W1
5 Dil60-DCPD40c 40 29.0W0.1 680W169 14W1 2.7W0.3
6 Dil50-DCPD50c 40 46W4 615W98 16W2 4W1
7 Dil40-DCPD60c 40 68W37 1 061W209 10W1 5W1
8 Dil30-DCPD70c 40 145W7 1 510W94 12W2 8W1
9 32 wt.-% GF 32 91W7 1 071W92 10.0W0.2 5.0W0.3
10 43 wt.-% GF 43 148W4 1 545W61 12W2 8W1
11 56 wt.-% GF 56 168W7 1 576W46 12W1 10W1
Extraction Analysis of the Composites
The incorporation of chopped strand GF into the various resins results in composites having an opaque yellow color. As the concentration of DCPD decreases in the resin, the composite becomes less stiff with the Dil60-DCPD40c composite possessing considerable flexibility. The compo-sites show an overall decrease in the insoluble portion (Table 1, entries 5–8), indicating that the presence of GF did hinder the polymerization and crosslinking of the resins. The latter interpretation is supported by data for composites where a greater concentration of DCPD has been used. Interestingly, all of the resins with different crosslinker content have approximately the same inso-luble portion of around 80%. Variation of GF using the same resin results in composites that have the same insoluble portion (approximately 80%) as shown in entries 9–11 in Table 1.
Thermophysical Properties of the Composites
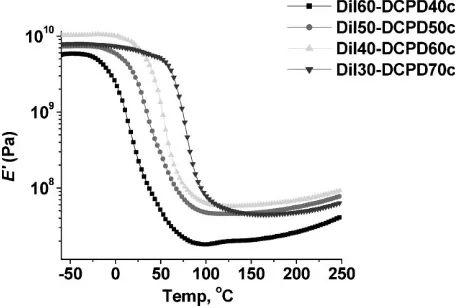
Figure 6 and entries 5–8 in Table 1 show the increase inTg
from 18 to 828C for composites with approximately 40 wt.-% GF, as the concentration of DCPD in the resin increases from Dil60-DCPD40c to Dil30-DCPD70c. This was expected, since a similar trend was seen in the pure resin. In addition to this, the Dil50-DCPD50c and Dil60-DCPD40c composites have shoulder peaks on the tan d curves, indicating some phase separation. Also seen is an increase in room temperature storage modulus values from 228 to 6 384 MPa with increased amounts of DCPD, which was also observed earlier with the pure resins. The slight increase in storage modulus value in going from the Dil40-DCPD60c composite to the Dil30-DCPD70c composite is so small that we attempt no explanation. The storage modulus curves for the composites (Figure 7) also go through the same
dramatic decrease between 0 and 758C and have the same trend in the rubbery plateau as was seen with the pure resins.
Mechanical Properties of the Composites
Entries 5–8 in Table 2 show the mechanical properties of these composites with different Dilulin concentrations and a constant GF content of 40 wt.-%. Thesmax values
increase from 29 to 145 MPa with increasing content of DCPD as expected due to the greater content of the more rigid DCPD crosslinker incorporated into the thermoset, less oil in the backbone of the polymeric matrix, and less of the plasticizing soluble fraction – all of which result in a softer composite. With the exception of the 60 wt.-% sample,E values increase with increasing DCPD content (680 MPa with the Dil60-DCPD40 composite to 1 510 MPa with the Dil30-DCPD70 composite). The Dil60-DCPD40 composite does have a margin of error that may place it in line with the expected trend. As mentioned previously, the hard and strong Dil30-DCPD70 resin exhibits a higher modulus value than the softer resins with 40 wt.-% or more of the oil.
There is no real trend in theebvalues for these samples. However, they only differ by a small amount. This indicates that increasing the oil content does not significantly impact the eb value when GF is used. The toughness of these samples increases from 2.7 to 7.6 MPa with increasing amounts of DCPD. Again composites with more DCPD crosslinker are better at resisting fracture.
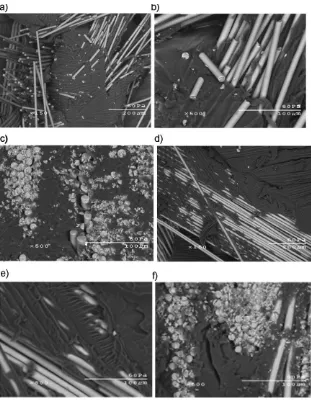
Morphology Analysis of the Composites
Figure 8 shows the SEM images for the Dil30-DCPD70c and Dil60-DCPD40c composites, both of which contain Figure 7. Storage moduli for composites with a GF loading of approximately 40 wt.-%.
approximately 40 wt.-% GF. It is evident that the composites consist of two phases: a polymer matrix phase and a GF phase. The resin appears to have penetrated between and wetted the fibers as shown by the striations (images A and D) in the resin where GFs were before tensile testing and fracture. However, the images show a weak adhesion between the polymer matrix and GFs, as evidenced by the absence of resin on the clean surface of the GFs after fracture. Image A (Dil30-DCPD70c) has many small broken fiber fragments scattered about on the fracture surface. This points to the greater degree of crosslinking with this resin, which may prevent the fiber from pulling out of the polymer matrix causing the fiber to break apart. There are little to none of these broken fragments present when the resin is less crosslinked (Dil60-DCPD40c), as shown in image D. Images C and F are
cut away views of the composite. It can be seen that the polymer matrix in the less crosslinked Dil60-DCPD40c composite (image F) has a fracture and is weaker, whereas the higher crosslinked Dil30-DCPD70c polymer matrix (image C) does not have any fracture in the matrix phase.
Comparison of the Thermophysical Properties for the Pure Resins and Composites
In comparing the Tgs of the resins to the composites
(Table 1), it can be seen that the incorporation of GF does not increase theTgto any significant extent for any of the
resins. However, the tandvalues do decrease in value with GF incorporation. This is expected, because incorporation of GF increases the stiffness of the specimen, while at the same time reducing the content of the polymer matrix.
Incorporation of the GF creates a much more rigid and stiff sample when com-pared to the pure resin. The result of this is increased room temperature storage modulus values as shown in Table 1. The sample with 60 wt.-% oil had about a 20-fold increase in room temperature storage modulus (10.21–228 MPa). When looking at the rubbery plateau region at 1758C (Figure 4 and 7), it can be seen that the storage modulus values increase by an order of magnitude for the compo-sites, indicating that the GF reduces the deformability of the composites.[10] Gen-erally speaking, these thermophysical properties follow what is expected when comparing composites to the correspond-ing resins.
Comparison of the Mechanical Properties for the Pure Resins and Composites
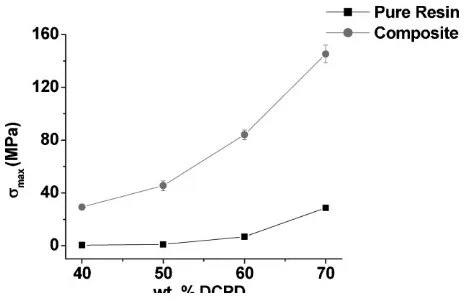
The incorporation of GF into the resins substantially increases thesmax values.
In each of the different resins, incorpora-tion of 40 wt.-% GF resulted in much stronger materials (28.7–145.2 MPa for the Dil30-DCPD70 system). Even the Dil60-DCPD40c composite, whose resin had a rather low smax value, saw a
61-fold increase insmaxupon addition of
the GF. Figure 9 shows this increase in smaxfor the composites when compared
to the resins. Figure 9 also shows the increase insmaxas the DCPD
concentra-tion is increased for both the pure resins and composites.
The Young’s modulus (E) also increases with the incorporation of GF. This was expected, since GF imparts stiffness and rigidity to the material, resulting in such an improvement. Figure 10 shows the increase inEfor the GF composites, when compared to the pure resins. The effect of GF incorporation on E is quite large for the Dil50-DCPD50c to Dil30-DCPD70c composites, and dramatic for the Dil60-DCPD40c composite, which saw a 74.625% increase inE.
The percent elongation at break (eb) decreases with the incorporation of GF (Figure 11). This was especially noticeable with the samples containing 40–60 wt.-% of DCPD, where decreases in %ebof approximately 147% are seen. There is hardly any correlation between toughness and GF content other than the fact that the Dil50-DCPD50c and Dil60-DCPD40c composites seem to have their toughness improved more with the presence of GF than the Dil30-DCPD70c and Dil40-DCPD60c composites (Table 2, entries 5–8). The presence of the GF in the Dilulin rich Dil50-DCPD50c and Dil60-DCPD40c composites helps
to transfer the load from the weaker resin to the stronger GF, reducing crack propagation and ultimately fracture.[29]
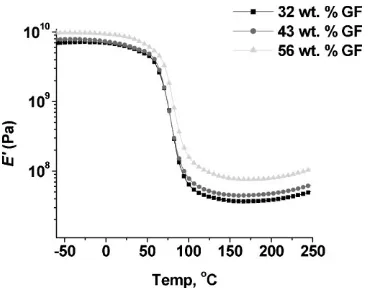
Thermophysical Properties at Various Glass Fiber Loadings
It can be seen in Table 1, entries 9–11, that the GF content does not impact theTgof the composite. However, a small
decrease in the tandcan be seen with the composite that has 56 wt.-% GF, as shown in Figure 12. As the GF content is increased, less resin is incorporated in the final material and less segmental mobility results, giving the lower tan d value. Storage modulus values at room temperature show a dependence on the GF content as seen in Table 1, entries 9–11. As the GF content is increased, so to does the storage modulus value. This points to the added rigidity that more GF adds, giving way to reduced flexibility. Figure 13 shows the storage modulus curves for various GF loadings. The greater the GF loading, the greater the
Figure 10.Young’s modulus comparison for the pure resins and composites at 40 wt.-% GF.
Figure 11.Percent elongation at break comparison for the pure resins and composites at 40 wt.-% GF.
Figure 12.tandcurves for various GF loadings. Figure 9.Tensile strength comparison for the pure resins and
storage modulus in the rubbery plateau region, due to the greater stiffness of the GF.
Mechanical Properties at Various Glass Fiber Loadings
The effect of GF content has been explored using the resin containing 30 wt.-% oil. A low (32 wt.-%), medium (43 wt.-%), and high (56 wt.-%) amount of GF incorporation has been explored. Table 2, entries 9–11, and Figure 14 show that increasing the amount of GF in the resins results in an increase insmaxvalues, with the more resin rich 32 wt.-%
GF composite having asmaxvalue of 91 MPa and the 56
wt.-% GF composite having asmaxvalue of 168 MPa. TheE
values have also been examined and found to increase with increasing GF content (Table 2, entries 9–11, and Figure 15). The values ofEare greater when the composite has 43 and 56 wt.-% GF. When 32 wt.-% GF is used, the composite is richer in resin, rather than GF, giving the lowerEvalue.
Percent elongation at break (eb) values slightly increased from 10 to 12% when increasing the GF content, which was unexpected (Table 2, entries 9–11). However, we view this
increase as negligible and insufficient to claim that increased GF content causes an increased %eb. Figure 16 shows how the toughness, on the other hand, did increase significantly with increasing GF content (5–10 MPa). With more GF present, the propensity of the composite to fracture can be reduced, contributing to the increased toughness.[30]
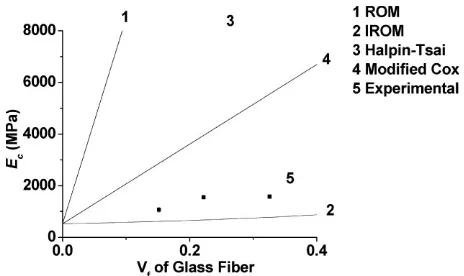
Calculations have also been carried out to see how the moduli (from tensile testing) of the composites with varying GF content compare with different theoretical models. The upper and lower bounds are estimated using the rule of mixtures (iso-strain)[31](Equation (1)) and the inverse rule of mixtures (iso-stress) (Equation (2)).[32]The rule of mixtures (ROM) equation for determining the theoretical composite modulus (Ec) is as follows:
Ec¼EfVfþEmð1VfÞ (1)
whereEfis the fiber modulus,Emthe matrix modulus, and
Vfis the fiber volume fraction. The inverse of the rule of
Figure 13.Storage moduli of composites with various GF loadings.
Figure 14.Tensile strength at various GF loadings using the Dil30-DCPD70 resin.
Figure 15. Young’s modulus at various GF loadings using the Dil30-DCPD70 resin.
mixtures (ROM) is given by the following equation:
whereEfis the fiber modulus,Emthe matrix modulus, and
Vf is the fiber volume fraction. Both of these equations,
however, represent a rather idealized situation. Therefore, the Halpin-Tsai Equation (3) for randomly oriented fibers and the Cox Equation (6) for nonaligned short fibers have also been plotted.[33] The Halpin-Tsai expression is
given by
wherejis 2l/Dfor the fiberand
hL¼
The Cox equation for nonaligned fibers is given by
Ec¼hoh1EfVfþEmð1VfÞ (6)
The factorhois an efficiency factor and has a value of 1/5
for randomly oriented fibers.
It can be seen from Figure 17 that the composites prepared in this work with different GF loadings fall short of both the Halpin-Tsai and Cox models. We feel this is mainly due to the poor interaction between fiber and resin shown earlier in the SEM images in Figure 8, which results in low load transfer between fibers and much less reinforcement than predicted by the models.
Thermogravimetric Analysis
Figure 18 shows the TGA curves for the pure resins in air. All of the curves have a similar three stage degradation. All
of the resins are thermally stable up to 2008C. The first region of degradation, between 200 and 4008C, represents degradation of the soluble materials. Hence, it can be seen that samples with less soluble fraction do not lose as much mass in this region as do samples with more soluble fraction. The second stage is between 400 and 5008C and represents degradation of the bulk polymer, also known as Tmax.[34]The third stage (between 500 and 6508C) consists
of a short lived plateau whose height in terms of wt.-% is greater when greater amounts of DCPD are present in the thermoset. Degradation in the third stage is that of the char, which remains behind.
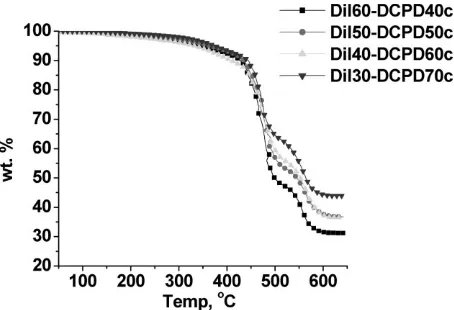
Figure 19 shows that the composites with varied resin compositions also follow a similar degradation to that of the pure resins. This indicates poor adhesion between resin and GF, which has been established by SEM analysis. The presence of GF does not seem to influence the degradation mechanism. The degradation curves for the composites with different GF loadings are similar to the composites at constant GF loading (figure not shown).
Figure 17.Theoretical models for the Dil30-DCPD70 composites at various GF loadings.
Conclusion
A commercially available modified vegetable oil, Dilulin, has been successfully copolymerized by ROMP with DCPD in the presence of GF to make promising composites. SEM analysis of the surface morphology has revealed a weak adhesion between the fiber and the polymeric matrix. The thermophysical and mechanical properties of the resins and the corresponding composites have been compared. Both are found to increase inTg,E0,smax,E, and toughness
as the DCPD content is increased. The GF content did not impact the Tg values, but did increase the E’ values as
shown in the room temperature values and theE’curves. The presence of 40 wt.-% GF improved the mechanical properties when compared to the corresponding pure resins. As an example, thesmaxandEvalues for the
Dil30-DCPD70 resin increased from 29 to 145 MPa and from 525 to 1 510 MPa, respectively. The percent elongation at break (eb) was found to decrease in the presence of the GF. Increasing the amount of GF in the Dil30-DCPD70 system from 32 to 56 wt.-% resulted in thesmaxvalue increasing
from 91 to 168 MPa and theEvalue increasing from 1 071 to 1 576 MPa. The toughness also increased with increasing GF content due to the ability of the GF to inhibit crack propagation and fracture. TGA of these resins revealed that the presence of GF did not alter the degradation mechanism of the polymeric matrix. Both the resins and the composites undergo maximum degradation (Tmax)
between 400 and 5008C. Theoretical models, such as the Halpin-Tsai and Cox equations, for random short fibers further illustrate the weak interaction between resin and fiber as seen by the high predicted E values. We shall examine the use of coupling agents to improve the GF/ resin interaction. In addition, other GF architectures will be explored with this resin system.
Acknowledgements: We would like to thank theDepartment of Education’s GAANN fellowship for financially supporting this research,Cargillfor the donation of Dilulin, Dr.Jay-Lin Janefrom the Department of Food Science and Human Nutrition at Iowa State University for use of the Instron for mechanical testing, and Craig Shorefrom Creative Composites for the donation of the short GF mat.
Received: July 8, 2008; Revised: September 20, 2008; Accepted: September 22, 2008; DOI: 10.1002/mame.200800202
Keywords: composites; glass fibers; mechanical properties; re-newable resources; ring opening metathesis polymerization (ROMP)
[1] H. Uyama, M. Kuwabara, T. Tsujimoto, S. Kobayashi, Bioma-cromolecules2003,4,211.
[2] ‘‘Feedstocks for the Future: Renewables for the Production of Chemicals and Materials’’,J. J. Bozell, M. K. Patel, Eds., ACS Symposium Series 921, American Chemical Society, Washington DC 2006.
[3] [3a] J. Ku, R. P. Wool,Polymer2005,46,71; [3b] M. Mosie-wicki, M. I. Aranguren, J. Borrajo,J. Appl. Polym. Sci.2005,97, 825; [3c] M. Valverde, D. Andjelkovic, P. P. Kundu, R. C. Larock, J. Appl. Polym. Sci.2008,107, 423; [3d] P. H. Henna, D. D. Andjelkovic, P. P. Kundu, R. C. Larock,J. Appl. Polym. Sci.2007, 104,979.
[4] [4a] G. Lligadas, J. C. Ronda, M. Galia`, V. Cadiz, Biomacromo-lecules2007,8,686; [4b] Z. S. Petrovic´, W. Zhang, A. Zlatanic´, C. C. Lava, M. Ilavsky´,J. Polym. Environ.2002,10,5. [5] [5a] F. Li, R. C. Larock,J. Appl. Polym. Sci.2001,80,658; [5b] F.
Li, M. V. Hanson, R. C. Larock,Polymer2002,42,156; [5c] D. D. Andjelkovic, R. C. Larock, Biomacromolecules 2006, 7, 927; [5d] D. D. Andjelkovic, M. Valverde, P. Henna, F. Li, R. C. Larock,Polymer2005,46,9674.
[6] [6a] P. H. Henna, R. C. Larock,Macromol. Mater. Eng.2007, 292,1201; [6b] P. H. Henna, R. C. Larock,J. Appl. Polym. Sci. submitted.
[7] N. Shahid, R. G. Willate, A. R. Barron,Compos. Sci. Technol. 2005,65,2250.
[8] J. Nickel, U. Riedel,Mater. Today2003,6,44.
[9] S. N. Khot, J. J. LaScala, E. Can, S. S. Morye, G. I. Williams, G. R. Palmese, S. H. Kusefoglu, R. P. Wool,J. Appl. Polym. Sci.2001, 82,703.
[10] Y. Lu, R. C. Larock,Macromol. Mater. Eng.2007,292,1085. [11] Y. Lu, R. C. Larock,J. Appl. Polym. Sci.2006,102,3345. [12] Y. Lu, R. C. Larock,Biomacromolecules2006,7,2692. [13] Y. Lu, R. C. Larock,Macromol. Mater. Eng.2007,292,863. [14] D. P. Pfister, J. R. Baker, P. H. Henna, Y. Lu, R. C. Larock,J. Appl.
Polym. Sci.2008,108,3618.
[15] S. Husic´, I. Javni, Z. S. Petrovic´,Compos. Sci. Technol.2005,65, 19.
[16] [16a] J. P. Latere Dwan’Isa, A. K. Mohanty, M. Misra, L. T. Drzal, J. Mater. Res.2004,39,2081; [16b] J. P. Latere Dwan’Isa, A. K. Mohanty, M. Misra, L. T. Drzal,J. Mater. Res.2004,39,1887. [17] W. Thielemans, R. P. Wool,Compos. Part A2004,35,327. [18] A. O’Donnell, M. A. Dweib, R. P. Wool,Compos. Sci. Technol.
2004,64,1135. Figure 19.Thermal degradation of the composites with 40 wt.-%
[19] US 6 420 322 (2002), inv.: D. R. Kodali.
[20] T. C. Mauldin, K. Haman, X. Sheng, P. Henna, R. C. Larock, M. R. Kessler,J. Polym. Sci., A: Polym. Chem.2008,46,6851. [21] A. S. Jones, J. D. Rule, J. S. Moore, S. R. White, N. R. Sottos,Chem.
Mater.2006,18,1312.
[22] A. Zlantic, Z. S. Petrovic, K. Dusek,Biomacromolecules2002,3, 1048.
[23] A. S. Wilson, ‘‘Plasticizers: Principles and Practice’’,Cambridge University Press, Cambridge 1995.
[24] S. L. Rosen, ‘‘Fundamental Properties of Polymeric Materials’’, 2ndedition,John Wiley and Sons, New York 1993.
[25] [25a] P. J. Flory, ‘‘Principles of Polymer Chemistry’’,Cornell University Press, Ithaca 1953; [25b] I. M. Ward, ‘‘Mechanical Properties of Solid Polymers’’,Wiley Interscience, New York 1971.
[26] T. W. Pechar, G. L. Wilkes, B. Zhou, N. Luo,J. Appl. Polym. Sci. 2007,106,2350.
[27] K. P. Menard, ‘‘Dynamic Mechanical Analysis: A Practical Introduction’’,CRC Press, Boca Raton 1999.
[28] A. M. Howatson, P. G. Lund, J. D. Todd, ‘‘Engineering Table and Data’’,Chapman and Hall, London 1991.
[29] T. A. Osswald, G. Menges, ‘‘Materials Science of Polymers for Engineers’’,Hanser, Cincinnati 2003.
[30] A. Pegoretti, T. Ricco,Compos.: Part A2002,33,1539. [31] W. D. Callister, ‘‘Materials Science and Engineering: An
Intro-duction’’,Wiley, New York 2003.
[32] W. K. Goertzen, M. R. Kessler,Compos. Part A2008,39,761. [33] J. N. Colemant, U. Khan, W. J. Blau, Y. K. Gun’Ko,Carbon2006,
44,1624.