Full Terms & Conditions of access and use can be found at
http://www.tandfonline.com/action/journalInformation?journalCode=vjeb20
Download by: [Universitas Maritim Raja Ali Haji] Date: 11 January 2016, At: 20:38
Journal of Education for Business
ISSN: 0883-2323 (Print) 1940-3356 (Online) Journal homepage: http://www.tandfonline.com/loi/vjeb20
Are MFT-B Results Biased Because of Students
Who Do Not Take the Test?
Magali Valero & Claudia Kocher
To cite this article: Magali Valero & Claudia Kocher (2014) Are MFT-B Results Biased Because of Students Who Do Not Take the Test?, Journal of Education for Business, 89:4, 171-177, DOI: 10.1080/08832323.2013.825572
To link to this article: http://dx.doi.org/10.1080/08832323.2013.825572
Published online: 02 May 2014.
Submit your article to this journal
Article views: 52
View related articles
CopyrightC Taylor & Francis Group, LLC ISSN: 0883-2323 print / 1940-3356 online DOI: 10.1080/08832323.2013.825572
Are MFT-B Results Biased Because of Students
Who Do Not Take the Test?
Magali Valero and Claudia Kocher
University of Michigan-Dearborn, Dearborn, Michigan, USA
The authors study the characteristics of students who take the Major Field Test in Business (MFT-B) versus those who do not. The authors find that students with higher cumulative grade point averages (GPAs) are more likely to take the test. Additionally, students are more likely to take the test if it is offered late in the semester. Further results indicate that students with higher GPAs tend to score better on the MFT-B, and thus the outcomes profile of a school based on MFT-B results may appear stronger than it actually is if taking the test is not a requirement of the business program.
Keywords: assessment, business majors, ETS, MFT, motivation
Business schools face increasing demands from accreditors and stakeholders, such as students, parents, government, and taxpayers, for assessment of student learning. In 2003 the Association to Advance Collegiate Schools of Business (AACSB) adopted a new set of standards for accreditation that increased emphasis on assessment. This new set of stan-dards was a response to the increasing demands for account-ability in higher education.
Assessment of core business knowledge is a key compo-nent of most business program assessment plans. As part of their assessment program, many schools use the Educational Testing Service (ETS) Major Field Test in Business (MFT-B) to assess student learning related to core business knowledge. Recently, Kelley, Tong, and Choi (2010) reported that 55% of AACSB business schools use the MFT-B. A challenge for academic programs using MFT-B is motivating students to put forth their best effort. Students may view achievement tests as a task and may have no incentive to perform well (De-Mong, Lindgren, & Perry, 1994). Allen and Bycio (1997) find that students perform better on the MFT-B when their score counts toward a course grade as compared to when students were asked to take the test during class time without it count-ing toward their grade. In further analysis, Bycio and Allen (2007) found student motivation to be significantly related to MFT-B performance.
Correspondence should be addressed to Magali Valero, University of Michigan-Dearborn, Department of Accounting and Finance, 19000 Hub-bard Drive, Dearborn, MI 48126, USA. E-mail: [email protected]
A second issue related to motivation when using the MFT-B is getting students to show up to take the test. Whether students show up to take the test or not depends on the incen-tives to take the test, as well as on the consequences of not taking the test. For instance, Bielinska-Kwapisz, Brown, and Semenik (2012b) reported that the college used in their study administered the MFT-B every semester to every graduating senior since summer 2005, and students were required to take the test to pass the course. In Mirchandani, Lynch, and Hamilton (2001) the MFT-B was given as a requirement to graduating students enrolled in the Business Policy course. In these instances, one would expect all students to show up to take the test. Some schools tie MFT-B performance to a course grade but do not require it for graduation. Bycio and Allen (2007) reported that all graduating business majors were asked to take the MFT-B. To enhance student motivation they (a) told students that their performance would account for 20% of their capstone course grade and (b) informed stu-dents about the importance of AACSB reaffirmation. Of the 185 graduating majors, 162 (88%) took the test. Thus, even in the case where the course grade is linked to test performance, some students may still not take the test. In addition, there might be reluctance to tie MFT-B score to the course grade, as some academics argue that there is a fairness issue in grad-ing students on MFT questions when these were not covered in the course whose grade is affected. Also, some MFT-B questions may not have been covered in the core curriculum. Eliminating the practice of tying MFT-B performance to a course grade improves the fairness of the process but may increase the problem of students not showing up to take the
172 M. VALERO AND C. KOCHER
test. While making the MFT-B a requirement for graduation solves the issue of non-attendance to the test, it also raises costs for the college significantly, as now every student is to be tested. Mason, Coleman, Steagall, and Gallo (2011) esti-mated the opportunity cost of administering the test at their institution to exceed$25,000 annually. If the test is not a re-quirement for graduation, it may be given only periodically for assessment purposes, such as every two or three years. This approach reduces the cost of the test but intensifies the problem of students not showing up to take the MFT-B. If students with specific characteristics do not show up for the test, the MFT-B school results may end up with a bias.
Two of the advantages of using the MFT-B for assurance of business core knowledge are that scores allow institu-tions to compare their own performance with national norms and that longitudinal data gathered can be useful for assess-ment of learning purposes (for an example, see Bush, Floyd, Sexton, & West, 2008). After administering the exam, the school will submit the exam to ETS for grading. Then, the institution will receive the mean scores as well as average subscores for each discipline area the exam covers (account-ing, economics, management, quantitative business analysis, information systems, finance, marketing, legal and social en-vironment, and international issues). These mean scores can then be translated into percentiles that would allow the insti-tution to compare itself against peers, since the instiinsti-tutional means total score distribution for all institutions using the MFT-B during that particular time is also available. Using the institutional means total score distribution, the school is then able to infer the percent of institutions scoring below their own score. Many institutions thus use their institutional mean score results to compare their institutional scores with peer schools thus giving them an idea of how well they are doing, as well as to evaluate improvement in students core knowledge over time (the scores and score distributions pro-vided also allow benchmarking in each of the areas covered by the exam). To the extent that a particular set of students does not take the test, then institutional mean scores might not reflect the true core business knowledge of all students enrolled in the senior course. The average institutional score statistics that result can be biased if the sample mean is dif-ferent from the population mean, because of the exclusion of students with certain characteristics. In particular, if a certain group of students is more likely to take part in the testing than others then the result will be a biased sample, and the statistics that result could be biased from the omission of non-taker re-sults. This is particularly important when benchmarking the institution’s results against those of other institutions where taking the test is a requirement for graduation and hence all students take the exam.
Here we directly address the issue of students not showing up to take the MFT-B. More specifically, we are interested in whether students who fail to show up to take the MFT-B have different characteristics from students who take the test. If non–test-takers are different, then the test results will
not be generalizable to the entire group of senior students. We study characteristics of students who take the test versus those who do not take the test. To address the question, we use differences in group means and medians as well as estimate a logistic model for the response probability of a student taking the test.
We find that students with higher cumulative grade point average (GPA) are more likely to take the MFT-B. Further-more, students with higher cumulative GPA also tend to score higher on the MFT-B. Coupled together, these findings sug-gest that overall MFT-B mean institutional scores may be biased upward if some students do not voluntarily take the test, compared to the result if the complete population of students takes the test. Our findings also suggest that more participation in the MFT-B may be achieved by offering a larger amount of extra credit to students, or by administering the exam and thus offering extra credit late in the semester.
SAMPLE AND DESCRIPTIVE STATISTICS
The unit of study in this research is the results of the MFT-B administered to students at a college of business that is ac-credited by AACSB. The MFT-B was administered in Winter 2010, Summer 2010, and Winter 2012 to senior students. The assessment process at the college of business where the test-ing took place calls for assesstest-ing discipline knowledge with the MFT-B only every other year. Given the monetary and time costs of administering the test, the MFT-B was not of-fered in the period Fall 2010 through Fall 2011. The test was not mandatory or required for graduation. However, the students were strongly encouraged to take the test and all were offered extra credit for taking the test. The amount of extra credit offered varied by course. Our sample for this study consists of all students enrolled in the courses where the MFT-B was offered.
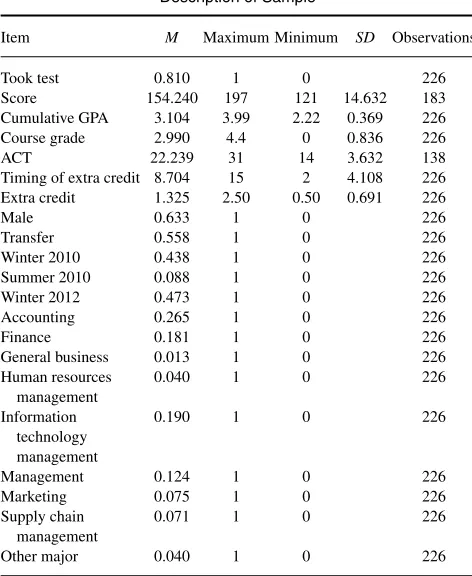
Table 1 displays descriptive statistics for our sample. Our total sample includes 226 students, of which 81% took the test and 19% did not. Score refers to the MFT-B score on a scale of 120–200. Actual student scores ranged from 121 to 197. The other variables in Table 1 are those that could be related to the likelihood of a student taking the test.
Cumulative GPA is measured as the student’s cumulative GPA at the end of the semester prior to the date the MFT-B was offered. Prior research (Allen & Bycio, 1997; Barboza & Pesek, 2012; Kwapisz & Brown, 2013; Bielinska-Kwapisz, Brown, & Semenik, 2012a; Black & Duhon, 2003; Bycio & Allen, 2007; Contreras, Badua, Chen, & Adrian, 2011; Settlage & Settlage, 2011; Terry, Mills, & Sollosy, 2008) indicates that students with higher GPAs score higher on the MFT-B. To the extent that students who did not take the test have higher or lower GPAs compared to those who did take the test, and as test score is correlated with GPA, the overall mean institutional score could be biased from its true value because the sample excludes nontakers.
TABLE 1 Description of Sample
Item M Maximum Minimum SD Observations
Took test 0.810 1 0 226
Score 154.240 197 121 14.632 183
Cumulative GPA 3.104 3.99 2.22 0.369 226
Course grade 2.990 4.4 0 0.836 226
ACT 22.239 31 14 3.632 138
Timing of extra credit 8.704 15 2 4.108 226
Extra credit 1.325 2.50 0.50 0.691 226
Male 0.633 1 0 226
Transfer 0.558 1 0 226
Winter 2010 0.438 1 0 226
Summer 2010 0.088 1 0 226
Winter 2012 0.473 1 0 226
Accounting 0.265 1 0 226
Finance 0.181 1 0 226
General business 0.013 1 0 226
Human resources
Management 0.124 1 0 226
Marketing 0.075 1 0 226
Supply chain management
0.071 1 0 226
Other major 0.040 1 0 226
Course grade refers to the grade that the student obtained in the course in which they took the MFT-B. It is a proxy for how the student was doing in class when he/she made the decision of whether or not to take the test. To allow for variation in grades recorded as A and A+, we allocate a 4.4 value to A+grades before averaging them.
ACT is the student’s score on the ACT exam, with a max-imum possible score of 36. We have ACT scores for 138 stu-dents (61%) because transfer stustu-dents are not required to turn in scores for admittance. ACT scores proxy for students’ gen-eral cognitive capability (Koenig, Frey, & Detterman, 2008). Previous research has found ACT scores to be positively and significantly correlated with MFT-B scores (Bielinska-Kwapisz & Brown, 2013; Bielinska-(Bielinska-Kwapisz et al., 2012a; Black & Duhon, 2003; Contreras et al., 2011; Settlage & Settlage, 2011; Terry et al., 2008; Zeis, Waronska, & Fuller, 2009).
Timing of extra credit refers to the week in the semester in which the MFT-B was administered and hence extra credit was offered to students. The test was administered in different classes as early as week 2 in the semester and as late as week 15 in the semester. We hypothesized that incentives for students to take the test for extra credit would be different if, say, the test were given the second week of class, versus the tenth week of class.
Extra credit refers to the amount of extra credit that was offered in the course for students who took the test. It is
measured as a percentage of the total course grade. Allen and Bycio (1997) and Bielinska-Kwapisz et al. (2012a) found a substantial difference in MFT-B scores as a function of whether extra course credit was offered. In our sample all courses offered extra credit for taking the test, ranging from 0.5% to 2.5% of the course grade.
Male is an indicator variable that takes the value of one for male students and zero for female students. Lumsden and Scott (1987) show male students perform better than fe-male students on multiple-choice exams. This might make the motivation for taking the test different for males than for females, given that the MFT-B is a multiple choice test. Allen and Bycio (1997), Barboza and Pesek (2012), and Bycio and Allen (2007) find no gender differences in MFT-B performance. However, other evidence suggests that men perform better than women on the MFT-B exam (Bean & Bernardi, 2002; Bielinska-Kwapisz & Brown, 2013; Bielinska-Kwapisz et al., 2012b; Black & Duhon, 2003; Con-treras et al., 2011; Mason et al., 2011; Settlage & Settlage, 2011). Sixty-three percent of our sample students were male. Transfer is an indicator variable that equals one for trans-fer students and zero otherwise. We include it to inquire if transfer students have a different level of motivation than non-transfers in taking the standardized test. Following the Admissions Office definition, a student is considered a trans-fer student if he or she has more than 25 transtrans-fer credits. Our sample consisted of 56% transfer students.
Winter 2010, Summer 2010, and Winter 2012 refer to the proportion of students who took the test during the respec-tive semesters. Only a small portion of students (8.8%) were tested during the summer. Most students were tested in ei-ther the Winter 2010 semester (43.8%) or the Winter 2012 semester (47.3%).
Table 1 also provides a breakdown by major for students in our sample. The largest number of students was from ac-counting (26.5%) followed by information technology man-agement (19%) and finance (18%). The least represented majors were general business (1.3%) and human resources management (4%). The sample was fairly representative of the student population in the college of business.
The likelihood that a student takes the test or not could depend on the students’ particular major. Table 2 presents a comparison of majors, according to how many students took the test. A high percentage of marketing, accounting, and finance majors took the test compared to other majors. Notice that general business, with all students taking the test, perfectly predicts test takers. In further analysis it is necessary to either drop or re-bundle this category so we can apply the logistic model. Therefore, in the following analysis we bundle together general business with other in the regression.
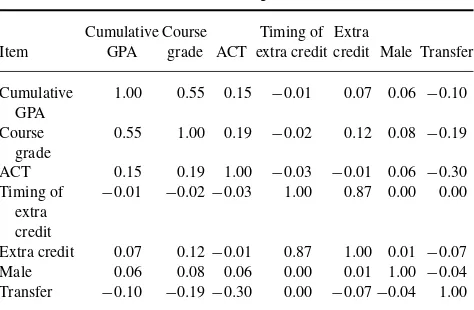
Table 3 presents simple correlations between variables. We find high correlation between cumulative GPA and course grade (0.55) and between extra credit and timing of extra credit (0.87). To avoid possible collinearity problems, we
174 M. VALERO AND C. KOCHER
TABLE 2 Comparison of Majors
Major Took test Did not take test Total
Accounting 53 7 60
Finance 35 6 41
General business 3 0 3
Human resources management 6 3 9
Information technology management 30 13 43
Management 20 8 28
Marketing 16 1 17
Supply chain management 13 3 16
Other 7 2 9
Note: Other refers to students whose primary unit is the college of
business but have not elected a business major as their primary major.
adopt either cumulative GPA or course grade in our models, and either extra credit or timing of extra credit.
COMPARISON OF MEANS AND MEDIANS
To explore whether test takers differ from nontakers, we test for differences in means and medians of their characteristics. Table 4 compares the group of test takers against that of nontakers. Results show students who took the test had higher GPA than those who did not take the test. Also, those who took the test ended up with a higher course grade compared to those who did not take the test. It is possible that this last result holds because students taking the test are those with higher achievements ex-ante, or perhaps their grade was higher because they received extra credit from the test. We find no difference in the ACT scores of takers versus non-takers. Students who took the test were also offered more extra credit on average than those who did not take the test. Extra credit is a motivation to take the test. Finally, we find no difference between the two groups of students in terms of gender or transfer status.
TABLE 3
Correlation Among Variables
Cumulative Course Timing of Extra
Item GPA grade ACT extra credit credit Male Transfer
Cumulative
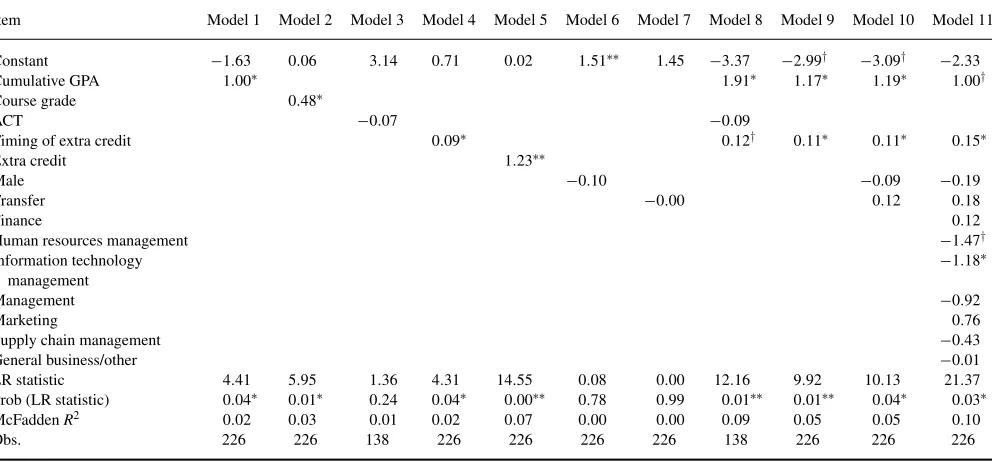
To determine the variables that influence whether a student took the test, given that our dependent variable is binary (the student either took the test or did not), we use a logistic model. The logistic model takes the form:
P(y=1|x)=G(β0+xβ)
where G is the logistic function G(z)=exp(z)/[1+exp(z)]. P(y=1|x) is the response probability that Y=1, given a vector of explanatory variablesx.Y=1 represents the group of students who took the test. β is a vector of parameters that captures the effects of changes in variables x on the response probability that a student will take the test. The parameter estimates of the logit model explain the effects of the explanatory variables on the response probability. The signs ofβdetermine whether the explanatory variables have a positive or negative effect on the probability. The model requires maximum likelihood estimation.
To test the joint null hypothesis that all slope coefficients except the constant are zero we use the likelihood ratio (LR) statistic. The explanatory variables we use in our various models are either cumulative GPA or course grade, ACT, either timing of extra credit or extra credit, male indicator variable, transfer indicator variable, and the major dummies, where accounting is the omitted group. Logit regression re-sults are presented in Table 5.
Models 1–7 include one explanatory variable at a time. A student with higher cumulative GPA (Model 1) and higher grade in the course (Model 2) has a higher probability of tak-ing the MFT-B test. If the test is offered later in the semester (Model 4) or if more extra credit for taking the test is offered (Model 5) the probability of the student taking the test is higher. The score on the ACT (Model 3), the student’s gen-der (Model 6) and transfer status (Model 7) have no impact on the probability that the student takes the MFT-B.
Model 8 includes cumulative GPA, ACT score, and tim-ing of extra credit as explanatory variables. Results show that the probability of students taking the test increases with their cumulative GPA and with the week in the semester that the test is taken and thus extra credit is offered. The drawback of this model is the loss of observations because of the inclu-sion of ACT variable. Model 9 is similar to Model 8 but with the larger sample size because of the exclusion of the ACT variable. We observe that results are consistent with both the large sample of 226 observations and the smaller sample of 138 observations for which we have student’s ACT scores. In particular, students with higher cumulative GPA and those who were offered the test later in the semester are more likely to take the test. In Model 10 we include the gender (male) indicator variable and the transfer indicator variable. Results are consistent among the logit regressions and the univariate means and medians tests: gender and transfer status are not correlated with the decision of the student to take the test. Finally, in Model 11 we include the major dummies. Our
TABLE 4
Comparison of Two Groups: Test Takers Versus Nontakers
Took Did not Took Did not tstatistic Wilcoxon/
Item test mean take test mean t df test median take test median Mann-Whitney
Cumulative GPA 3.13 3 −2.078∗ 224 3.1 2.97 2.026∗
Course grade 3.06 2.7 −2.516∗ 224 3 2.7 2.228∗
ACT 22.07 23 1.159 136 22 23 1.075
Timing of extra credit 8.97 7.56 −2.046∗ 224 9 7 1.095
Extra credit 1.4 1.0 −3.517∗∗ 224 1 1 2.740∗∗
Male 0.628 0.651 0.277 224 1 1 0.231
Transfer 0.557 0.558 0.009 224 1 1 0.006
Note: The statistics are thet-test for the difference in means test and the Wilcoxon rank test for difference in medians, respectively.
†p<.1,∗p<.05,∗∗p<.01.
prior results are robust to the inclusion of these dummies, and we also learn that students majoring in human resources management and information technology management are less likely to take the test compared to accounting students. For all models in which we have significant explanatory vari-ables the LR statistic is statistically significant, therefore the models are significant.
DISCUSSION
The results of our analysis suggest that in order to maximize student participation, it is important when and how the test is administered. Students are more likely to take tests that are closer to the end of the term, perhaps because the extra credit at that time is more important to them. The amount of extra credit is also an important determinant of whether students
take the test, with more extra credit being more attractive and thus making it more likely that students will take the test.
We find a robust positive relationship between the stu-dents’ cumulative GPA at the time when the test is offered and their probability of taking the test. This suggests stronger students are more likely to take the test. To the extent that stronger students (as per their GPA) in general score bet-ter on the MFT-B (Allen & Bycio, 1997; Barboza & Pe-sek, 2012; Kwapisz & Brown, 2013; Bielinska-Kwapisz et al., 2012a; Black & Duhon, 2003; Bycio & Allen, 2007; Contreras et al., 2011; Settlage & Settlage, 2011; Terry et al., 2008), this suggests that the average institutional score on the MFT-B would overstate the true outcomes profile of the school.
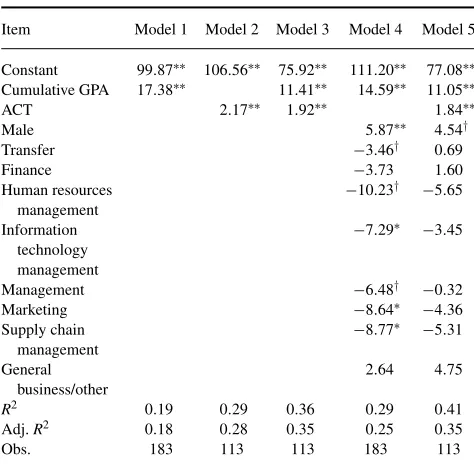
Table 6 presents results of ordinary least squares regres-sions of MFT-B score on cumulative GPA and other variables
TABLE 5 Logistic Regressions
Item Model 1 Model 2 Model 3 Model 4 Model 5 Model 6 Model 7 Model 8 Model 9 Model 10 Model 11
Constant −1.63 0.06 3.14 0.71 0.02 1.51∗∗ 1.45 −3.37 −2.99† −3.09† −2.33
Cumulative GPA 1.00∗ 1.91∗ 1.17∗ 1.19∗ 1.00†
Course grade 0.48∗
ACT −0.07 −0.09
Timing of extra credit 0.09∗ 0.12† 0.11∗ 0.11∗ 0.15∗
Extra credit 1.23∗∗
Male −0.10 −0.09 −0.19
Transfer −0.00 0.12 0.18
Finance 0.12
Human resources management −1.47†
Information technology management
−1.18∗
Management −0.92
Marketing 0.76
Supply chain management −0.43
General business/other −0.01
LR statistic 4.41 5.95 1.36 4.31 14.55 0.08 0.00 12.16 9.92 10.13 21.37
Prob (LR statistic) 0.04∗ 0.01∗ 0.24 0.04∗ 0.00∗∗ 0.78 0.99 0.01∗∗ 0.01∗∗ 0.04∗ 0.03∗
McFaddenR2 0.02 0.03 0.01 0.02 0.07 0.00 0.00 0.09 0.05 0.05 0.10
Obs. 226 226 138 226 226 226 226 138 226 226 226
†p<.1,∗p<.05,∗∗p<.01.
176 M. VALERO AND C. KOCHER
TABLE 6
Ordinary Least Squares Regressions of Score on GPA
Item Model 1 Model 2 Model 3 Model 4 Model 5
Constant 99.87∗∗ 106.56∗∗ 75.92∗∗ 111.20∗∗ 77.08∗∗
Obs. 183 113 113 183 113
†p<.1,∗p<.05,∗∗p<.01.
for our sample of students. Models 1–3 corroborate that stu-dents with higher cumulative GPA and ACT scores per-formed better on the MFT-B. In Model 4, we included cumulative GPA and our control variables. GPA was still statistically significant in this model. We also found male students scored higher than female students on the test. This same result for the MFT-B was been documented in Bean and Bernardi (2002), Bielinska-Kwapisz et al. (2012b), Bielinska-Kwapisz and Brown (2013), Black and Duhon (2003), Contreras et al. (2011), Mason et al. (2011), and Sett-lage and SettSett-lage (2011). Transfer students score lower on the MFT-B. Additionally, students majoring in human resources management, information technology management, manage-ment, marketing, and supply chain management scored lower than accounting students on the test. The last column in the table is a model that also includes the ACT score in the regression. Because of the inclusion of the variable the sam-ple size was smaller. Students with higher cumulative GPA, higher ACT scores, and male students scored higher on the MFT-B.
CONCLUSION
Our findings suggest that students with higher cumulative GPA are more likely to take the test (Table 5), and that students with higher cumulative GPA tend to score better on the MFT-B (Table 6). Coupled together, this implies that MFT-B average institutional scores could be biased upward compared to their true value if poor-performing students are
not being tested, thus the outcomes profile of a school may appear stronger than it actually is.
A suggestion to avoid the previously stated bias would be to make the test mandatory of all students enrolled in a course or of all graduating students. One has, however, to consider also the costs of such a strategy of testing all students. If for administrative, costs, or other reasons one cannot make the test mandatory of all students, our results suggest that there are ways to administer the test that would increase the likelihood of students taking it. In particular, offering a larger amount of extra credit and administering the test late in the semester are shown to increase participation.
REFERENCES
Allen, J. S., & Bycio, P. (1997). An evaluation of the educational testing
service major field achievement test in business.Journal of Accounting
Education,15, 503–514.
Barboza, G., & Pesek, J. (2012). Linking course-embedded assessment mea-sures and performance on the educational testing service major field test
in business.Journal of Education for Business,87, 102–111.
Bean, D. F., & Bernardi, R. A. (2002). Performance on the major field test
in business: The explanatory power of SAT scores and gender.Journal of
Private Enterprise,17, 172–178.
Bielinska-Kwapisz, A., & Brown, W. (2013). Differential gender
perfor-mance on the Major Field Test in business.Journal of Education for
Business,88, 159–166.
Bielinska-Kwapisz, A., Brown, W., & Semenik, R. (2012a). Interpreting standardized assessment test scores and setting performance goals in the context of student characteristics: The case of the major field test in
business.Journal of Education for Business,87, 7–13.
Bielinska-Kwapisz, A., Brown, W., & Semenik, R. (2012b). Is higher better? Determinants and comparisons of performance on the major field test in
business.Journal of Education for Business,87, 159–169.
Black, H. T., & Duhon, D. L. (2003). Evaluating and improving student achievement in business programs: The effective use of standardized
assessment tests.Journal of Education for Business,79, 90–98.
Bush, H. F., Floyd, H. D., Sexton, E. A., & West, C. T. (2008). Using the Major Field Test -business as an assessment tool and impetus for program improvement: Fifteen years of experience at Virginia Military Institute.
Journal of College Teaching and Learning,5, 75–88.
Bycio, P., & Allen, J. S. (2007). Factors associated with performance on the Educational Testing Service (ETS) Major Field Achievement
Test in Business (MFAT-B). Journal of Education for Business, 82,
196–201.
Contreras, S., Badua, F., Chen, J. S., & Adrian, M. (2011). Documenting and
explaining major field test results among undergraduate students.Journal
of Education for Business,86, 64–70.
DeMong, R. F., Lindgren, J. H., & Perry, S. (1994). Designing an assessment
program for accounting.Issues in Accounting Education,9, 11–27.
Kelley, C., Tong, P., & Choi, B. (2010). A review of assessment of student
learning programs at AACSB schools: A dean’s perspective.Journal of
Education for Business,85, 299–306.
Koenig, K. A., Frey, M. C., & Detterman, D. K. (2008). ACT and general
cognitive ability.Intelligence,36, 153–160.
Lumsden, K. G., & Scott, A. (1987). The economics student reexamined:
Male-female differences in comprehension.Journal of Economic
Educa-tion,18, 365–375.
Mason, P. M., Coleman, B. J., Steagall, J. W., & Gallo, A. A. (2011). The use of the ETS major field test for assurance of business content learning:
Assurance of waste?Journal of Education for Business,86, 71–77.
Mirchandani, D., Lynch, R., & Hamilton, D. (2001). Using the ETS major
field test in business: Implications for assessment.Journal of Education
for Business,77, 51–55.
Settlage, D. M., & Settlage, L. A. (2011). A statistical framework for
as-sessment using the ETS major field test in business.Journal of Education
for Business,86, 274–248.
Terry, N., Mills, L., & Sollosy, M. (2008). Student grade motivation as a determinant of performance on the business Major Field ETS exam.
Journal of College Teaching and Learning,5, 27–32.
Zeis, C., Waronska, A. K., & Fuller, R. (2009). Value-added program as-sessment using nationally standardized tests: Insights into internal validity
issues.Journal of Academy of Business and Economics,9, 114–128.