978-1-5386-2833-1/17/$31.00 ©2017 IEEE
Impact of Mobile Sink on Grid Topology of Wireless
Sensor Network
Misfa Susanto, Yona Annisa,
Agus Trisanto, Syaiful AlamElectrical Engineering Department, University of Lampung, Jl Prof. Sumantri Brojonegoro No 1, Bandar Lampung 35145, Indonesia
Abstract—Motivated by the news in the local newspaper that there was occurrence of elephant moving out from their conservation area in Lampung province of Indonesia, this paper proposes the use of Wireless Sensor Network (WSN) as a monitoring system that is applicable for monitoring elephant movement in the conservation area. This paper studied the effect of mobile sink node on that WSN system. Modeling and simulation have been carried out to evaluate the system. The area of conservation was modeled as a square area with a grid topology of WSN inside the square area. At the first, it was applied a static sink node to collect the sensed data of sensor nodes. The WSN with single static sink node was used as a baseline system. And then, the static sink node was replaced by a mobile sink node for the purpose to improve the energy efficiency in order to lengthen the lifetime of WSN. The extensive simulation was carried out to examine both WSN systems with static sink node and with mobile sink node. The simulation results for the designed network topology show the significant improvement comparing the one with mobile sink node and another one with static sink node. It was achieved the improvement of network lifetime by the factor of 9.26.
Keywords—WSN based monitoring system; elephant movement monitoring; grid topology; mobile sink node; energy efficiency
I. INTRODUCTION
Indonesia is one of tropical countries in which it has very rich animals and plants. Some of them are scarce and hence their existences need to be conserved. One of scarce animal that Indonesia has is elephant. Lampung province, Indonesia has one conservation area that is specifically to keep the habitat of elephant. However, even the elephants have been located in the conservation area, there is still a possibility that the elephants move out from the conservation area. It will cause the uncomfortable situation for the people who live around the elephant conservation area. Elephant can destroy the housing area, the farming area, etc. In the worst case, the people can kill the elephant when the elephant comes out from the conservation area. This situation is not as desired for the government and the people of the country.
Motivated with the situation mentioned above, as it was known from the local newspaper in Lampung province, Indonesia that there were some elephants often going out from the conservation area in Lampung province, Indonesia, this paper proposes the use wireless sensor network (WSN) to monitor the elephant movement such that the necessary
actions can be taken when the elephant(s) is approaching the border area of the conservation area.
The application of WSN in relation to animal monitoring has been explored in the literatures. Just few to mention, in [1] fog-enabled WSN has been used to analyze the behavior of animal in precision dairy, ref [2] has proposed a ZigBee based WSN architecture as a animal health monitoring, in [3] it has explored the cognitive radio support in WSN for animal welfare.
WSN consists of large number of sensor nodes which are self organized and cooperate each other to collect the sensed physical phenomenon and send them to reach a collector node called as sink node. Sink node can be equipped with the gateway to connect to global network such as internet. Most of sink nodes of WSN in the literature have static properties in which it does not move during the network lifetime. Since the sensor node is tiny and its source of energy comes from the battery, the crucial aspect in the design of WSN is energy.
Considering the static sink node in WSN, the sensor nodes near to sink node will have more load than the other nodes. Thus the sensor nodes near to the sink node will run out its energy quickly than the other nodes which are far from the sink node. In the last decade, the use of mobile sink node in WSN has emerged as an attractive way to achieve more efficient energy for the design of WSN. In [4], the authors have proposed to use mobile sink node in WSN to collect data from the cluster head of virtual grid cluster based WSN. Routing protocol was proposed such that cluster head close to the sink functions as a gateway for other cluster head. In [5], the authors have proposed the modified algorithm cluster head selection in LEACH [6] and used a mobile sink node to visit a cluster to collect the data from cluster head. In [7], the paper described the mechanism to build and to rebuild a cluster (in a grid) based on the power consumptions of sensor nodes, and then a mobile sink will visit the cluster to balance the energy consumption in the entire network. All of these published works are based on the use mobile sink node on the cluster-based WSN. This paper differs from the works mentioned above in which this paper does not use the cluster-based data transmission, but all sensor nodes transmit their data information directly to the mobile sink node through multi-hop transmissions.
The rest of this paper is structured as follow. Following this introduction, Section 2 describes the system model and assumptions. Section 3 presents the simulation settings and This work is funded by University of Lampung (Unila), Indonesia
parameters. The conclusions are drawn in Section 4 as well as further future works are discussed.
II. SYSTEM MODEL AND DESCRIPTION
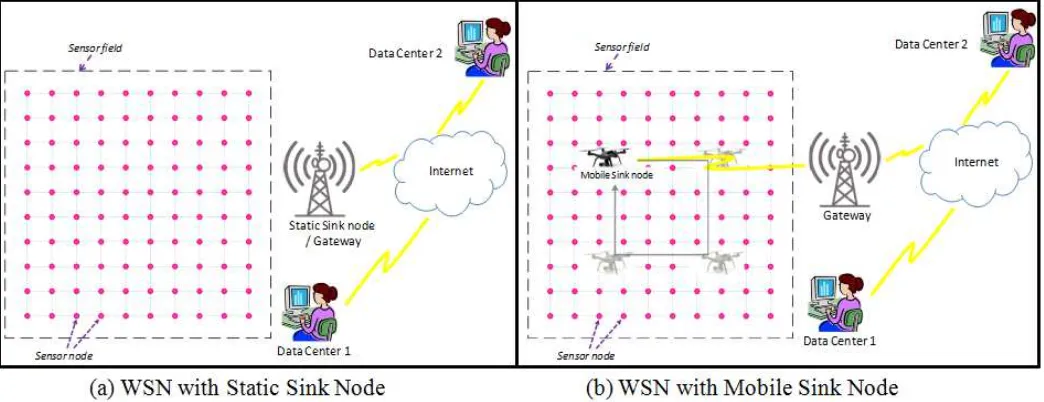
This section describes the system model that will be implemented in the simulation. In this paper, the conservation area for elephant is assumed as a square area. This main square area is divided into equally smaller square areas in which on each corner of smaller square areas is placed a static sensor node. In this way, it forms a grid topology of WSN. When the static sink node is used, the static sink node is located out of the main square area of conservation. Exact location of static sink node will be explained in the simulation setting in Section 3. The gateway that connects WSN to the global network is located at the same place as where the static sink node place is.
For the case of mobile sink node, the mobile sink will move surrounding an area inside the whole main square area and controlled such that it will be on the certain fixed path. The moving path of mobile sink node will follow the square path with the mobility model that both will be explained later on in Sub-section A. In the case of WSN with mobile sink node, the gateway is positioned on the same place as when we consider the static sink node. Certainly, there are some possibilities for the moving path of the mobile sink. We do examine other possibilities of mobile sink paths, but in this paper we limit and present the path of mobile sink mentioned above.
Both of those two WSN with static and mobile sink nodes explained above are depicted on Fig. 1. Each sensor node on both models has their own initial energy. Each time the node (s) is active, i.e. transmits and/or receives the data information from another node, their current energy will be decreased by the consumed energy which follow the energy model described in Sub-section B. The node activity will be triggered by the elephants which move in between two nodes, so two nodes will be active to transmit at the same time when an elephant passes in between two nodes. In the simulation, we generate the activity of these two nodes randomly. These two
nodes will transmit their identity (ID) numbers that indicate where the locations of sensor nodes are. The transmissions from the sensor nodes to the sink nodes either static sink node or mobile sink node will be performed by multi-hop manner and will explained in Sub-section C. For the case of mobile sink node, it is assumed that the transmission from the active sensor node to the sink node will be carried out during and where the mobile sink node is positioned at the certain time.
A. The Movement Path for Mobile Sink Node and its Mobility Model
As mentioned earlier that for the case of mobile sink node, it moves following the certain fixed paths. The path for the movement of mobile sink node is shown in Fig. 2. The path for the mobile sink node forms a square inside the main square of conservation area. It is arranged in a way such that the movement path has a half of the distance between the center of and the border of the main square of conservation area. The mobile sink will start from the path P1, in Fig. 2 shown by an arrow P1, and move clockwise to P2, P3, and P4, repeatedly for the whole life of the network. The mobility model of sink node can be explained as the following. It is assumed that mobile sink node has a constant speed of movement vb. At the beginning, the mobile sink node starts from the coordinate point (x1, y2) in Fig. 2 and moves with the constant speed, vb, horizontally following the path of P1. At the certain time, t1, the x coordinate of mobile sink node (x_update) will change following the equation 1 below; meanwhile the y coordinate does not change.
x_update = x1 + vb . t1 (1)
Before the next time (t1 + 1 = t2) of simulation, the x coordinate of mobile sink will be checked whether it is equal to x2. If it is, then the mobile sink node will move vertically following the path of P2 with the constant speed, vb. In this circumstances, the y coordinate of mobile sink node will be updated, y_update, following the equation 2 below, meanwhile the x coordinate of mobile sink node will be constant.
y_update = y2 – vb . t2 (2)
Before t3 = t2 + 1, the next time of simulation, the y coordinate of mobile sink node will be examined whether it has the same value as y1. If it is the case, then the mobile sink node will move horizontally following the path of P3 with the constant speed of vb. In this case, the x coordinate of mobile sink node will be updated every time it moves, while the y coordinate of mobile sink node will remain the same as y1. The updating of x
coordinate of mobile sink node at the path of P3 will follow the equation 3 below.
x_update = x2 – vb . t3 (3)
Prior to the next time of simulation t4 = t3 +1, the x coordinate of mobile sink node will be test whether it will the same as x1 or not. If it is, the mobile sink node will move vertically following the path of P4. The mobile sink node will still move with the constant speed vb. Moving on the path P4, the y
coordinate of mobile sink node will be updated following the equation 4, meanwhile the x coordinate remains the constant.
y_update = y1 + vb . t4 (4)
At the next time of simulation, the y coordinate will be checked whether it is the same as y2. If it is the case, then the mobile sink node will move following the path P1 and the procedure will be recurred as above from the equation 1 until the simulation ends, i.e. the simulation finds that there is one node ran out its energy. In this paper, we use the definition of lifetime for the WSN as the time from the beginning of WSN works until there is one node running out its energy [8].
B. Energy Model
In this paper, the energy model that is used is adopted from [9], i.e. the energy dissipations of a sensor node follow the equations below.
ETx (l, d) = (Eelecx l) + (εampx l x d2) (5)
ERx (l, d) = Eelecx l (6)
where ETx is energy needed to transmit the data information (Joule), ERx is energy needed to receive the data information (Joule), Eelec is energy that is used to operate sensor node (Joule/bit), εamp is energy to amplify the data signal (J/bit/m2), l
is the size of data packet length (bit), d is the distance between the transmitter and receiver.
C. Data Transmission Algorithm
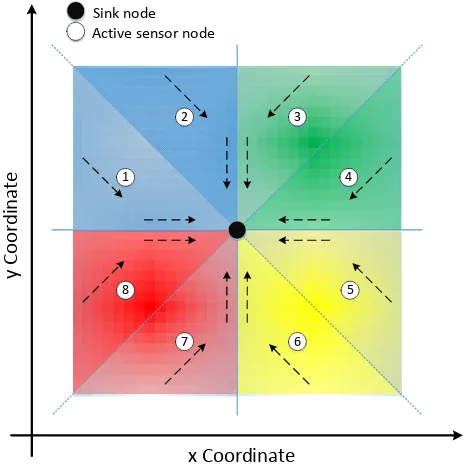
This section describes the algorithm of data transmission from sensor node to the sink node. The way of data transmission is achieved through a multi-hop manner. The algorithm can be applied for both cases in this paper, i.e. WSN with static sink node and WSN with mobile sink node. The data transmission algorithm is depicted in Fig. 3. Suppose we have a square area and the sink node, either it is static or mobile sink nodes, at the certain time is on the center of the square area (shown as a black circle), i.e. the sink node is at the crossing lines that divides the squares into four equal smaller square areas. Each smaller square area is divided into two triangles as shown in Fig. 3. The white circles with a number indicate the active sensor nodes. The dashed black arrows denote the direction of data transmission path for the active nodes. When a sensor node is active, it will transmit the data diagonally to its closest neighbor node until achieving either the horizontal or vertical lines of smaller squares. From there, the data transmission path is changing following the horizontal or vertical lines of smaller squares to achieve the sink node. In the case of the active sensor nodes exactly on the horizontal or vertical lines, they directly send their data following the paths on horizontal or vertical lines leading to
0 x1 x2 x3 x
y1 y2 y3
y
P1
P4
P3 P2
Border of conservation
area
Movement path of mobile sink
node
Fig. 2 The paths that are passed by mobile sink node inside the conservation area.
8
6 4 2
x Coordinate
y Coordi
nat
e 1
5
7
3
Sink node Active sensor node
sink node.
III. SIMULATION SETTINGS AND RESULTS
A. Simulation Parameters and Assumptions
This section describes the simulation for the system described in the previous section. The simulation setting, assumptions, and parameters will be presented. The conservation area is set to have 1300 km2 area which is
according to the area of the elephant conservation area in Lampung province, Indonesia. Then, the square of the conservation area has been set up to the size of 36 km by 36 km. This main square area is divided into equal smaller square areas which each smaller square area has the size of 1 km by 1 km. At every corner of smaller square area is placed a sensor node that has a transmission range of 1.5 km [10]. Therefore, the total number of sensor nodes in the conservation area is 1296 nodes. Each sensor node is assumed to have the same initial energy that is 10 Joule [11].
The sensor nodes will be active to transmit an initial data that indicates the elephant passing in between two sensor nodes. The activeness of two consecutive nodes is generated randomly. The active nodes will send the data information in multi-hop manner with the data transmission algorithm discussed in Section 2 to reach the sink node. The distance of their intended relaying node will be first calculated. The initial data information that be sent by the first active node is the ID of sensor nodes that are passed by the elephant. Since we have 1296 sensor nodes in total, thus 11 bits will be enough to represent the ID of all sensor nodes in the conservation area. Every time each node either transmitting or receiving the data information, their energy will be reduced following the energy model discussed in Section 2. In the simulation, for the energy model, the values of Eelec and εamp are set to 50 nJ/bit and 10
pJ/bit/m2, respectively [9]. The simulation is run and iterated
until it is found that there was one node in the system which ran out its energy. The simulation stops until this point. The simulation time from the simulation started until the simulation time for first sensor node ran out its energy is calculated as the lifetime of the network. The simulation is run for both of the WSN with static and mobile nodes.
The position of static sink node is set to the right corner of the main square conservation area, but it is out of the main square conservation area, with the distance of 0.5 km from the bottom right corner. Meanwhile for the case of WSN with mobile sink node, the starting point of mobile sink node is the beginning point of P1 at the left in Fig. 2. The speed of mobile sink node is set up such that at the current iteration, the mobile sink node will be on the position of next sensor node that is on the path of mobile sink movement, i.e. 1 km away from the current node. Table 1 summarizes all parameters discussed above.
B. Simulation Results and Discussion
As explained in Sub-section 3a, the simulation is run until there is one node in the network ran out its energy and the lifetime of the network is calculated at this point. The energy dissipation among the nodes for both systems of WSNs with
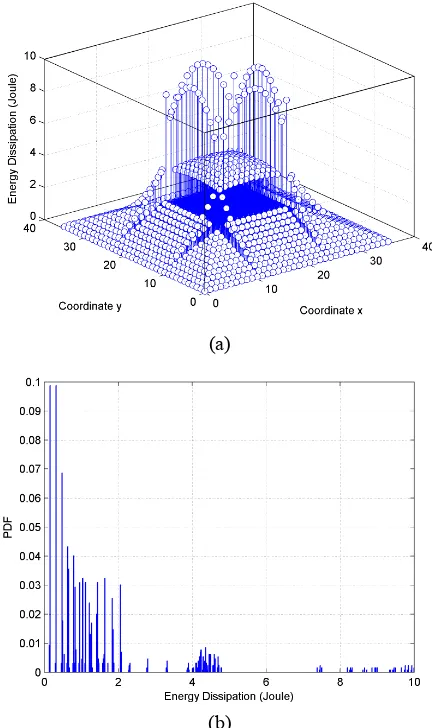
static and mobile sink nodes, as well as its probability density function (PDF) and cumulative distribution function (CDF) are collected. The simulation was run for 10 times and the network lifetime, PDF of energy dissipation, and CDF of energy dissipation are averaged. It was found that the lifetime for WSN with static and mobile sink nodes are 150.6 and 1544.7 of simulation times, respectively. Thus it can be noticed that the mobile sink node significantly improves the network lifetime by the factor of 9.26. The distributions of energy dissipation among the nodes for the network with static and mobile sink nodes are plotted in Fig. 4 (a) and Fig. 5 (a), respectively. The PDF of energy dissipations of the network are plotted in Fig. 4 (b) and Fig. 5 (b) for the network with static and mobile sink nodes, accordingly. Fig. 6 plots the comparison for the CDF of energy dissipations of the network with static and mobile sink nodes which is indicated as static and mobile in Fig. 6, respectively.
As it can be noticed from the Fig. 4 (a) that for the WSN with static sink node, the sensor node that has highest energy dissipation is the closest node to the sink node, i.e. the sensor node which is on most right bottom corner in Fig. 4 (a). It is because of that node will have highest activities in receiving and transmitting (i.e. relaying) the data information to the sink node. It can be also noticed that the sensor nodes on the bottom (horizontal) and right hand (vertical) edges have dissipated higher than other nodes inside the conservation area. In fact, as depicted in Fig. 4 (b), PDF of energy dissipation shows that the most of sensor nodes did not dissipate their much energy they have.
For the case of WSN with mobile sink node, as shown in Fig. 5 (a), the sensor nodes that dissipated much energy were inside the conservation area i.e. on the paths of mobile sink movements. It can be understood that these nodes have had more activities, i.e. receiving and transmitting (relaying) the data information. Other nodes seemed showing higher energy dissipations compared to the case of static sink node. It can be said that WSN with mobile sink node had successfully made the energy dissipation more evenly distributed than the case of WSN with static sink node, as comparing Fig. 5 (b) and Fig. 4 (b).
Comparing the CDF of energy dissipations for the WSN with static and mobile sink nodes in Fig. 6, it can be seen that 90% of sensor nodes (at CDF of 0.9) has dissipated 0.5 Joule of their energy for the WSN with static sink node, meanwhile 90% of sensor nodes has dissipated 7.5 Joule of their energy for the WSN with mobile sink node. Mobile sink node has prolonged the network lifetime of WSN.
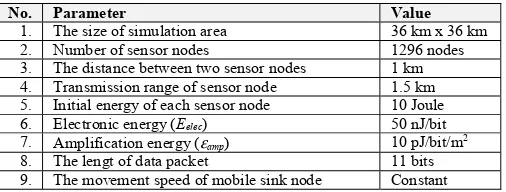
TABLE I. SIMULATION PARAMETERS
No. Parameter Value
1. The size of simulation area 36 km x 36 km 2. Number of sensor nodes 1296 nodes 3. The distance between two sensor nodes 1 km 4. Transmission range of sensor node 1.5 km 5. Initial energy of each sensor node 10 Joule 6. Electronic energy (Eelec) 50 nJ/bit
7. Amplification energy (εamp) 10 pJ/bit/m2
IV. CONCLUSIONS AND FURTHER WORKS
This paper has proposed the use of WSN as a monitoring system that is applicable to monitor the elephant movement in a conservation area. The conservation area was assumed having a square form and a grid topology of WSN is designed inside the main square of conservation area. The use of static sink node was used first as a baseline system in the designed WSN. And then, a mobile sink node has replaced the static sink node with the aim to improve the network lifetime. The mobility model for the mobile sink node has been proposed that the movement of mobile sink node follows a certain path inside the conservation area. This paper also has proposed the algorithm of data transmission from the sensor nodes to the sink nodes, both static and mobile sink nodes. An extensive simulation has been carried and the simulation results in terms of network lifetime, distribution of energy dissipation after one node ran out its energy, probability density function (PDF) of energy dissipations, and cumulative distribution
(a)
(b)
Fig. 5 Distribution of energy dissipation among the nodes after there was one node in the network running out its energy for WSN with mobile sink node (a) and its probability density function (PDF) (b).
Fig. 6 The comparison of CDF for the WSN with static sink node (labeled as static) and with mobile sink node (labeled as mobile).
(a)
(b)
function (CDF) of energy dissipations have been presented for both cases of the WSN with static and mobile sink nodes . It was found that the WSN with mobile sink node has significantly improved the network lifetime of the WSN with static sink node by the factor of 9.26. The distribution of energy dissipation was also improved. It was indicated by the simulation results of CDF of energy dissipation that the WSN with mobile sink node has made the energy distributions more evenly distributed than the WSN with static sink node. 90% of sensor nodes have dissipated 7.5 Joule of their energy for the WSN with mobile sink node; meanwhile 90% of sensor nodes have dissipated 0.5 Joule for the WSN with static mobile sink node.
As for the near future works, the works of this paper can be extended to the different mobility model for mobile sink node, the possibility to use hybrid static and mobile sink nodes, and the different data transmission algorithms in transmitting the data information from the sensor nodes to reach the sink nodes either static or mobile sink nodes.
ACKNOWLEDGEMNT
The authors would like to thank to anonymous reviewers for their comments such that this paper can have better presentation.
REFERENCES
[1] K. Bhargava, S. Ivanov, C. Kulatunga, and W. Donnelly, “Fog-enabled WSN system for animal behavior analysis in precision dairy”, 2017 International Conference on Computing, Networking and Communications (ICNC): Wireless Ad hoc and Sensor Networks, January 2017.
[2] A. Bhavsar and H. Arolkar, “ZigBee based network architecture for animal health monitoring”, 2015 1st International Conference on Next Generation Computing Technologies (NGCT-2015), pp. 398-4402, September 2015.
[3] M. Y. Mustafa, I. Hansen, and S. Eilertsen, “Application of wireless sensor networks based on cognitive radio for animal welfare”, 5th IEEE International Conference on Cognitive Infocommunications, pp. 499-503, November 2014.
[4] R. Bhatti and G. Kaur, “Virtual grid based energy efficient mobile sink routing algorithm for WSN”, 2017 11th International Conference on Intelligent Systems and Control (ISCO), pp. 30-33, January 2017. [5] B. Y. Kushal and M. Chitra, “Cluster based routing protocol to prolong
network lifetime through mobile sink in WSN”, IEEE International Conference On Recent Trends In Electronics Information Communication Technology, pp. 1287-1291, May 2016.
[6] W.B. Heinzelman, A. P. Chandrakasan, ad H. Balakrishnan “An application specific protocol architecture for Wireless Microsensor Networks”, IEEE Transactions on Wireless Communications, Vol. 1, No. 4, pp. 660-670, October 2002.
[7] C. Du, Z. B. Zhou, and L. Shu, “An efficient technique of scheduling mobile sinks in hybrid WSN”, IECON 2014 - 40th Annual Conference of the IEEE Industrial Electronics Society, pp. 3885-3891, November 2014.
[8] Y. Gu, Y. Ji, J. Li, “ESWC: Efficient scheduling for the mobile sink in wireless sensor networks with delay constraint”, IEEE Transactions on Parallel and Distributed Systems, Vol. 24, No. 7, pp. 1310-1318, July 2013.
[9] M. Arshad, M.Y. Aalsalem, and F. A. Siddiqui, “Energy efficient cluster head selection in mobile WSNs”, Journal of Engineering Science and Technology, Vol. 9, No. 6, pp. 735-737, December 2014.
[10] R. P. Narayanan, T. V. Sarath, and V. V. Vineeth, “Survey on motes used in wireless sensor networks: performance & parametric analysis”, Wireless Sensor Network, Scientific Research Publishing, Vol. 8, No. 4, pp. 51-60, April 2016.