TNP2K
W
ORKING
P
APER
PNPM RURAL INCOME INEQUALITY AND
GROWTH IMPACT SIMULATION
TNP2K WORKING PAPER 18 - 2014 October 2014
PNPM RURAL INCOME INEQUALITY AND
GROWTH IMPACT SIMULATION
TNP2K WORKING PAPER 18-2014 October 2014
JON R. JELLEMA
The TNP2K Working Paper Series disseminates the findings of work in progress to encourage discussion and exchange of ideas on poverty, social protection, and development issues.
Support for this publication has been provided by the Australian Government through the Poverty Reduction Support Facility (PRSF).
The findings, interpretations, and conclusions herein are those of the author and do not necessarily reflect the views of the Government of Indonesia or the Government of Australia.
You are free to copy, distribute, and transmit this work for noncommercial purposes.
Attribution: Jellema, Jon. 2014. ‘PNPM Rural Income Inequality and Growth Impact Simulation’, TNP2K
Working Paper 18-2014. Tim Nasional Percepatan Penanggulangan Kemiskinan (TNP2K), Jakarta, Indonesia.
To request copies of the paper or for more information, please contact the TNP2K Knowledge Management Unit ([email protected]). This and other TNP2K working papers are also available at the TNP2K website (www.tnp2k.go.id).
TNP2K
PNPM Rural Income Inequality and
Growth Impact Simulation
Jon R. Jellema
1October 2014
ABSTRACT
The author generates a household- and economy-level impact simulation, using observed parameters from actual public works programme implementation, to answer the following question: when there is a choice among feasible infrastructure-provision technologies, which technology produces greater gains in desirable social objectives? The author forms expectations about the relative advantages of one technology over another only for those public works programmes that are proven and feasible in Indonesia and for which there is empirically observed implementation information. Output measures resulting from implementation of each of the feasible infrastructure-delivery technologies are calculated and how these technologies perform with respect to inequality reduction and long-term growth in regional GDP is estimated.
1 The analysis and interpretation presented in this work are those of the author alone; they do not necessarily reflect the
Table of Contents
Abbreviations ... vii
Introduction ... 1
Background ... 3
Methodology ... 5
Summary of Results ... 7
PNPM Rural and Opportunity Costs ... 7
PNPM Rural and Income Inequality ... 11
PNPM Rural, Long-Term Growth, and Market Size ... 14
Conclusion ... 17
References ... 18
Annex: Methodology ... 20
Figure 2: Global Income Inequality Reduction Effectiveness ... 20
Table 1: Local Income Inequality Reduction ... 22
Table 2: Gains from Trade ... 24
List of Figures
Figure 1: Infrastructure Supply Indicators, Subdistrict Resolution (units = population shares)... 3Figure 2: Inequality Reduction Effectiveness (2012), GoI Budget Expenditures ... 9
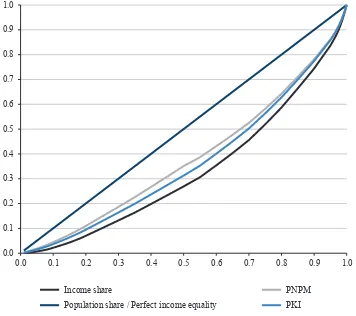
Figure 3: Lorenz Curves for Hypothetical Pre- and Post-Benefit-Allocation Income Distribution ... 23
List of Tables
Table 1: PNPM Rural’s Relative Impact on subdistrict-level Inequality ... 12Abbreviations
GDP gross domestic product
GoI Government of Indonesia
IC Infrastructure Census
ILO International Labour Organization
NBF next-best-feasible
PK Padat Karya (Public Works)
PKI Padat Karya Infrastruktur (Public Works - Infrastructure)
PNPM Program Nasional Pemberdayaan Masyarakat (National Programme for Community Empowerment)
PR PNPM Rural
PSF PNPM Support Facility
Rp rupiah (Indonesian)
Introduction
The National Programme for Community Empowerment (Program Nasional Pemberdayaan Masyarakat
or PNPM), Indonesia’s flagship community development and empowerment programme, has recorded a
long history of successful implementation as well as innovations and additions to its process ‘blueprint’. Since 2007 PNPM has been a national programme, every year providing development funding directly to more than 7,000 rural subdistricts and urban neighbourhoods across the entire Indonesian land mass.
These attributes—longevity and the flexibility necessary to refine itself through experimentation—signal
PNPM’s political and popular success generally. The current political, economic, and practical success of PNPM’s ‘development with empowerment’ model may be held in even sharper relief via a count of the number and variety of its progeny: many other successful programmes in Indonesia and worldwide start with PNPM building blocks. For example, PNPM Generasi in Indonesia may be the world’s first
example of a community-targeted conditional cash transfer programme, whereas the National Solidarity Programme in Afghanistan stands out as one of the few national-in-scope programmes in the post-Taliban period that has made headway on women’s participation in local political, social, and economic matters, while also delivering better access to basic infrastructure and social services. Likewise, Timor Leste’s Village Development Programme takes PNPM building blocks to a poorer, isolated setting. All of these programmes have PNPM foundational principles as keystones and are achieving positive results under adverse conditions.
Unfortunately, Indonesia’s infrastructure woes are at least equally as well known and documented as its successes with the community-based development model (and other social programmes) are. The 2011 Infrastructure Census (IC) report by the PNPM Support Facility (PSF 2011) reveals that 36 million people (15 percent of the population) lack access to hospitals, while 16.6 million live without accessible early childhood education facilities or junior secondary schools. Patterns in the availability of reliable transportation mirror the supply of physical and service-based health and educational capital: households in areas where education and health are in poor supply more often than not lack options for accessing neighbouring areas or regional administrative centres where education and health supplies typically improve.1 The infrastructure deficiencies (in both quantity and quality) described above are likely constraining the development of the social capital—good health and low disease burden, educated and productive workforce, and competitive trading networks, etc.—that vibrant societies with healthy economies possess.
In this report, the author used incidence analysis and economic simulation techniques to understand what advantages there would be—for both households and the Government of Indonesia—if Indonesia’s
infrastructure deficiencies were at least partially reduced using public works programmes, including
PNPM.2 The author calculated and summarised immediate and long-term impacts on household welfare
1 The IC report (PSF 2011) also demonstrates that the urban-rural divide is significant in generating these infrastructure gaps:
although about half the population live in rural areas, they bear most of the burden of low-quality or nonexistent infrastructure.
Although the IC report does not attempt to value the total inefficiency of Indonesia’s infrastructure gaps, a contemporary report
from the Philippines indicates that losses from poor transportation infrastructure alone cost about 8 percent of Philippines’s gross domestic product annually (JICA 2014).
2 Public works programmes use government expenditures to finance and build infrastructure, including public buildings such
and local economic growth only for those public works programmes that are proven and feasible in Indonesia and for which there is empirically observed implementation information. The rest of the report proceeds as follows: the background section provides details on PNPM and other Indonesian public works programmes; the purpose and methodology section describes the analytical tools employed, why they were chosen, and what their limits are3 a summary of results provides a snapshot of the
report’s findings, which indicate that PNPM Rural (PR) may do a better job of reducing inequality
and generating local economic growth than other Indonesian public works programmes do; and the conclusion describes analytical results and the implications of those results in greater detail.
Background
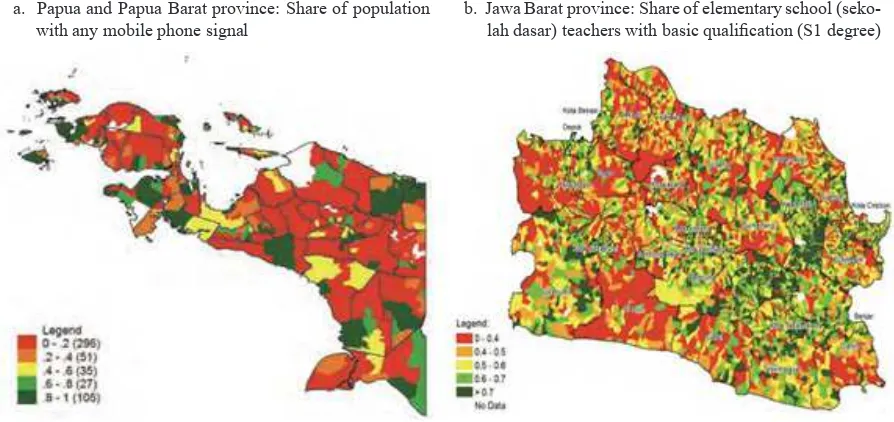
The IC report shows that the microspatial distribution of Indonesia’s infrastructure gaps is not necessarily
predictable: some villages or subdistricts are severely deficient in infrastructure in the middle of
otherwise well-served areas, whereas others with low scores appear surrounded by other low-scoring
areas (figure 1). Isolation from goods and services can have negative effects on multiple generations
when isolated communities cannot participate in the (relatively) good life shared by their neighbours. For example, if the only accessible livelihoods are traditional or local to the immediate area, then after parents decide the kind and magnitude of education and health investments to make in children, those children more often replicate their parents’ socioeconomic status and achievements.4
Figure 1: Infrastructure Supply Indicators, Subdistrict Resolution (units = population shares)
a. Papua and Papua Barat province: Share of population with any mobile phone signal
b. Jawa Barat province: Share of elementary school
(seko-lah dasar) teachers with basic qualification (S1 degree)
Source: Infrastructure census report (PSF 2011).
Indonesia’s infrastructure gaps are serious, but they present an opportunity: evidence that the generation of better social capital starts with the generation of better physical infrastructure is accumulating. Consider, for example, the impact evaluations done on the following programmes:
• The community-driven development programme in Afghanistan (Beath, Christia, and Enikolopov 2013) where access to basic health and education services increased even though the programme did not directly deliver those services (instead, the National Solidarity Programme typically funds electricity, sanitation, and clean-water projects).
• The Piso Firme programme in Mexico (Cattaneo et al. 2009), which upgraded dirt floors to
concrete floors in private housing structures in high-density, low-income communities. These
private infrastructure upgrades were as effective as nutritional supplements at improving health and as helpful for cognitive development as early childhood development programmes.
The good news is that Indonesia has a wealth of experience with several different ways of addressing
infrastructure shortages through socially beneficial programmes. For example, the PNPM subprogramme specifically for rural communities—PNPM Rural—has been used by those communities to pay for
planning, designing, procuring, and constructing basic infrastructure. One of PNPM’s bedrock principles is that decision making on the use of PNPM funds should be a decentralised, democratic, and participatory process, and the ‘menu’ of potential PNPM block grant uses is more or less open and unconstrained. Therefore, there is no guarantee that PR funds will be used for infrastructure projects; however, the long-run average share of infrastructure installation in PR fund usage has been stable at about 70 percent.5
The most consistently popular PR infrastructure projects are roads, bridges, drainage/irrigation construction or rehabilitation, clean water and public sanitation installations, and health and education building construction or rehabilitation. The popularity of these infrastructure projects in an ‘open menu’
environment—in which communities are expected to determine the most beneficial capital/good/
service for local development using their own information, knowledge, and experience—indicates that
rural communities receiving PNPM funds are aware of the same infrastructure deficiencies that the IC
describes.
PR is not the only tool the Indonesian government has for remedying infrastructure gaps while
simultaneously providing socially desirable benefits and outcomes. Indonesia also has experience in
delivering infrastructure through standard public works programmes. For example, the Padat Karya
(PK) programme—which also has a long history—provides short-term employment in rural communities
through construction of infrastructure. In addition, in 2009, a federal fiscal stimulus package included a large spending component specifically for short-term job creation through infrastructure projects.
In the analytical exercises that follow, the author calculated and summarised immediate and long-term impacts on household welfare and local economic growth from these Indonesian public works programmes. Although many more programmes exist whose main objective is to build infrastructure, the author focuses on Indonesian public works programmes because they have long implementation histories and a relatively complete, accessible, public administrative record (from which an analyst
can generate empirically based parameters to be used in simulation) and they are all financed by the
Government of Indonesia.
5 This 70 percent share includes PR-procured and -built health centres and school buildings. PR is also used to fund core
and supplementary health and education activities; such activities certainly enhance the service-based infrastructure available locally, and if they were included, the ‘infrastructure share’ of PNPM funding would rise to just more than 80 percent. The remainder (in an average year, just below 20 percent) typically goes to a savings and loan programme for female members of the community. See PNPM’s information package/kit for 2012–13 or 2014 (Sekretariat Pokja Pengendali PNPM Mandiri
Methodology
This report takes as its ‘jumping off point’ the following empirically verified fact: individuals
households, or communities with infrastructure access are better off than similar individuals households, or communities without. The author proceeded to answer a logical follow-up question: when a choice exists among feasible infrastructure-provision technologies, which technology produces greater gains in other desirable social objectives such as inequality reduction or long-term income growth?6
To answer this question, the author used economic simulation techniques, together with incidence analysis, to form expectations about the advantages of different Indonesian public works programmes that provide welfare-enhancing infrastructure. The author analysed only those programmes that have proved feasible (including politically feasible) in Indonesia and for which empirically observed implementation information exists.7
The simulated portion of the exercises below consists of calculating well-known statistics—the Gini
coefficient of income inequality, for example—that would result from implementing each of the feasible infrastructure-delivery technologies, either nationwide or locally. For the first two simulations (sections A and B), the author also undertook incidence analysis of benefits distributed; that is, they estimated
who gets what when, for example, the PK programme builds a bridge. With these two techniques and with the available empirical information on programme implementation, the author formed reasonably precise estimates on how the available technologies perform with respect to inequality reduction and long-term growth in regional gross domestic product (GDP).
Additional discussion of methods follows the introduction of each analytical exercise whereas the annex provides a longer, more detailed exposition; meanwhile, it should be made clear what the analytical exercises below are not:
• First, the results presented below are always and everywhere relative: that is, they describe how large or small the impacts of one technology are for delivering infrastructure through public works in comparison with another technology; absolute impacts are not estimated or discussed.
• Second, the exercises that follow do not comprise an impact evaluation, although they
use coefficients estimated by statistical impact evaluation (when available) to parameterise
administrative elements of the infrastructure-delivery technologies.
• Third, the empirical patterns presented are not generated by assuming differential impacts.
Rather, the working assumption (applied throughout the analysis summarised here) is that, if a piece of infrastructure of similar quality were built in a similar location, the built infrastructure itself would have had the same impacts on households and individuals no matter which technology delivered it.8
6 Equally important, the author asked under what conditions will such greater effectiveness hold.
7 The simulations undertaken are based on these observed (and recorded) parameters; therefore, the analysis that follows has
only scant discussion of possible ranges of results.
8 Long-time observers of development strategy in Indonesia (and of Indonesia-specific public works and infrastructure-building initiatives specifically) may question this assumption. Theoretically, when local information and knowledge is embodied in
infrastructure project type and location, the resulting infrastructure built could produce larger long-term productivity gains than a similar type of infrastructure in a slightly different location or a different type of infrastructure in the same location. However, there is not enough publicly available empirical information to parameterise the likely size of this theoretical advantage in
Summary of Results
Overall results from the impact simulations indicate that, when compared with other public-works infrastructure-delivery technologies Indonesia has implemented or is implementing, PR’s process technology for infrastructure delivery does the following:
• Creates lower opportunity costs by being more effective at reducing national income inequality per piece of infrastructure built
• Provides a larger reduction in local income inequality per rupiah budgeted for infrastructure (via direct transfers)
• Generates larger long-term income gains for regional economies per year of programme implementation
These points are discussed in more detail in the conclusion of this paper.
It is worth reiterating that the above results will not necessarily apply to the types of infrastructure that PNPM Rural does not typically build. It also bears repeating that the results are generated by referring to parameters that describe how these infrastructure-delivery programmes actually function in Indonesia.9 This means that all the technologies under consideration have actually provided short-term jobs through infrastructure construction, so these technologies are all feasible (including politically) to implement in Indonesia and the impacts under discussion are, in a sense, by-products of that implementation.
PNPM Rural and Opportunity Costs
A recent study (PSF 2012) confirmed that PNPM Rural generates significant cost savings per unit of
infrastructure relative to the next-best-feasible (NBF) process, in this case line ministry- and/or district-funded basic infrastructure.10 This PR cost advantage decays as projects get more complex—the PR cost savings on gravel roads are larger (per unit) than those on concrete roads and the cost savings on concrete roads are larger than on bridges. This is possibly tied to the amount of local labour, local materials, and local expertise (for oversight, supervision, and management of resources); that is, when projects get more complex, outside contributions from skills, materials, capital, and expertise that are unavailable locally will be necessary.11
9 For both reasons, the results presented in this report are not generalisable to activities PNPM Rural does not fund: only two
technologies are considered (PNPM Rural and the other GoI programmes that have delivered public works infrastructure) and only some types of infrastructure (the basic infrastructure popular in rural communities receiving PNPM block grants).
10 Comparisons were made in a single unit (e.g., for road or school construction projects, costs were calculated per square
meter) in order not to bias results toward any particular production technology; however, the comparison is still limited to the universe of infrastructure items that PNPM has a history of selecting and building.
11 It is worth mentioning here that the district-led comparison projects’ quality has not been directly observed while that for PNPM Rural infrastructure projects was rated on an ‘absolute’ basis according to engineering specifications. So, the cost
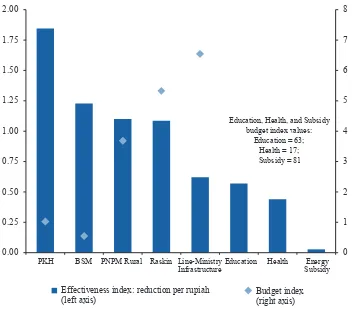
To isolate PNPM Rural’s cost advantage in programming, planning, designing, procuring, and building basic infrastructure for local development, the author ranked its effectiveness in generating desired outcomes—in this case, reduction in income inequality—next to other components of Government of Indonesia (GoI) spending, including NBF line-ministry-funded infrastructure expenditures. Figure 2 ranks components in a typical GoI budget for the year 2012 according to an index summarising how large a reduction in income inequality each rupiah of expenditure produces (the blue bars).12 That is, it shows relative ‘bang for the buck’ for each spending component, assuming that reduction in income inequality is a spending objective.
PNPM Rural’s effectiveness at reducing income inequality is ranked in between the largest—Rice for the Poor (Program Subsidi Beras bagi Masyarakat Berpendapatan Rendah)—and the smallest— Conditional Cash Transfer Programme for Families (Program Keluarga Harapan)—direct transfer programmes,13 which shows PR to be about as effective per rupiah as Rice for the Poor is.
12 Except for the line-ministry infrastructure component, all the information necessary to generate the effectiveness index in figure 2 is taken from an incidence analysis of 2012 budget expenditures (see World Bank, forthcoming). World Bank
(forthcoming) combines primary data from the public expenditure and revenue side (from audited government budget reports, the Lapangan Keuangan Pemerintah Pusat) with primary, representative data from the household side (from the Susenas
household survey) to allocate certain categories of public expenditures as ‘benefits’ to and public revenues (generated from
private, noncorporate taxes) as ‘burdens’ imposed on households. The resulting incidence analysis can indicate for each public programme, expenditure stream, or revenue stream the effect of that public expenditure element on poverty and income inequality.
13 The higher effectiveness in the smaller direct transfers could be reduced if those programmes’ budgets were increased while
total inequality reduction (delivered by the programme in question) remained the same. For example, if the Conditional Cash Transfer Programme for Families had a larger presence in Eastern Indonesia, it might result in larger programme expenditures but smaller reductions in inequality (per expenditure rupiah) in Eastern Indonesia. It is equally plausible, however, that a
marginal Conditional Cash Transfer Programme for Families rupiah of direct benefits (in any programme) is actually more
effective: in both PNPM Rural and PNPM Generasi, socially beneficial impacts attributed to the programmes were larger in
worse-off areas. However, both for Indonesia specifically and internationally, very little investigation has been done of the rate
Figure 2: Inequality Reduction Effectiveness (2012), GoI Budget Expenditures
Notes: BSM = Scholarships for the Poor; PKH = Conditional Cash Transfer Programme for Families; Raskin = Rice for the
Poor. PR and NBF-alternative direct benefits are allocated to individuals surveyed for the National Social and Economic Sur -vey (Survei Sosial dan Ekonomi Nasional or Susenas 2012) according to administrative parameters; NBF-alternative cost (per unit of infrastructure) is 1.78 times greater than PR’s cost assuming PR and the NBF alternative deliver the same total amount
of infrastructure and distribute equal amounts of direct benefits to equal numbers of people. Further details are included in the
annex on methodology.
However, direct cash or near-cash transfers are not apt comparisons, as neither delivers infrastructure in addition to reduced inequality. Rather, the right comparison for PNPM is the NBF infrastructure production process, assuming the NFB process can produce the same amount of same-quality infrastructure as PR. At equivalent levels of infrastructure production and assuming district-led infrastructure procurement has the same consequences on the national income distribution as does PR14, the NBF infrastructure production process produces less ‘bang for the buck’ (and has a lower ranking on the effectiveness index than PR) because of its higher costs per unit of infrastructure.
14 In fact, district-led infrastructure procurement has very different consequences from PNPM Rural for local (i.e.,
subdistrict-level) income distributions (see section B). The assumption employed in section A is made for convenience and only in order to allow a comparison on an ‘effectiveness’ metric between PNPM and the NBF alternative for basic infrastructure. There is not enough publicly available information to calculate the consequences of the NBF alternative for infrastructure on the national income distribution. However, enough information is publicly available to generate parameters or limits for the consequences of the NBF alternative for infrastructure on local income distributions. From a theoretical sum of all these local income distributions, it is not unreasonable to guess that the consequences of the NBF alternative for infrastructure is no better than PNPM; that is, the NBF alternative would not reduce income inequality by more than the PNPM Rural programme (at equal levels of infrastructure production). See section B for details.
0
PKH BSM PNPM Rural Raskin Line-Ministry Infrastructure
Effectiveness index: reduction per rupiah (left axis)
Budget index (right axis)
Education, Health, and Subsidy budget index values:
Ranking programmes in this way—next to their 2012 GoI budget expenditure contemporaries— puts opportunity cost into high relief. It is clear that many of the GoI’s ‘social’ expenditure streams, including building infrastructure through public works, are inequality reducing. Even the non-‘social’, non-targeted expenditure streams such as energy subsidies may reduce income equality somewhat.15 Nonetheless, when inequality reduction is an objective and resources are scarce, the most effective way to reduce inequality is to dedicate more resources where the ‘bang for the buck’ is highest. To do otherwise incurs higher opportunity costs than are strictly necessary.
It is worth mentioning again that the cost-of-infrastructure comparisons are limited to the types of infrastructure that PR participants typically choose. As PR’s cost advantage decays with project complexity, so too will its effectiveness advantage over the NBF alternative. Therefore, PNPM is not a
panacea for Indonesia’s infrastructure deficiencies; rather, it is a low-opportunity-cost way to address local deficiencies in basic infrastructure with positive knock-on effects across the national income
distribution. When infrastructure is more complex and/or cannot be completed entirely with local resources (including when a single infrastructure project must span local political or administrative boundaries to be useful), then other infrastructure delivery methods may become more cost-effective.
Also worth mentioning here are some of the important methodological details behind the incidence
analysis of the direct benefits from PR and the NBF alternative underlying the numerator in the effectiveness index in figure 2 (the annex on methodology contains further detail). PR direct beneficiaries
(those receiving wages or wagelike payments for participating in infrastructure production) cannot be
identified in the primary household survey—the National Social and Economic Survey (Survei Sosial
dan Ekonomi Nasional or Susenas)—in order to allocate PR direct benefits.16 However, from PNPM administrative records, it is possible to calculate about how many working days are generated (on
average by subdistrict) and how many workers are given benefits (on average by subdistrict), and an
average PNPM Rural ‘wage package’ can be distributed to the approximate number of actual rural
direct beneficiaries. The line-ministry infrastructure ranking shown in figure 2 is a simulated outcome
only—no incidence analysis of line-ministry infrastructure expenditures was attempted. Rather, to generate this NBF alternative’s effectiveness indicator, it was assumed that it could produce as many infrastructure units (in as many locations) as PR and that, if it did so, it would generate an equivalent reduction in inequality.17
15 Energy subsidies in Indonesia are not poverty targeted; non-poor households receive a far greater share of the total subsidies
available simply by consuming larger amounts of subsidised energy (vehicle and household fuels and electricity). However, relative to their own pre-subsidy incomes, energy subsidies are ‘worth’ as much to poorer households as to richer households:
households in the poorest or richest pre-subsidy income decile receive a subsidy benefit equal to about 10 percent of their
own pre-subsidy incomes. The resulting post-subsidy income distribution is slightly more equal than the pre-subsidy income distribution in 2012 (see World Bank, forthcoming). However, the GoI dedicates a large amount of revenue each year for these subsidies, so energy subsidy effectiveness is positive but small.
16 For the transfer programmes—Rice for the Poor (Raskin), Scholarships for the Poor (Bantuan Siswa Miskin), and the
Conditional Cash Transfer Programme for Families—for in-kind social expenditures on health and education, and for subsidies,
beneficiaries were identified directly in Indonesia’s household survey, for example, by consulting their health and education
usage.
17 Again, long-time observers of public works and infrastructure-building initiatives in Indonesia could question this assumption of equal capabilities. For example, standardised, ‘one size fits all’ project specifications without local design inputs or local fiduciary oversight may be more likely to provide direct benefits (wages and wagelike payments) to local participants
PNPM Rural and Income Inequality
Much as PR’s relative effectiveness in global (across Indonesia) inequality reduction can be compared
with any other programme that attracts significant public expenditure, one can also generate and compare
the relative impacts of PR on local or subdistrict-level income inequality. To do so requires knowing who gets what in the programmes one would like to compare, as well as knowing ‘how much’ and ‘in what form’ for at least one of the programmes. In the results presented here, the NBF infrastructure alternative comparison is actually two different programmes: the infrastructure / public works component of the 2009 stimulus package (which amounted to Indonesian rupiah [Rp] 73.2 trillion worth of expenditures overall) and the ongoing Padat Karya Infrastruktur (PKI) public works programme.18
Table 1 summarises the impact of PR on local income inequality relative to the NBF alternative’s
impact. In this section as in section A, any impacts on inequality occur through receipt of direct benefits:
only wages and wagelike payments distributed directly to beneficiaries are counted in this exercise.19
The exercise in this section holds the budgets and/or financial inputs constant (‘Suppose one gave
an equal amount of money for infrastructure to both PNPM and the NBF-alternative programme’)
and assumes the indirect benefits of the infrastructure would be of the same magnitude regardless of
which process produced the infrastructure in question.20 By making such assumptions, one can compare
the impacts from the PR implementation procedures (how financial inputs are converted into outputs)
relative to the NBF-alternative process.
18 The two-NBF strategy is necessary as not enough public information is available to parameterise either programme fully.
Nonetheless enough public information is available to allow some parameterisation of both programmes; furthermore, the information used in parameterisation records actual programme implementation (similar to the PR information used here), rather than planning documents or intentions, so it is the best publicly available expectation of the outputs likely from a centrally administered public works / infrastructure programme.
19 Counting only direct benefits is functionally equivalent to making the following untested assumption: completed
infrastructure of a similar quality constructed in the same location will have the same beneficial short-, medium-, and long-term impacts regardless of the procurement process. Although the medium- and long-infrastructure of a similar quality constructed in the same location will have the same beneficial short-, medium-, and long-term impacts of the PR programme have
been extensively documented and convincingly identified in a quasi-experimental setting, no similar evidence yet exists for the
NBF-alternative programmes (the PK programmes and the 2009 stimulus package). Furthermore, the PR impact evaluations
cannot disentangle the impacts of the direct benefits (community grants) from the impacts of the PNPM process (i.e., locally
decentralised, inclusive, and democratic participation in the generation of infrastructure proposals and development agenda setting; informal institutions and procedures for generating a high local labour and materials quota in PNPM-funded projects;
and local fiduciary control, transparency, and accountability; among other important elements) from the impacts of the indirect benefits (better infrastructure leads to higher productivity and then to higher incomes).
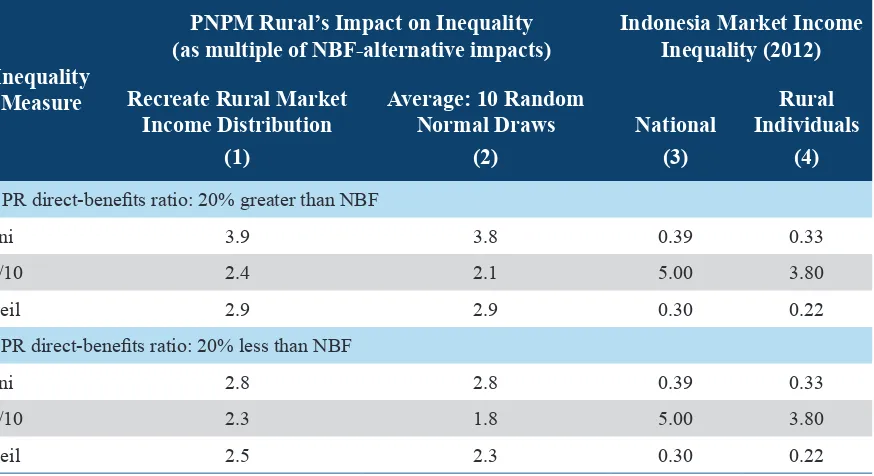
Table 1: PNPM Rural’s Relative Impact on subdistrict-level Inequality
Inequality Measure
PNPM Rural’s Impact on Inequality (as multiple of NBF-alternative impacts)
Indonesia Market Income
Theil 2.9 2.9 0.30 0.22
B. PR direct-benefits ratio: 20% less than NBF
Gini 2.8 2.8 0.39 0.33
90/10 2.3 1.8 5.00 3.80
Theil 2.5 2.3 0.30 0.22
Notes: PR and NBF impacts generated by allocating direct benefits to hypothetical pre-transfer income distributions. Pre-transfer income
distributions generated by random draws from truncated normal distributions; further details in the annex on methodology. Panels A and B
summarise impacts for two different relative values of the PR direct-benefits-to-budget ratio.
Table 1’s first and second columns represent PR’s impact—relative to the NBF alternative—from direct benefits on local (within a subdistrict) income inequality. To calculate these impacts, hypothetical
subdistrict-level income distributions were first created.21 Then, to individuals represented in these
income distributions, the PR and the NBF-alternative direct benefit pool for local residents was
randomly allocated (in uniform amounts) so that the bottom 50 percent of the population (ranked by
pre-benefit income) received 70 percent of the benefit pool and the top 50 percent of the population
received the remaining 30 percent; the top 10 percent of the population received no direct benefits.22
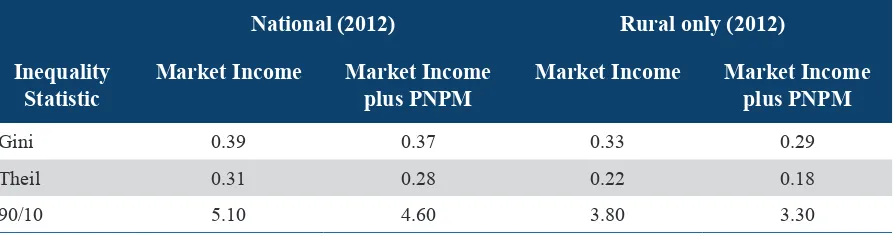
The third and fourth columns provide (for reference) inequality statistics for the actual 2012 market income distribution (as recorded in and calculated from Susenas household records; see World Bank, forthcoming).
Table 1 indicates that the way in which PR distributes direct benefits reduces income inequality by
larger amounts than the NBF alternative. For example, the percentage point reduction in the local
(subdistrict-level) Gini coefficient from PR direct benefits is (on average) about three to four times
greater than for the NBF alternative. Similarly, for the local 90/10 ratio or the Theil index of local
income inequality, PR’s distribution of direct benefits reduces inequality by about two to three times the
size of the reduction in income inequality from the NBF alternative.
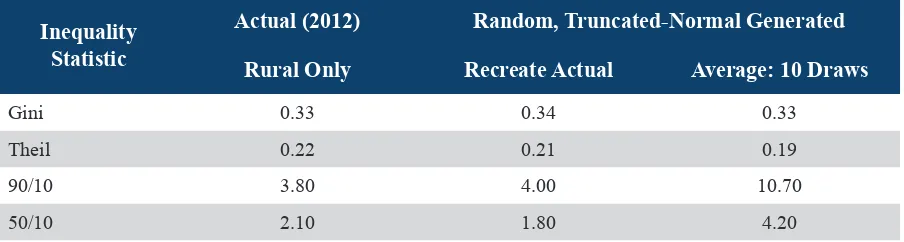
21 In column 1, a draw from a random normal distribution was taken and then income was added and subtracted randomly
until the underlying inequality statistics approximately matched the 2012 market income distribution for rural individuals. The resulting income distribution ‘looks’ like the actual rural income distribution in Indonesia. In column 2, the underlying income distribution is an average of repeated random draws from a (truncated) normal distribution; no post-draw adjustments were made. See the annex on methodology for further details.
The first of two parameters (which summarise administrative details) that drive this result is the direct-benefits-to-budget ratio, which describes how much of any budget for an infrastructure project ends up as wages paid directly to beneficiaries participating in infrastructure production. For example, in the 2012 version of PKI the direct-benefits-to-budget ratio was about 58 percent, whereas the total budget
for that year was Rp 136 billion for 360 infrastructure packages (International Labour Organization [ILO] 2014). In the 2013 version of PKI, the same ratio had fallen to 48 percent or less23 when the budget increased to Rp 252 billion (for 1,025 infrastructure packages). The 2009 stimulus package’s
budget for infrastructure was much larger—nearly Rp 12 trillion—but beneficiaries received less than
a quarter of that budget directly as wages.24 In contrast, in the long history of PR’s implementation, it is estimated (Papanek 2007) that about 60 percent of PR’s community-controlled block grants ended up as direct wage (or wagelike) payments when participants chose basic infrastructure projects.25
The second parameter that matters for local income inequality measures what proportion of the
direct benefits available are captured by or distributed to the local population; call it the ‘localisation’
parameter. During the infrastructure component of the 2009 stimulus package, for example, 42 percent
of the available direct benefits from the infrastructure / public works component went to beneficiaries
living outside the district in which the project was located.26 These benefits cannot be counted in the post-programme income distribution of the subdistrict or village where the infrastructure construction took place.
Now consider the ‘localisation’ ratio and direct-benefits-to-budget ratio combined into a ‘locally delivered direct benefits to budget’ ratio. For a given budget, the PR management technologies— fiduciary controls, transparency and accountability, and implicit ‘local content’ standards among others—together generate a higher ‘locally delivered direct benefits to budget’ ratio than the NBF alternatives. These features matter individually to the local communities receiving benefits, even while
they may ‘net out’ at broader provincial or national levels.27
23 This percentage is ‘or less’ because the publicly available 2013 PKI budget information does not include a ‘technical
assistance’ component, whereas the publicly available 2012 PKI budget information does include an amount for ‘technical
assistance’. In other words, the 2013 PKI direct-benefits-to-budget ratio is calculated off a budget that is artificially low. 24 Therefore, experience in Indonesia suggests there is no reason to expect that, if the existing PK programme were expanded to more areas or more projects, the direct-benefits-to-budget ratio would stay constant.
25
The lower direct-benefits-to-budget ratios in the NBF alternatives may have to do with (1) a policy-mandated capital-labour ratio for all projects regardless of complexity or scope; (2) a lack of technical and supervisory capability embodied
in agency officials at the project site, so that such skills must be ‘imported’ from outside the project region; or (3) a lack of
‘rationalisation’ of infrastructure project choice to suit local needs and local skills. There are few publicly available estimates
of the PR direct-benefits-to-budget ratio; therefore, table 1 presents two different scenarios. Panel A summarises the case in
which this ratio is 20 percent higher in PR than in the NBF alternative (and so could describe the case in which the NBF-alternative ratio is 0.5 and the PR ratio is 0.6). Panel B summarises the case in which this ratio is 20 percent lower in PR than in the NBF alternative.
26 There is no publicly available information on the spatial distribution of the 58 percent of the within-district direct-benefit
recipients. That is, for projects located in rural areas, it is not known how many within-subdistrict and within-village direct
beneficiaries exist among within-district beneficiaries.
27 That is, even though only a fraction of an infrastructure budget is turned into direct payments to local participants, the author assumed in this paper that the rest of the budget for direct benefits is paid (eventually) to an Indonesian or Indonesians
somewhere. The comparison above does not assume differential rates of leakage and/or corruption in the management of
budgets in PR and the NBF alternative. Any ‘outside the district’ or ‘outside the subdistrict’ beneficiaries in either PR or the
PNPM Rural, Long-Term Growth, and Market Size
PR has a ‘saturation’ targeting strategy—every rural subdistrict receives a PR block grant every year—
which produces benefits for local economies that can be quantified relative to the NBF alternatives
through parameterisation. This section again uses economic theory and incidence analysis to guide a
calculation of such benefits.
A brief detour into the economics of international trade is necessary to understand the results that
follow. A popular theory with roots in and confirmation from empirical macroeconomics indicates that
the amount of trade between two economies is expected to be proportional to the product of their GDPs. This ‘gravity equation’ for international trade (Anderson and van Wincoop 2003) has also been used to benchmark intranational exchange, for example among cities or among states in the United States.28 As
an oversimplification: the gravity equation indicates that any increase in a country’s trading partners’
GDPs or any reduction in trade costs between that country and its trading partners is good for the country GDP-wise.
To predict GDP growth from the gravity equation, estimates of economywide income (or changes) are necessary. PR’s medium-term impact on household consumption—documented in a quasi-experimental statistical exercise—was estimated to be 9.1 percentage points over a three-year period. The household sample for the impact analysis was random within a subdistrict and the changes in government spending and exports and imports were not documented (PSF 2012). Assuming an average household marginal propensity to save of 0.1, total household income in the district would have increased by roughly 10 percent during the three-year period.29
With the gravity equation, the expected increase in exchange between any two neighbouring subdistricts that results from increases in income (or from reductions in trade costs, or from both) can be calculated. Table 2 demonstrates the effects of that increase in subdistrict income on additional trade among subdistricts (per the gravity equation) under both PR and the NBF alternative.30 The second column focuses on severely isolated areas and indicates the relative PNPM impacts on regional growth for a set of about 1,000 subdistricts that are surrounded by neighbouring districts with low scores for both the quantity and quality of health, education, and transport supply.31
28 As the proportional factor in the gravity equation depends on the costs of trade between any pair of economies (as well as all ‘nontariff barriers’ or ‘resistance’ to trade) and such costs are usually much less difficult to quantify for intranational trade,
the gravity equation is equally valid theoretically and receives equal empirical support when used in intranational settings (see, for example, McCallum 1995).
29 In results not shown here, the incidence analysis described in section B (and in World Bank, forthcoming) indicates that direct benefits from PNPM Rural infrastructure spending and production increase total market income of rural individuals by
about 9.5 percent. The consumption gains measured by the PNPM Rural Impact Evaluation (PSF 2012) cannot necessarily be
attributed to the direct benefits provided by PNPM Rural alone; however, provided the long-term gains to local individuals are at least as large as the income gains from direct benefits, then total consumption gains of 9 percent on total income gains of at
least 9.5 percent imply a marginal propensity to save of at least 0.05.
30 Here again, the author assumed that, had the NBF alternative built similar infrastructure of similar quality in the same location and with the same amount delivered locally as direct benefits, the impact on household consumption and income in a
three-year period would have about equalled the observed PR impact.
31 These subdistricts are surrounded by neighbours who, on average across all neighbours, score below the 25th percentile in
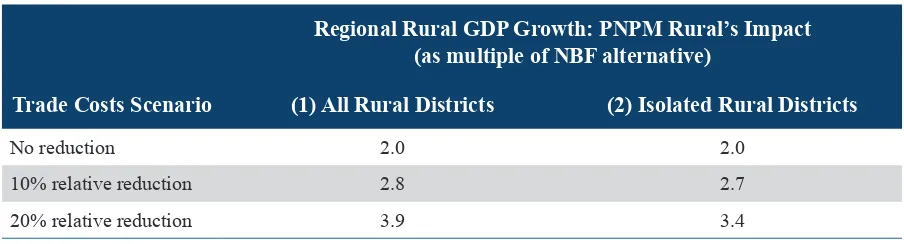
Table 2: PNPM Rural’s Relative Impact on Medium-and Long-Term Regional Growth
Trade Costs Scenario
Regional Rural GDP Growth: PNPM Rural’s Impact (as multiple of NBF alternative)
(1) All Rural Districts (2) Isolated Rural Districts
No reduction 2.0 2.0
10% relative reduction 2.8 2.7
20% relative reduction 3.9 3.4
PNPM Rural generates greater long-term growth from higher levels of exchange or trade among the rural regional economies where it distributes development grants. PR’s advantages here are twofold: First, incomes grow faster in a PR subdistrict while they are also growing faster in any neighbouring subdistrict also receiving PR. The publicly available information on geographic targeting within the NBF alternatives indicates that PKI targets a uniform distance among projects (ILO 2014). As (1)
PKI hoped to establish 1,025 projects in 2013 while (2) PR distributed grants to more than five times that many subdistricts, and (3) the median number of neighbours for any rural subdistrict is five, it is
unlikely that PKI funds projects frequently in any subdistrict at the same time that it is funding a project in any one of that subdistrict’s neighbours (and even less likely that it would fund projects in the entire set of neighbouring rural subdistricts). So, for the comparison summarised in table 2, the author has assumed that, for any subdistrict receiving a PKI project, all of that subdistrict’s neighbours do not experience an increase in income from infrastructure production.
As intersubdistrict trade flows are not readily available, table 2 does not represent an estimate of the increase in actual trade flows arising from infrastructure projects. Table 2 compares the expected impact on trade flows from the PR and NBF-alternative infrastructure programme at any level of trade greater
than zero between a rural subdistrict and all of its rural neighbours, if trade patterns among neighbouring subdistricts in Indonesia are reasonably described by the gravity equation.32
However, compelling international evidence exists that infrastructure that increases access to markets creates more intervillage or interregional trade. A rural roads rehabilitation project in Sierra Leone that improved existing roads and paths in order to better link ‘local markets to villages or to a more important road’33 was the subject of a statistical impact evaluation (Casaburi, Glennerster, and Suri 2013). The project had the objective of creating as many connections as possible (in other words, to create or improve networks), and the positive impacts (on reduced transport costs and increased agricultural revenues) were larger (1) the more remote a targeted region was from the nearest large town, (2) the less agriculturally productive the regions receiving the intervention were, and (3) the less well-connected the region was to regional and/or national markets in general.34
32 In order to estimate what the medium- and long-term trade and market size advantages might be of either PR or the NBF
alternative, a list of all subdistricts sharing a border with each rural subdistrict was created. PR administrative data indicate which of any subdistrict’s neighbours also receive PNPM Rural block grants. In order not to disadvantage rural subdistricts that have few neighbours, a composite trading partner that is a geometric average of all potential trading partners was created.
33 As Casaburi, Glennerster, and Suri (2013) state, ‘because these [local] roads do not dramatically alter access to population
centres, they are unlikely to modify migration patterns in the areas surrounding the rehabilitated roads.’ In other words, like the PR programme, the programme targets the local margin and local economic activity.
34 This was true even though rural roads along which there is more economic activity, more people, and/or more schools,
Although Sierra Leone’s agricultural market likely has significant structural differences from the Indonesian rural economy, it is instructive that targeting local economic networks creates significant
value even when the local economies in the network are each individually small (which is what the gravity equation indicates). PR takes advantage of this feature of exchange by distributing annual grants without priority: no matter where the centres of exchange are within a district, PR provides every administrative unit below the district level the means to help its inhabitants to access that centre.35
The second advantage of PR’s saturation targeting is that it likely lowers the costs of trade between any trading pair.36 Indeed, the impact of PR summarised in table 2 is more sensitive to the likely reduction in trade costs than to the relative isolation of the subdistricts covered.37 Interregional trade costs cannot necessarily be reduced if only one of the nodes in a network reduces its cost of trading: a trading network depends on the price of access to markets for both producers (suppliers) and consumers (middlemen, traders, or households themselves; that is, the demand side).
Table 2 provides a summary of the relative advantage of PR’s saturation strategy when it reduces overall trade costs between a PR-receiving district and all its rural neighbours by both 10 and 20 percent.38 This is likely a conservative estimate of the actual range of reduction in transport costs: evidence from the Sierra Leone rural road rehabilitation project described above indicates a 60 percent reduction in transport costs (on average), whereas studies of an earlier village-based public works project in Indonesia indicated transport cost reductions of 30 to 60 percent (Gnagey 2000).39
For rural subdistricts and rural regional economies in particular, the PR saturation strategy likely does a better job at generating sustained local regional growth, as long as there is some trade among neighbouring subdistricts. Although it does not mean—and should not be assumed to mean—that the NBF alternatives generate less growth nationwide, it does mean that PR’s targeting strategy leads to
more trade among rural neighbours and therefore more rural-specific growth overall.
35 Note that this objective—to take advantage of the multiplicative gains from connecting relatively small economies to
one another—is qualitatively different from an ‘invest more money in local infrastructure anywhere’ objective. The overall quantitative impacts on exchange and growth, as well as the spatial distribution of those impacts will likely differ under those two objectives, as demonstrated by the gravity equation.
36 As alluded to by the authors of the Sierra Leone study (Casaburi, Glennerster, and Suri 2013), interregional trade costs
cannot necessarily be reduced if only one of the nodes in a network reduces its own cost of trading. Rather, a trading network depends on the price of access to markets for both producers (suppliers) and consumers (intermediaries, traders, or households themselves—the demand side). To take the Sierra Leone example, if the production area reduces its own transport costs (through better roads), but the area where the products’ demand originates faces unchanged transport costs (because it did not improve its own roads), then the amount demanded (and the price paid for it) may not change.
37 PR’s total impact, as well as the total impact of the NBF alternative, also depends on the gravity equation describing
regional trade well. The extent to which the gravity equation does not describe trade among rural subdistricts well may or may not have a larger effect on the impact of PNPM Rural on regional growth than its effect on the NBF alternative’s impact.
38 Within this exercise, which compares relative impacts of two different infrastructure production alternatives, the trade cost
reductions can be considered relative as well. In other words, the exercise does not actually assume that there is no reduction in costs in the NBF-alternative targeting strategy (uniform distance among projects); it only assumes that the PR targeting strategy (saturation) achieves a reduction in transport costs that is 10 to 20 percent greater than the NBF-alternative reduction.
39 Nearly 1,800 villages in Java were part of the survey; the mean/median reduction in transport costs over two years was
Conclusion
The simulation exercises summarised above demonstrate that PNPM Rural has at least three salient advantages when PNPM block grants and PNPM institutions are used to decide on, plan and design for, and procure basic infrastructure projects:
1. Costs: PNPM Rural creates lower opportunity costs relative to the NBF alternative by generating larger global income inequality reductions per piece of infrastructure built. In addition, PR’s saturation targeting strategy lowers the costs of trade more quickly between a subdistrict and its rural neighbours, encouraging greater levels of exchange and higher long-term income growth.
2. Localisation: PNPM is more effective than the NBF alternative at transforming any direct-transfer budget (i.e., wages for participation in infrastructure production) into local direct transfers. This means that PR provides a larger reduction in local income inequality per rupiah budgeted for basic infrastructure projects.
3. Regional income: Relative to the NBF alternative, PNPM Rural generates larger long-term income gains for regional economies per year of programme implementation.
The advantages described by this report are not necessarily independent from one another; for example, the lowering of costs (per unit of infrastructure) may well be driven by the PNPM institutions which informally—through community-based decision-making and planning—and formally—through locally
based fiduciary and corruption controls—contribute to higher ‘direct benefit’ and ‘localisation’ ratios. This in turn may mean that PR benefits from lower-priced inputs into any infrastructure project and
thereby keeps costs down.
In addition, the advantages described here are relative only; the magnitude of the numbers presented has been generated by administrative comparison of PNPM Rural to other Indonesian programmes that have successfully built infrastructure through public works. The numbers generated and described apply only to the sorts of basic infrastructure projects that PR communities have chosen to build throughout its long implementation history.
It is clear that, caveats aside, any government (at any administrative level) interested in rural regional growth and inequality reduction through infrastructure public works has good reason to pay close
attention to PNPM Rural. As mentioned above, Indonesia’s infrastructure deficiencies are well known
and are particularly acute in the same rural areas in which PNPM has been operating. Any government
References
Anderson, James, and Eric van Wincoop. 2003. ‘Gravity with Gravitas: A Solution to the Border Puzzle’. American Economic Review 93(1): 170–92.
Beath, Andrew, Fotini Christia, and Ruben Enikolopov. 2013. Randomized Impact Evaluation of Afghanistan’s National Solidarity Programme. Washington DC: World Bank.
Casaburi, Lorenzo, Rachel Glennerster, and Tavneet Suri. 2013. ‘Rural Roads and Intermediated Trade: Regression Discontinuity Evidence from Sierra Leone’. Available from http://ssrn.com/ abstract=2161643.
Cattaneo, Mattias, Sebastian Galiani, Paul Gertler, Sebastian Martinez, and Rocio Titiunik. 2009. ‘Housing, Health, and Happiness’. American Economic Journal: Economic Policy 1(1): 75–105.
Gnagey, Richard. 2000. Impact and Analysis Study. Jakarta, Indonesia: Engineering and Management Core Consultant Services, Mott MacDonald Limited.
ILO (International Labour Organization). 2014. Public Works as a Safety Net: Research from ILO in Indonesia. Available at: http://www.socialprotection.org/gimi/gess/RessourceDownload. action?ressource.ressourceId=39229&pid=2207.
JICA (Japan International Cooperation Agency). 2014. Roadmap for Transport Infrastructure Development for Metro Manila and Its Surrounding Areas (Region III & Region IV-A) in the Republic of the Philippines: Final Report. Available at: http://libopac.jica.go.jp/detail?bbid=1000015138
Levine, David, and Jon R. Jellema. 2007. ‘Growth, Industrialization, and the Intergenerational Correlation of Advantage.’ Industrial Relations: A Journal of Economy and Society 46(1): 130–70.
McCallum, John. 1995. ‘National Borders Matter: Canada-U.S. Regional Trade Patterns’. American Economic Review 85(3): 615–23.
Papanek, Gustav. 2007. The Employment and Poverty Impact of PNPM. Washington, DC: World Bank.
Subbarao, Kalanidhi, Carlo del Ninno, Colin Andrews, and Claudi Rodríguez-Alas. 2013. Public Works as a Safety Net: Design, Evidence, and Implementation. Washington, DC: World Bank.
PSF (PNPM Support Facility). 2011. Infrastructure Census: Report on Infrastructure Supply Readiness in Indonesia: Achievements and Remaining Gaps. Jakarta, Indonesia: PNPM Support Facility.
PSF. 2012. PNPM Rural Impact Evaluation. Jakarta, Indonesia: PNPM Support Facility.
Sekretariat Pokja Pengendali PNPM Mandiri. 2012. PNPM Mandiri Information Package 2012–2013. Jakarta, Indonesia: PNPM Support Facility.
Sekretariat Pokja Pengendali PNPM Mandiri. 2014. PNPM Mandiri Information Kit 2014. Jakarta, Indonesia: PNPM Support Facility.
Annex: Methodology
Figure 2: Global Income Inequality Reduction Effectiveness
In order to determine how effective PNPM Rural (or the NBF alternative) is at reducing inequality in income (or consumption), one must start with a counterfactual distribution of income (or consumption)
that excludes the benefits for which one wishes to calculate effectiveness metrics. For the calculations
in section A, the author began with a ‘market income’ distribution for rural Indonesians in 2012; this is the same market income series used by the World Bank (forthcoming), determined in the household socioeconomic survey (Susenas). However, as Susenas records the value of consumption expenditures but not all incomes used to make such expenditures, this market income distribution is actually closer to a ‘disposable income net of taxes and transfers’ distribution.
In order to calculate PR’s impact on income inequality, PR benefits—in this case only direct benefits
that take the form of wages or other payments for participation in infrastructure production—must be
allocated to all direct beneficiaries and then inequality statistics re-calculated on this new distribution (market income plus PR direct benefits). As mentioned in the main text, there is no identifying question in the Susenas household survey for direct PR beneficiaries—those individuals who receive wages or
wagelike payments for providing labour or materials to PNPM-procured infrastructure projects. So, the
author first calculated averages of the number of PNPM labourers paid wages annually, the number of
working days each labourer contributes annually, and the average transfer to a labourer annually, using publicly available PNPM Mandiri programme and administrative information (see Sekretariat Pokja Pengendali PNPM Mandiri 2012 or 2014). The author then allocated those average benefit amounts
to the average number of beneficiaries (by district) by choosing randomly from all rural individuals
captured in the Susenas household.
The other parameter the author used to allocate PR direct benefits came from publicly available information on the distribution of direct wage benefits from the public works component of the 2009 fiscal stimulus package. Within that public works programme, it was determined that 71.3 percent of the
short-term jobs created went to the bottom 50 percent of the population (ranked by income) while 28.7 percent went to the top 50 percent of the population (and virtually none of the jobs created went to the
top 10 percent of the population). For the analysis in section A, the author assumed for the PR benefit
incidence analysis that 70 percent of the infrastructure short-term jobs go to the bottom half of the market income distribution and the remaining 30 percent to the top half (excluding the top 10 percent).
After allocating PR direct benefits according to the algorithm and parameter described above, the author found that direct benefits from PR infrastructure reduced the nationwide and rural-only income
inequality by the following amounts:
Inequality Statistic
National (2012) Rural only (2012)
Market Income Market Income
plus PNPM
Market Income Market Income
plus PNPM
Gini 0.39 0.37 0.33 0.29
Theil 0.31 0.28 0.22 0.18
The ‘effectiveness’ rankings (e.g., as summarised in figure 2) for the other GoI expenditures were
calculated using the reduction in the ‘90/10’ inequality measure in World Bank (forthcoming). The ‘90/10’ statistic is simply the income share (or total income) of the group composing the 90th percentile of the income distribution divided by the income share (or total income) of the group composing the 10th percentile of the income distribution. Informally, it measures the economic resources owned by or the purchasing power of a rich individual relative to a poor individual.
The effectiveness indicators summarised by the blue bars in figure 1 give the ‘bang for the buck’;
GoI programme expenditures provide the denominator in the effectiveness index in World Bank (forthcoming). For PNPM Rural, average actual annual block grant amounts were calculated, subdistrict by subdistrict, from administrative data covering the period 2007 to 2011. So, because block grants amounts do vary somewhat based on population size (larger subdistricts receive larger grants) and poverty status (poorer subdistricts receive larger grants), calculating actual amounts received for each subdistrict means no subdistrict type is inadvertently down weighted in income inequality calculations. The total of the subdistrict block grants received constitutes PR’s budgeted expenditures for this exercise.
The effectiveness indicator for the NBF alternative is not an actual data point (whereas PR’s is). Rather, it is a simulated outcome under a scenario where line ministries and/or districts in one year produce (or procure the production of) the same amount of same-quality infrastructure located in the same areas that PR typically produces. The author assumed that, at a PR-level of infrastructure production, line ministry- and/or district-procured infrastructure would produce a similar reduction in global (across
Indonesia) income inequality. Therefore, the numerator in the effectiveness index summarised in figure
2 is of the same magnitude as PNPM Rural.
To determine the denominator—an estimated expenditure amount—for the simulated NBF alternative,
the author used the relative cost comparison from PSF (2013) together with the average annual profile
of PR-produced infrastructure as found in Sekretariat Pokja Pengendali PNPM Mandiri (2014) to generate an infrastructure-project-weighted relative cost (per unit of infrastructure). The PSF (2013) cost comparison data only includes a subset of PR projects (and line ministry and/or district-funded
equivalents); as a result, the weighted average cost (per unit) accounts for just more than four-fifths (83
percent) of PR’s average annual infrastructure production according to Sekretariat Pokja Pengendali
PNPM Mandiri (2014). Weighting the PR cost savings by this average annual profile generates a factor
of 1.78 for the NBF alternative. That is, line ministry- and/or district-led infrastructure is estimated to be 1.78 times more expensive (per unit of infrastructure) on average across projects built by PR in a
year. So the NBF’s expenditure amount—the denominator, indicated by the orange dots, in figure 2’s
effectiveness index—is equivalent to 1.78 times PR’s denominator.
Dividing an expenditure category’s reduction in the 90/10 inequality statistic by that same expenditure