Spectroscopy of Urban Vulnerability
Samuel Rufat
Department of Geography, University of Cergy-Pontoise, Paris, France
Despite the considerable work carried out in risk management, vulnerability indexes and aggregative assessments remain a serious issue. The main challenges facing vulnerability assessment are the collection, integration, and synthesis of large quantities of heterogeneous data to provide reliable estimations. This situation has led to the neglect of all significant interactions between the considered indicators, despite their being essential to vulnerability analysis. The scope of the article is to show that most obstacles to vulnerability assessment can be overcome by shifting the focus from absolute vulnerability assessment (i.e., the attempt to quantify an absolute level of weakness or resilience) to relative vulnerability assessment (i.e., the attempt to find out which populations and places are vulnerable and why). We propose a first attempt to assess relative vulnerability. The spectroscopy of urban vulnerability reveals the heterogeneity of vulnerability by focusing on the locally convergent specific characteristics and processes reinforcing (or reducing) vulnerability to inform the implementation of more targeted mitigation policies. This is a two-step approach, first focusing on the vulnerability underlying factors and establishing vulnerability profiles; the second step is to focus on their spatial distribution to confront each vulnerability profile to its multithreat exposure. The Lyon, France, and Bucharest, Romania, case studies reveal the risk transfers induced by some risk management policies and they highlight that vulnerability is a multidimensional phenomenon almost impossible to assess by using a single index. The two case studies also permit local multithreat comparisons as well as international comparisons.Key Words: Bucharest, Romania, GIS, hazards, Lyon, France, risk, vulnerability assessment.
A pesar del considerable trabajo llevado a cabo sobre manejo de riesgos, los ´ındices de vulnerabilidad y eval-uaciones agregadas siguen siendo asunto serio. Los principales retos que se enfrentan en la evaluaci´on de vul-nerabilidad son la recolecci´on, integraci´on y s´ıntesis de grandes cantidades de datos heterog´eneos para generar c´alculos confiables. Esta situaci´on ha llevado a que se desechen todas las interacciones significativas entre los indicadores considerados, a pesar de ser esenciales para el an´alisis de la vulnerabilidad. El ´ambito del art´ıculo busca mostrar que la mayor´ıa de los obst´aculos a la evaluaci´on de la vulnerabilidad pueden obviarse cambiando el foco de evaluaci´on absoluta de la vulnerabilidad (es decir, el intento de cuantificar un nivel absoluto de debilidad o resiliencia) a uno de evaluaci´on de la vulnerabilidad relativa (o sea, el intento de descubrir qu´e poblaciones y lugares son vulnerables, y por qu´e lo son). Formulamos una primera propuesta para evaluar la vulnerabilidad relativa. La espectroscopia de la vulnerabilidad urbana revela la heterogeneidad de vulnerabilidad al enfocarse en las caracter´ısticas y procesos espec´ıficos localmente convergentes que refuerzan (o reducen) la vulnerabilidad para informar la implementaci´on de pol´ıticas de mitigaci´on m´as definidas. Se trata de un enfoque de dos etapas, que primero se enfoca en los factores ocultos de la vulnerabilidad y en establecer perfiles de vulnerabilidad; la segunda etapa consiste en concentrarse en su distribuci´on espacial para confrontar cada perfil de vulnerabilidad con su exposici´on de amenaza m´ultiple. Los estudios de caso de Lyon, Francia y Bucarest, Rumania, revelan las transferencias de riesgo inducidos por algunas pol´ıticas de manejo de riesgos, a la vez que destacan que
Annals of the Association of American Geographers, 103(3) 2013, pp. 505–525C2013 by Association of American Geographers
Initial submission, May 2011; revised submissions, August 2011, January 2012; final acceptance, January 2012 Published by Taylor & Francis, LLC.
la vulnerabilidad es un fen´omeno multidimensional casi imposible de evaluar utilizando un solo ´ındice. Los dos estudios de caso permiten tambi´en hacer comparaciones locales de amenaza m´ultiple, lo mismo que com-paraciones internacionales.Palabras clave: Bucarest, Rumania, SIG, peligros, Lyon, Francia, riesgo, evaluaci´on de vulnerabilidad.
T
he 1990s were dedicated by the United Nationsas the International Decade for Natural Disas-ter Reduction, and this led to a large number of publications related to risks and their management and mitigation. The decade also saw vulnerability becoming a key concept (Cutter 2001), with megacities increas-ingly seeing this issue as a major challenge facing the twenty-first century (Mitchell 1999). During the last fif-teen years, much attention has been paid to a new defi-nition of concepts. More recently, an increasing number of projects have been developing vulnerability assess-ments and indexes from local to global scale, such as the Vulnerability-Resilience Indicator (Moss, Malone, and Brenkert 2002), the Predictive Indicators of Vul-nerability Index (Adger et al. 2004), the Social Vulner-ability Index (Cutter, Boruff, and Shirley 2003), and the Environmental Vulnerability Index (Kaly, Pratt, and Mitchell 2004). Despite all of these theoretical and methodological efforts, as well as the considerable work carried out to attempt to reduce disasters and losses, the problems continue to intensify and are accompanied by failures to forecast, reduce impacts, or even offer reliable tools to inform policy (White, Kates, and Bur-ton 2001; Cutter 2003; Birkmann 2006; Hartman and Squires 2006; Barnett, Lambert, and Fry 2008).
As Barnett, Lambert, and Fry (2008) have pointed out,vulnerability“is an imprecise term with intuitive res-onance, if no single definition” (103). The field has sig-nificantly evolved from its foundations in hazard stud-ies (Burton, Kates, and White 1978) and its following critiques for a lack of attention to structural condi-tions (Hewitt 1983). In earlier studies, vulnerability was strongly associated with the potential for loss and haz-ards exposure, implying that risk is of an external nature (United Nations Disaster Relief Organization 1982). Vulnerability studies have then explored the spatial and social distribution of losses to disclose the discriminat-ing sensitivity to disasters, reducdiscriminat-ing people to bediscriminat-ing passive recipients or even helpless victims (Mitchell, Devine, and Jagger 1989; Palm 1990). More recent vul-nerability studies have approached vulvul-nerability more as a societal response and not only as a biophysical con-dition. The two most prevalent frameworks can be seen as complementary (Eakin and Luers 2006). The pres-sure and release model examines who is vulnerable and
why by tracking the underlying drivers of vulnerability on the social, political, and economic pressures, the root processes constraining the ability of individuals to cope with disasters (Blaikie et al. 1994; Hewitt 1997; Wis-ner et al. 2004). The hazard of place model describes the place-based relationship between hazard exposure and the underlying socioeconomic processes and demo-graphic characteristics of the local population (Cutter 1996). Increasingly, even scholars from outside the field of social science acknowledge that disaster mitigation requires a better understanding of the differential im-pact of hazards as a product of the socially constructed vulnerabilities of specific groups (Neumayer et al. 2007; Morrow 2008). However, Mitchell has pointed out the disadvantage of these analytical approaches of vulnera-bility drivers (1999): they are interconnected and pro-vide thus an interactive context to disasters. As a result, Cutter, Boruff, and Shirley (2003) and Turner et al. (2003) have proposed a more integrative approach, fo-cusing on the place-based convergence of interacting vulnerability characteristics, such as poverty, unaware-ness, poor building resistance and multithreat exposure, and locating local vulnerabilities within the larger con-texts that influence processes often operating at broader scales.
We adopt the definition of vulnerability as “the char-acteristics of a person or group and their situation influ-encing their capacity to anticipate, cope with, resist and recover from the impact of a natural hazard” (Wisner et al. 2004, 11). Following the place-based approach, we focus on the interactions between the different di-mensions of vulnerability, their underlying drivers, and the feedback from hazards exposure and previous
dis-asters. Physical (or biophysical) vulnerability refers to
the degree of resistance of a building or a society to a dangerous phenomenon by deepening the sensitivity approach (Turner et al. 2003; Birkmann 2006; Eakin
and Luers 2006).Social vulnerability refers to the
inca-pacity of individuals to cope with crisis or change. For this reason, vulnerability is sometimes brought closer to the concept of resilience (Cutter 2006). The con-cepts of vulnerability and resilience are complex and their meanings are often contested, however. Although vulnerability is widely considered to be the opposite of resilience (Barnett, Lambert, and Fry 2008), for some,
resilience is part of vulnerability (Burton, Kates, and White 1978), whereas for others, it is defined as the adaptive capacity (Holland 1995) or in opposition to anticipation (Wildavsky 1988). The problem is that one can be vulnerable to an impact while being subse-quently resilient (Adger 2000). In a sense, this is be-cause a society is vulnerable in that it will suffer crises that it will have to face up to, adapt to, and learn from. Moreover, there is still no agreement about the proper-ties that enable resilience, so there are no robust mod-els on which indicators can be developed (Comfort, Boin, and Demchak 2010). Consequently, we stick to the concept of vulnerability that seems both broader and more robust to us. Finally, we are also considering the critical infrastructures (hospitals, schools, etc.) and networks (transport, supply networks, etc.) as indica-tors of the functional dimension of vulnerability: Their dysfunction or destruction worsens every crisis and im-pedes reconstruction (Quarantelli 2003; Kasperson and Kasperson 2005). These infrastructures and networks have a dual interest. On one hand, they represent a sig-nificant concentration of individuals, a factor that au-tomatically increases the number of people potentially exposed to hazards and complicates crisis management and evacuation procedures (Rodriguez and Quarantelli 2007). On the other hand, they also reveal the junc-tions that can spread the crisis in a reticular manner or cause a change in the scale of the crisis (from local to regional).
These various dimensions of vulnerability are inter-linked and denote the increasing complexity of pro-cesses associated with manifestations of vulnerability, at the interface of social and ecological systems. Vul-nerability assessments, however, are based on aggregate approaches that eliminate this complexity and these local interactions. They are “imperfect and do not re-flect the reality they seek to convey” (Barnett, Lambert, and Fry 2008, 107). This gap between the in-depth renewal of the conceptual instrument and the epis-temological challenges facing vulnerability assessment methods, comparisons, and mapping demands further exploration. The purpose of this article is to show that most obstacles to vulnerability assessment can be over-come by shifting the focus from absolute vulnerability assessment (i.e., the attempt to quantify an absolute level of weakness or resilience) to relative vulnerability assessment (i.e., the attempt to find out which popu-lations and places are vulnerable and why). We begin with a presentation of the methodological obstacles to vulnerability assessment and continue by proposing a first attempt to assess relative vulnerability. Finally, we
cover the different outcomes offered by a relative vul-nerability assessment with two European case studies in Lyon, France, and Bucharest, Romania. The first case study shows that relative vulnerability assessment leads to a shift in focus from the places most exposed to various hazards and sources of danger to the most vulnerable neighborhoods, and it also reveals the risk transfers induced by some risk management policies. The second case study demonstrates that vulnerability is a multidimensional phenomenon almost impossible to assess using a single index; it reveals a bipolarization of vulnerability that calls for differentiated mitigation measures.
Methodological Obstacles to Vulnerability
Assessment
The various dimensions of vulnerability require that a considerable amount of different types of data from a wide range of sources be taken into consideration. Consequently, the main challenges facing vulnerability assessment are the collection, integration, and handling of large quantities of heterogeneous data. The first dif-ficulty facing assessment methods lies in the challenge to reduce the complexity of interrelated characteristics and processes to a particular variable or set of variables, some of which are very difficult to quantify (Barnett, Lambert, and Fry 2008). Then, indexes are very sen-sitive to the selection of data able to reflect the com-plexity of multihazard exposure, the specificities of the weaknesses inherent in the exposed systems (high den-sity, obstruction of networks, etc.), and the social ca-pacities of adaptation and risk mitigation (Jones and Andrey 2007). Furthermore, these data might be dif-ficult to access, unreliable, or incomplete, especially in the case of international comparisons (Cardona 2005). Finally, assessment methods also encounter for-mal problems in the synthesizing of all these data and the ability to provide reliable comparisons (King 2001; Villa and McLeod 2002; Turner et al. 2003; Birkmann 2006; Barnett, Lambert, and Fry 2008; Schmidtlein et al. 2008; Tate, Cutter, and Berry 2010). Recent studies have presented three types of solu-tions for overcoming methodological obstacles. These are based on accounting, analytical, and synthetic approaches.
The accounting approach to vulnerability trans-lates all data into monetary terms and assesses fore-seeable damages in the event of a catastrophe (Flax, Jackson, and Stein 2002; Organization for Economic
Cooperation and Development (OECD) 2003; Linkov and Ramadan 2004). Its main field of application is in-surance, but it also results in confusion among vulnera-bility, hazard exposure, and the estimated consequences of a disaster (Gilles 2004). In addition, it generates a large number of problems when the phenomena occur-rence probability is unknown. Furthermore, it generates ethical problems when it concerns human loss of life, damage to infrastructures, and the destruction of a cul-tural heritage, given that they are all estimated using the same monetary unit (Rodriguez and Quarantelli 2007). The analytical approach relies on identifying and combining a set of “vulnerability underlying fac-tors” or “vulnerability interacting drivers” (Cutter, Mitchell, and Scott 2000; Cutter, Boruff, and Shirley 2003; Turner et al. 2003). It then proposes aggre-gate algorithms (Moss, Malone, and Brenkert 2002; Chakraborty, Montz, and Tobin 2005; Schmidt-Thom´e 2006; De Sherbinin, Schiller, and Pulsipher 2007) or matrix treatments (Mitchell 1999; Kaly, Pratt, and Mitchell 2004) that allow comparisons to be made through the publication of vulnerability indexes. The approach can suffer from the multiplication of het-erogeneous indicators and the defining of arbitrary thresholds, however. Vulnerability indicators are added together or multiplied in different ways by different au-thors without taking their diversity and interactions into account. The result is that vulnerability is measured in an arbitrary, subjective, and incomplete manner (Barnett, Lambert, and Fry 2008). Even when inter-actions are considered as a relevant process in the cre-ation and strengthening of vulnerability, the search for vulnerability metrics leads to the use of aggregate assess-ment models that eliminate interactions and the par-ticularities of local situations (Schmidtlein et al. 2008). The synthetic approach relies on systemic analysis to grasp, on one hand, the interacting root causes of vulnerability and, on the other hand, risk management policies (Kreimer 2003). It transforms the analysis of vulnerability into an “interpretation key” but it is con-demned to a posteriori analysis (Wisner et al. 2004; Pigeon 2005) given that it does not allow mapping or vulnerability assessment.
The handling and treatment of specific vulnerability databases is thus confronted with two main problems. On one hand, the different types of data and their var-ious sources have to be rendered compatible. These attempts to reduce heterogeneity have either led to a uniform monetary translation or to integration within a single arbitrarily determined indicator. This situation has led to the neglect of all significant interactions
be-tween the considered indicators, despite their being es-sential to vulnerability analysis. On the other hand, and although not exhaustive, the number of vulnerability proxies taken into account has increased considerably with the development of data storage and treatment capacities. To overcome methodological obstacles, we should cease looking for a measurement scale and try adding together all indicators and drivers that might be involved in the various crises and disasters. We still need an all-hazard approach and a vulnerability assess-ment method that provides both mapping and com-parison possibilities to inform the implementation of targeted mitigation policies.
From Absolute to Relative Vulnerability
Assessment
We propose overcoming these various obstacles in two steps: first, by changing the point of view from ab-solute to relative vulnerability and, second, by revealing the heterogeneity of vulnerability and focusing on the locally convergent specific characteristics and processes reinforcing (or mitigating) vulnerability rather than at-tempting to measure vulnerability by adding together all available data.
The expression “There is no zero risk” can be trans-posed to vulnerability: There is no such thing as an invulnerable place, person, or society. Consequently, vulnerability assessment is no longer an attempt to quantify an absolute level of weakness or the metrics of potential damage but rather an attempt to find out which populations and places are vulnerable and why within spaces exposed to various hazards and sources of danger. Geographers are convinced that place-based approaches deliver a more accurate vulnerability assess-ment than additive approaches (Cutter 1996; Turner et al. 2003; Barnett, Lambert, and Fry 2008). But the use of metrics and indexes to compare vulnerability from one place to another also leads place-based approaches to the homogenization of places and the elimination of the complexity associated with vulnerability.
Vulnerability indexes have been increasingly criti-cized because they are oversimplifying the complexity and interconnectedness nature of components that gen-erate vulnerability and because they fail to detect the heterogeneity of vulnerability. “There are many chal-lenges to simplifying and conveying the complex real-ity of vulnerabilreal-ity in the form of an index” (Barnett, Lambert, and Fry 2008, 106). To produce a single index, diverse kinds of data and multiple indicators typically
need to be standardized, scaled, scored through differ-ent thresholds, weighted, and aggregated. In addition to being inescapably subjective processes, a subjectiv-ity that decision makers might not always appreciate, they homogenize places for the purpose of comparison (Adger et al. 2004). Moreover, there is the challenge to reduce the complexity of an interaction within a sys-tem to a particular set of variables (Cutter and Finch 2008). These indexes are highly dependent on the ini-tial choice of their set of variables and they are subject to collinearity biases (Jones and Andrey 2007). In most studies, this usually results in a panel ranging from less than ten to more than fifty variables that are processed through aggregate models and weighting schemes. It is worth noting, however, that some of these variables might have an ambiguous role concerning vulnerabil-ity. It might thus seem misleading just to add them or to attribute to them a universal weight for every local situation on the terrain. For example, a high density of medical establishments and services is either prone to reinforce local vulnerability, if the facilities are de-stroyed or dysfunctioning, or to reduce local vulnera-bility, ensuring quick access to medical assistance for the local population. Likewise, density can be seen as a proxy of the reinforcement of local vulnerability due to the concentration of people, homes, and infrastructure at risk or as the indicator of a local reduction of vul-nerability because it is usually associated with the con-centration of the means of intervention and with the local capacity to effectively respond to and recover from an event. More broadly, aggregate models and weight-ing schemes suggest that vulnerability subcomponents might be substitutable in some way (Barnett, Lambert, and Fry 2008). The vulnerability of any given place is not necessarily the sum or the product of isolated and permutable characteristics and processes, however, and the vulnerability arising from poor building resistance or from special evacuation needs is clearly not the same. The assessment of vulnerability has thus to reveal, not bury, the particularities of local situations and focus on the convergence of different vulnerability charac-teristics in the same place and the interactions between vulnerability dimensions, and with multihazard expo-sure, to discuss whether or not they might converge to reinforce (or to reduce) local vulnerability. The rela-tive vulnerability analysis we propose is free from ag-gregation and avoids the temptation of adding together all available indicators. On the contrary, it underlines the heterogeneity of vulnerability. It is not enough to point out the most vulnerable places; this approach can guide risk reduction decision making by allowing
us to target mitigation measures precisely to the actual situation in each neighborhood, prioritizing structural mitigation in the most physically vulnerable places, re-ducing spatial inequities in the most socially vulnerable neighborhoods, and so on.
Method
We propose a first attempt to assess relative vulner-ability. The spectroscopy of urban vulnerability does not aim to measure absolute levels of vulnerability; it is rather revealing the heterogeneity of vulnerability by focusing the locally convergent specific characteristics and processes impacting vulnerability to inform the im-plementation of more targeted mitigation policies. This is a two-step approach, first focusing on the vulnera-bility underlying drivers and establishing vulneravulnera-bility profiles through a factor analysis (principal component analysis [PCA]) and a clustering method (hierarchical ascendeant classification [HAC]); and then the second step is to make use of geographic information systems (GIS) to focus on their spatial distribution and confront each vulnerability profile with its multithreat exposure. To answer risk management and mitigation decision-making needs, we are alternating a global and analytical view and using the level of smallest census tracts avail-able as the main analysis scale.
There is currently a tradition of research focused on the underlying drivers that increase or decrease the impacts of hazardous events on the local popula-tion (Blaikie et al. 1994; Cannon 1994; Cutter 1996; Wilches-Chaux 1998; Mileti 1999; Mitchell 1999; King 2001; Villa and McLeod 2002; Cutter, Boruff, and Shirley 2003; Kreimer 2003; OECD 2003; Rashed and Weeks 2003; Turner et al. 2003; Adger et al. 2004; Kaly, Pratt, and Mitchell 2004; Linkov and Ramadan 2004; Wisner et al. 2004; Cardona 2005; Birkmann 2006; Eakin and Luers 2006; Schmitt-Thom´e 2006; Jones and Andrey 2007; Morrow 2008; Comfort, Boin, and Demchak 2010). Concerning physical (or biophys-ical) vulnerability, the characteristics most often found in the literature include the resistance of the build-ings, informal housing, mobile homes, the absence of housing facilities, and the presence of hazardous cooking or heating installations. In social vulnerabil-ity analyses, some indicators appear repeatedly, mainly density, special needs populations, age, socioeconomic status, unemployment, and training. Other indicators are also used, such as critical infrastructures (hospi-tals) and networks (transportation), as well as facilities
concentrating people that might have special evacua-tion needs (schools, stadiums, malls, etc.). They can be seen as valuable proxies of functional vulnerability, as the dysfunction or destruction of these facilities wors-ens any crisis and hinders reconstruction. Selecting a couple of variables does not adequately capture local vulnerability, however. It is often the intersection of, for example, poor building resistance, lack of housing facilities, poverty, lack of training, and special evac-uation needs that impacts the local reinforcement of vulnerability.
We started our analysis with the indicators most in use in the literature, around fifty for each case study. Because of data collection and availability, we did not have precisely the same data set in both case studies. We reduced the number of variables to ensure statisti-cal power (one case study has only 150 spatial units), to avoid collinearity, and also to keep a balance among the three dimensions of vulnerability, by picking only around five variables for each dimension (physical, so-cial, and functional vulnerability). This reduction and balance of various types of indicators linked to people, housing, and facilities is attained by analyzing correla-tions within each one of these three types of indicators, with the variable reflecting the broader situation being selected as the most relevant proxy. Zero-order correla-tion matrixes were computed for each type of indicator in both case studies. The variables most linearly cor-related to the others and less corcor-related between them were selected as the better proxies of the local con-vergence of multiple underlying vulnerability factors. For example, long-term unemployment was positively correlated with poverty and lower socioeconomic status and negatively correlated with wealth and higher status; it was thus selected as the best proxy of socioeconomic polarization. Conversely, if too many variables were re-flecting residential segregation, this process could be overestimated in the vulnerability assessment. In the end, we used almost exactly the same set of variables, around five variables for each of the three vulnerability dimensions, except for the proportion of disabled per-sons, which was not available for Bucharest. The next step was to take into consideration the broader spa-tial and historical context to preserve local specificities, and it introduced two other slight differences. Apart from informal homes and deteriorated high-rise build-ings, the physical resistance of the urban fabric is pretty much the same in Lyon given the quite homogeneous housing conditions and building standards. Conversely, Bucharest’s exposure to earthquakes results in physical vulnerability being of particular concern; we thus chose
to use two more variables to evaluate it in this later case. Likewise, Bucharest is a capital city unlike Lyon, which makes functional vulnerability critical because it can easily spread the crisis from a local to a national level; as a result, we chose two more variables to as-sess it. These slight differences arise from the broader spatial and historical context, however, not from the method, which is concurrent with our focus on rela-tive vulnerability assessment. This does not flout the fact that our method does not rely on additive algo-rithms or on weighting schemes. Furthermore, because the data are not aggregated, scaled, or multiplied, our processing is less dependent on the choice of variables. The variables were selected to reflect broader situations and their adaptation to the context also helps to reveal the specificities of the construction of vulnerability in each neighborhood for both case studies. Besides, the aim is not to measure vulnerability levels but to under-stand the reasons why some places and populations are vulnerable and thus to inform mitigation policies.
Following our two-step approach, first focusing on vulnerability profiles and then confronting their spatial distribution to multihazard exposure, we are proposing a two-step method. First we focus on the local creation and reinforcement of vulnerability and establish vulner-ability profiles through a PCA and a HAC. Then, we make use of GIS to focus on the spatial distribution of each vulnerability profile and to compare them to vari-ous hazards and sources of danger. This releases us from the obstacles encountered in the search for thresholds, arising from the standardization, weighting, and aggre-gation of the various variables. It is possible to retain a balance among a limited number of indicators to ensure statistical power by focusing on their interactions. Dur-ing analysis, interactions, whether positive (e.g., social marginality and precarious housing) or negative (e.g., populations with special needs and medical coverage), become apparent. The spectroscopy of vulnerability starts with a PCA. Because PCA is sensitive to the val-ues of the input variables, the raw data are transformed into proportions, so that all variables have the same magnitude: The variables on people and housing are expressed in rates of population and households within each census tract, whereas the variables on infrastruc-tures and facilities are expressed in ratio of their capacity or attendance to the total value for the whole metropoli-tan area. The coordinates of all census tracts on the fac-torial axes are then being used as a distance matrix for the HAC, a nonspatial hierarchical divisive clustering according to Ward’s method, without any weighting. The resulting groups are compact, as homogeneous as
possible (low within variability), and as different as pos-sible one from the other (high between variability). At each stage, the groups’ inertia is used as the Ward level index of the node on the dendrogram. The optimal par-titioning of the dendrogram is determined without any strong a priori expectations. The larger thresholds in the histogram of level indexes allow us to find the right number of clusters. The choice of optimal partition-ing can be justified on statistical grounds by balancpartition-ing the number of defined groups with the proportion of explained inertia criterion. This combination of facto-rial analysis and clustering methods makes it possible to eliminate random fluctuations and to obtain more stable partitioning and compact groups.
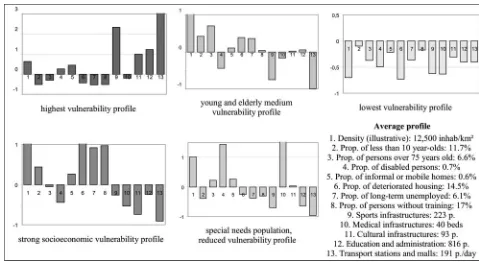
The results are the vulnerability profiles, which are presented graphically. We call spectra the graphs show-ing the deviation from average for all variables for each resulting group. We interpret those graphs as a sign of the vulnerability profiles emerging from the cluster-ing. These graphs reveal the main positive and neg-ative correlations within each group. On one hand, these graphs present the indicators connected within each profile and, on the other hand, which variables are overrepresented (considerably greater than the av-erage) or underrepresented (below the avav-erage). We therefore have a spectrum of each vulnerability profile to compare with the average situations in the urban area being studied. They are the basis for the understanding of the interactions mitigating or reinforcing vulnerabil-ity within each vulnerabilvulnerabil-ity profile. It is worth noting that it is the original raw data for each profile that are discussed and not a weighted combination, a scored index, or an aggregated index. Then, we make use of GIS to analyze the spatial distribution of these vulner-ability profiles and to confront them with multithreat exposure.
The use of GIS permits the geocoding of the infra-structures and facilities and the smoothing of hetero-geneous data into the smallest census tracts available level. For the more infrequent and less concentrated hazards (e.g., severe storms or nuclear power plant accidents) we assumed that the hazard zone encom-passed the entire metropolitan area in both case studies. On the other hand, spatially concentrated hazards re-quired the delineation of those areas potentially af-fected. In the absence of better data, we made use of the official hazard maps produced for risk management and planning purposes. We also assessed evidence of spatial clustering of the vulnerability profiles using the global
Moran’s I and Geary’s C statistics. Finally, we
mea-sured the spatial overlay of each vulnerability profile
with different hazards’ delineations to discuss their spa-tial distribution. This all-hazard integrative approach renders “the invisible visible,” reveals the specific local interactions impacting vulnerability to inform risk man-agement policies, and spatializes the strengthening or mitigation of vulnerability, thus allowing comparisons to be made.
Lyon: Shifting Focus from the Most
Exposed to the Most Vulnerable Areas
Lyon, located on the confluence of the Saˆone and Rhˆone rivers, is France’s second largest urban area with more than 1.2 million inhabitants. Since its Roman oc-cupation, the city center has been located between two hills and remained a major communications hub. In the twentieth century, textile manufacturing gave way to the chemical, pharmaceutical, and automobile indus-tries, which were structured around the port opening into the River Rhˆone (Bonneville 1997). Lyon is the second largest business and services center in France, as well as an important tourist destination (Authier et al. 2010). Historically, the city has been exposed to sev-eral recurrent hazards. The worst disasters to have taken place in the previous century were two landslides in the city center that occurred in 1930 and 1932 (killing seventy people and leaving more than 1,000 injured), the expanding vapor explosion at the Feyzin refinery in 1966, and the transport accident that took place in the river port in 1990, resulting in a fire that released a cloud of toxic chlorine gas. This urban area is now exposed to floods, landslides, industrial accidents, and hazardous materials transport, as well as to biological hazards re-sulting from the presence of a laboratory with a level four biosafety rating located near the city center and nuclear hazards due to the presence of three nuclear power plants at distances ranging from 30 to 50 km around the city. This complex exposure is at its highest along the River Rhˆone to the south of Lyon where al-most all hazards are present in the city’s chemical and pharmaceutical industrial hub (Rufat 2005).
The recent reinforcements to risk management ap-plied by French legislation following the passing of the “Bachelot law” in 2003 have resulted in approaches solely based on hazard exposure penalizing the popula-tion. The obligation to move facilities and public ser-vices away from the most exposed neighborhoods adds to the nuisances caused by the sources of danger and might result in the development having taken place until now in southern Lyon being limited in the future.
This has led to the incorporation of vulnerability analy-sis in the political arbitrations taking place to determine whether to move facilities to different locations, expro-priate inhabitants, or place hazardous materials and ac-tivities outside the city. The use of urban vulnerability spectroscopy results in the focus of risk management being shifted from the most exposed areas, overrated by legislation, to the most vulnerable areas.
Vulnerability assessments are conducted on the level of the census tracts for the seventy-two districts form-ing the greater Lyon urban area. This represents 528 spatial units. The first step is to identify the major ef-fects of disasters and accidents that could occur in Lyon. These can be subdivided into two categories: instanta-neous phenomenon that can damage infrastructure and injure people (e.g., landslides, overpressure, etc.) and slow-growing phenomenon requiring the evacuation or confinement of inhabitants in the exposed area (e.g., rising flood waters, spreading toxic cloud, etc.). Most of the vulnerability indicators (density, age, income, housing, etc.) are covered by the census, and for our purposes we have used the last full census available for Lyon (1999). We also implemented infrastructures and public services through a specific survey and constructed a specialized database with more than fifty vulnerability indicators covering the 528 Lyon census tracts.
We thus performed the reduction and balance of in-dicators through a zero-order correlations matrix. For example, the best indicator of socioeconomic polariza-tion in Lyon is the proporpolariza-tion of long-term unemployed people revealed by the 1999 census (Table 1). Thirteen indicators were taken into account, with six related to population (density, proportion of children, elderly, disabled, long-term unemployed, and people without training), two related to housing (proportion of infor-mal and mobile homes, deteriorated high-rise housing),
and five related to facilities and public services (grouped into five types according to times and levels of use: med-ical, sports, cultural, educational infrastructures and administration, transport stations and malls). Finally, using density as an explanatory variable leads to re-sults especially marked by a center–periphery gradient, thus deforming the vulnerability assessment. Con-versely, using density solely as an illustrative variable allowed underlying correlations to emerge. Due to its ambiguous role in increasing vulnerability and concen-trating the means of intervention, density is therefore only used as an illustrative variable.
The HAC of these twelve indicators, with density providing an illustrative variable, results in a clustering of the vulnerability profiles in Lyon (Figure 1). The op-timal partitioning explains 67 percent of the inertia and defines five groups within the census tracts1(Figure 2):
r Highest vulnerability profile (58 census tracts): This group reveals the connection between the concen-tration of most facilities and public services (from one to more than three times the average), a reduced mobility population (disabled and elderly), and a population living in informal or mobile homes. The positive interaction between these vulnerable infras-tructures and populations is increased by a lack of a proper medical coverage. Consequently, this class is defined as having the highest vulnerability profile. This profile picks out the most vulnerable parts of
the urban area and its dispersion (Moran’sI=–0.02;
Geary’s C = 1.16) also reflects the choice of
con-centrating facilities in a limited number of locations (Figure 3).
r Strong socioeconomic vulnerability profile (130 census
tracts):This group shows the connection between a young and more vulnerable population and most of
Table 1. Statistical correlations between socioeconomic indicators in Lyon (1999 census)
Management Professionals Technicians
Professionals 0.88 1
Technicians 0.32 0.59 1
Figure 1. Dendrogram of the clustering of vulnerability indicators in Lyon. (Color figure available online.)
Figure 2. Spectra of the five vulnerability profiles in Lyon.
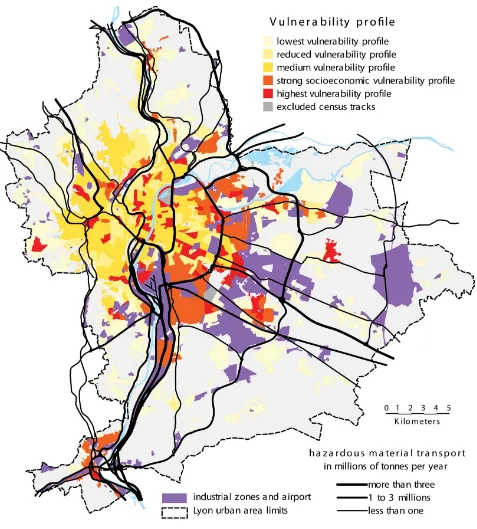
Figure 3. Spectroscopy of urban vulnerability and industrial hazards in Lyon. (Color figure available online.) the indicators used to reveal socioeconomic
vulnera-bility (informal housing, deteriorated high-rise hous-ing, long-term unemployment, and lack of training and education). This profile reveals a strong conver-gence of vulnerability drivers and the lack of
miti-gation feedback resulting from substandard facilities and public service coverage. The positive spatial
au-tocorrelation of this profile (I = 0.40; C = 0.52)
reveals the socioeconomic polarization of the ur-ban area, with a concentration of socially vulnerable
people and industrial zones in eastern and southern Lyon (Figure 3).
r Young and elderly medium vulnerability profile (157
cen-sus tracts): This group shows the same connection between a young population and socioeconomic vul-nerability indicators as it does with the elderly, but the local convergence is less concerning than in the previous profile because this group presents better facilities and public service coverage, even though it lacks public transport and commercial infrastruc-tures. As a result, this group is defined as the medium vulnerability profile. The positive spatial
autocorre-lation of this profile (I =0.38;C=0.64) reveals a
homogeneous group in the city center and in west-ern Lyon, being quite the opposite of the previous profile. This suggests that the spatial polarization of Lyon is also driven by age (Figure 3).
r Special needs populations, reduced vulnerability profile
(69 census tracts):This group reveals the local con-vergence of special needs populations and better medical coverage. This means that persons with re-duced mobility live in neighborhoods with greater medical facilities and staff. To a lesser degree, this is also the case of the elderly and those living in infor-mal or mobile homes. In this case, their special needs might well be taken into account. This strong nega-tive interaction is why this class is defined as having a reduced vulnerability profile. The dispersion of this
profile (I=0.08;C=0.97) reflects the distribution
of the medical infrastructure (Figure 3).
r Lowest vulnerability profile (100 census tracts): This last group brings together all census tracts with be-low average values for the youngest population and considerably lower averages for other variables, in-cluding that of density. The positive spatial
autocor-relation (I=0.45;C=0.52) reveals the clustering
of the lowest vulnerable areas in the urban fabric, which are mostly located on the outskirts as well as in the city center (Figure 3).
Finally, the fourteen census tracts with less than thirty houses (main residences) in the 1999 census were excluded from the analysis given their statistical irrelevance.
These results reveal the value of simply using density as an illustrative variable. Even though the lowest vul-nerability profile also has the lowest density in Lyon, all other profiles share approximately the same density. Furthermore, with the exception of this lower profile, the group with the lowest density has been defined as having the more concerning vulnerability profile. This
is due to the strong local convergence of connected vul-nerability indicators. It is worth noting that partially taking density out of the vulnerability assessment is the only way to highlight these connections and carry out an in-depth vulnerability analysis.
The use of GIS also permits measurement of the overlapping of the vulnerability profiles with the
haz-ard delineations, such as industrial hazhaz-ards2(Figure 3).
This overlapping provides a direct interpretation of risk at the conjunction of hazard and vulnerability. It reveals that only three of the most vulnerable clusters within the urban area are at risk: the city’s secondary Oulins and Givors centers, respectively to the west and the south, and Lyon’s main Gerland sports complex next to the river port. As can be seen, very few of the most con-cerning vulnerability profile areas (four census tracts, representing 9,000 persons) are exposed, and if a disas-ter were to damage part of the urban area’s infrastructure and facilities, their dispersion across the city would pro-vide a considerable level of resilience. In addition, most of the neighborhoods to be found in areas exposed to industrial hazards are of reduced or low-vulnerability profiles (twenty-one out of thirty-five census tracts, the whole population actually exposed being 115,000). This represents a further element that highlights the fact that the risk level in southern Lyon along the river Rhˆone is reduced, despite the recent focus of risk management in this area. In any case, the strongest socioeconomic vul-nerability profiles in southern Lyon are mainly exposed to a single risk scenario: the breaking or leaking of a pipe carrying chlorine across the river Saˆone. In this particular case, the decision required is easy, as it would simply require that the industrial process be relocated or that the pipe be placed underground.
The overlapping of the spectroscopy of vulnerability and the transport of hazardous materials through Lyon reveals that thirty-seven out of fifty-seven census tracts (90,000 persons) of the most concerning vulnerability profile are within 100 m from the routes used (Figure 4). Regulations concerning the transport of hazardous materials through Lyon only apply spatial and sched-ule restrictions on road transport despite the fact that hazardous materials are also transported through the city center by railway as well as by river. The main railway station in Lyon, located next to the central business district, is used by nuclear fuel and waste con-voys, as well as for the transport of highly explosive and toxic materials to chemical and pharmaceutical in-dustrial sites. This situation is far more worrying than the industrial hazards to be found in the southern ur-ban area. For example, an eighteen-ton chlorine tank
Figure 4. Spectroscopy of urban vulnerability and transport of hazardous materials through Lyon. (Color figure available online.) container on the city’s main line tracks could,
depend-ing on the duration of the leak and wind speed, generate lethal effects within a 750-m to 1,200-m perimeter (Ru-fat 2005). As more than 150,000 persons, 10 percent of Lyon’s urban population, live less than 100 m from
routes used for the transport of hazardous material, this type of scenario should be of considerable concern to Lyon’s risk management authorities. On the contrary, the Bachelot law has resulted in a strategy of prioritizing the reduction of hazardous materials stocks in industrial
facilities. This might produce an increase in hazardous material transport across the entire metropolitan area, partly because they are less regulated.
In the case of Lyon, it is worth noting that the spec-troscopy of urban vulnerability reveals that this recent mitigation policy is in fact inducing a risk transfer and, what is worse, toward the most vulnerable places of the metropolitan area. As can be seen, although most of the urban area is exposed to hazards (industrial and transport, as well as floods, landslides, etc.), only a small proportion is really vulnerable. Consequently, risk re-duction appears to be more essential in the most vul-nerable places than in the exposed areas. Subsequently, the spectroscopy of urban vulnerability leads to a shift in focus from exposed locations to the most vulnerable locations in Lyon’s urban fabric.
Bucharest: Revealing the Bipolarization of
Urban Vulnerability
Bucharest, the capital of Romania, has 2 million in-habitants and is located in the Danube plain near the Black Sea. This small, traditional city, formerly a staging post between northern and western Europe and Istan-bul, suffered two radical changes in the last century. First, its famous orchards and convents were destroyed at the end of the nineteenth century, when Bucharest became the country’s capital city, to make space for the construction of palaces and public buildings (Mache-don and Schoffman 1999). This was followed in the second half of the twentieth century by measures taken by the socialist regime to industrialize the city and dou-ble its population. The districts to the south of the city center were demolished to make way for the con-struction of collective housing and prestigious public buildings (Danta 1993). These radical changes to the city’s built environment were justified by recurrent dis-asters, mainly fires, floods, and earthquakes, the destruc-tive effects of which often provided pretexts for drastic modernization. The worst disasters over the last century were two major earthquakes that took place in Novem-ber 1940 and March 1977 (over 7.2 on the Richter scale) and the 1975 spring floods that resulted in the construction of a retention dam just outside the city. Currently, Bucharest is exposed to earthquakes, floods, industrial accidents, and the dangers of transporting hazardous materials as well as nuclear hazards resulting from the presence of a Chernobyl-like nuclear power plant on the Bulgarian side of the Danube just 200 km away from the city.
The vulnerability assessment was conducted on the level of the census tracts for the six districts forming the capital. This represents 151 spatial units. Like the Lyon case study, we constructed a specific database with around fifty vulnerability indicators, mostly from the last full census available for Bucharest (2002). We also made a collection of infrastructure and public services statistics and constructed a GIS. These amenities and services data were smoothed by the grid network used and the totals for each census tract were integrated with the GIS. Transport and supply networks (drink-ing water, drainage, electricity, gas) were taken into account through nodes (railway stations, stops, trans-formers, etc.) and the totals for each district were also integrated within the GIS. Finally, the area covered by the predictable effects of hazards (floods, earthquakes, industrial accidents) was also transferred to the GIS to be mapped.
Likewise, we performed the reduction and balance of indicators through a zero-order correlations matrix. For example, the proportion of houses without access to running water was chosen as the best indicator for the absence of all network supplies and housing facil-ities (Table 2). Unlike Lyon, the Romanian capital’s exposure to earthquakes results in physical vulnerabil-ity being of particular concern. In Bucharest, the most fragile buildings are those, on the one hand, built from wood and cob (Majuru 2003) and, on the other hand, those built before 1940 that suffered from the last two earthquakes (both registering over 7.2 on the Richter scale) and the basic structure of which has not sub-sequently been repaired or improved (Vossen 2004). Similarly, Bucharest is a capital city, so, unlike Lyon, this makes functional vulnerability critical because it can easily spread a crisis from a local to a national level, so we chose two more variables to assess it. Finally, sim-ilarly to the Lyon case study, density is only used as an illustrative variable.
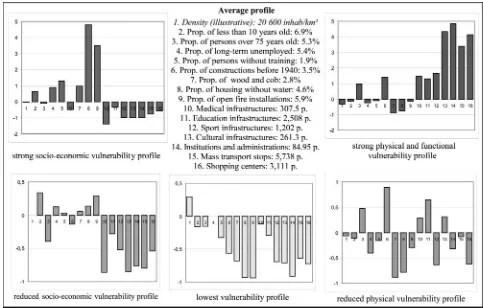
In the end, fifteen indicators (plus illustrative den-sity) were taken into account: five related to population (density, proportion of children, elderly, long-term un-employment, and people without training), four related to housing (wood and cob buildings and buildings built before 1940 and not consolidated, without access to running water, and using an open fire installation), and seven related to facilities and public services (grouped into types: medical, educational, sports, cultural, insti-tutions and administrations, public transport stations, and malls).
An HAC of these fifteen indicators (plus illustra-tive density) results in a clustering of the vulnerability
Table 2. Correlation between the housing supply and facilities indicators in Bucharest (2002) Lack of running
water Lack of sewerage
Lack of domestic
gas Lack of electricity Lack of WC
Open fire installation
Lack of running water 1
Lack of sewerage 0.99 1
Lack of domestic gas 0.87 0.87 1
Lack of electricity 0.62 0.61 0.67 1
Lack of lavatory 0.93 0.93 0.90 0.62 1
Open fire installation 0.88 0.88 0.91 0.62 0.94 1
profiles in Bucharest (Figure 5). The optimal partition-ing explains 68 percent of the inertia and reveals five
profiles within the census tracks3(Figure 6):
r Strong socioeconomic vulnerability profile (22 census
tracts):This group reveals the local convergence of the young and more vulnerable population, fragile
buildings constructed from wood and cob, and hous-ing with fewer connections and equipment. Socio-economic vulnerability is defined by the combina-tion of persons having not finished elementary school and those forming part of the long-term unemployed. In addition, these districts do not have the facil-ities or infrastructure cover that could limit the impacts of crises. These statistical correlations are
Figure 5. Dendrogram of the clustering of vulnerability indicators in Bucharest. (Color figure available online.)
Figure 6. Spectra of the five vulnerability profiles found in Bucharest. meaningful given that what we have is the overlap-ping of a vulnerable population living in fragile and poorly equipped housing that is not connected to supply networks. This situation increases the vulner-ability of the population to all types of crises. The spatial autocorrelation of this particular profile (I=
0.79;C=0.64) highlights the local convergence of
vulnerability in the outskirts of the capital (Figure 7). It matches the self-built neighborhoods that emerged at the same time as the socialist government’s indus-trialization program implemented from the 1950s to the 1970s (Mihailescu 2003).
r Reduced socioeconomic vulnerability profile (31 census
tracts): This group also translates the connection between the young population and economic vulner-ability factors. In this profile, however, the connec-tion is less obvious and these districts are equipped with educational infrastructures. This profile refers to neighborhoods where socioeconomic vulnerabil-ity is less worrying. It partly fits in with the
for-mer self-construction neighborhoods (I=0.20;C=
0.96) dating back to the period between the two World Wars where informal housing was partially
replaced by the socialist housing blocks of the 1960s (Figure 7).
r Lowest vulnerability profile (52 census tracts): This group gathers the districts in which all variables are substantially lower than average, with the exception of density, which is used as an illustrative variable.
The profile’s spatial concentration (I =0.24; C =
0.74) reveals that the large socialist government’s collective housing blocks, built on the outskirts of the city in the 1960s and 1970s on virgin sites that had formerly been fields and swamps (Mihailescu 2003), appear to be the least vulnerable neighborhoods (Fig-ure 7).
r Reduced physical vulnerability profile (22 census tracts): This group confirms the convergence of the older population and buildings damaged by earthquakes (built before 1940). This profile also reveals a con-nection between the older population and medi-cal, educational, and cultural infrastructures, how-ever. This can be seen, for instance, by the fact that medical coverage is a mitigating factor for the population living in these districts. This is why this group is defined as having a reduced physical
Figure 7. Spectroscopy of urban vulnerability and seismic wave amplification in Bucharest. (Color figure available online.) vulnerability profile. This profile is almost randomly
disseminated (I = 0.08; C = 0.70), as it is to be
found to the south of the city center, in areas where the socialist government’s radical demolition pro-grams were implemented during the 1980s (Danta 1993), as well as in the outskirts of the city center where the existing urban fabric had been partially re-placed by the socialist government’s collective
hous-ing and public buildhous-ings durhous-ing the 1960s and 1970s (Figure 7).
r Strong physical and functional vulnerability profile (22
census tracts): This group gathers the central cen-sus tracks, where the connection between the older population and buildings damaged by earthquakes is strongest, and which concentrates infrastructures, political institutions, administrations, facilities and
Figure 8. Spectroscopy of urban vulnerability and industrial hazards in Bucharest. (Color figure available online.) the main network intersections. This group thus
highlights the convergence of a strong functional vulnerability and the concentration of an older pop-ulation living in fragile buildings. The spatial auto-correlation of this profile (I=0.35;C=0.17) reveals a homogeneous group that runs from the downtown center to the northwest of the city (Figure 7). This
is the historical center of Bucharest, characterized by old single-family homes, mostly occupied by el-derly people who managed to “recover” their houses that had previously been nationalized by the socialist regime. These people often do not have the resources to maintain or reinforce their damaged buildings, however (Vossen 2004; Cin`a 2005).
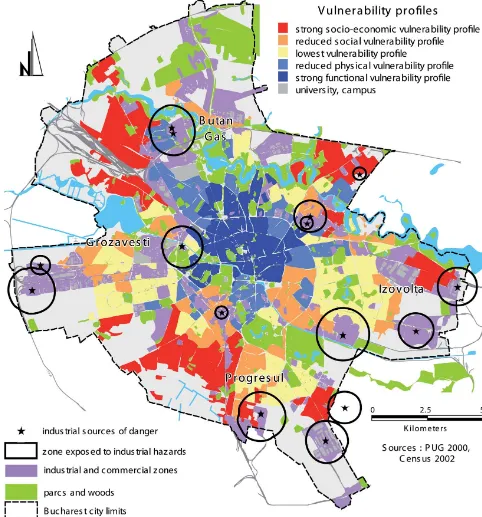
The two main university campuses in Bucharest (Grozaves¸ti and Agricultur˘a) are excluded from the analysis, as they represent extreme values insofar as a large number of indicators are concerned (Figure 7).
In the case of Bucharest, the value of using density only as an illustrative variable is even more obvious. It allows an in-depth vulnerability analysis that reveals a bipolarization of physical and functional vulnerability in the city center and socioeconomic vulnerability in the outskirts. As these various vulnerability dimensions result in dissimilar mitigation measures and priorities, their precise identification and spatialization is critical. In addition, the group with the highest density has also been defined as having the lowest vulnerability pro-file. This does not mean that these socialist collective housing neighborhoods are not vulnerable. It should not be forgotten that this spectroscopy of vulnerabil-ity is a relative assessment method and that, conse-quentially, less vulnerable areas might still be quite vulnerable. In reality, with the exception of medical and educational coverage, collective housing neighbor-hoods present below-average facilities and public ser-vices. Finally, this relationship between collective housing and mitigation remains surprising. The clue to this, rather than lying in the built environment that was designed to be earthquake resistant, probably lies in the imposed social and age mix. This suggests that the response to vulnerability is more a question of social and spatial cohesion alongside a reduction in dispari-ties, rather than a matter of resilience, being a feature that is not its perfect antonym.
Furthermore, the overlapping of vulnerability and hazards reveals specific interactions between this bipo-larization of vulnerability and the neighborhoods’
con-trasted exposure to the various hazards.4 For
exam-ple, eighteen out of the twenty-two census tracts with a strong physical vulnerability profile, which reveal the convergence of an older population and damaged buildings, are also located within the area of maxi-mum seismic wave amplification (Figure 7). This over-lapping represents 175,000 persons, or 9 percent of Bucharest’s total population. Institutions, infrastruc-tures, and strategic interconnections are also concen-trated in the same area. This interaction among hazards, urban dynamics, a vulnerable population, major infra-structures, and institutions clearly reveals how risk is constructed and vulnerability increased. In the case of an earthquake, these local interactions could result in consequences that could extend over the entire coun-try. This is a major challenge facing both Bucharest and Romania.
What is more, populations confined in self-construction neighborhoods, representing the strong social vulnerability profile, are also the closest to in-dustrial hazards sources (Figure 8). This vulnerability profile associates the presence of fireplaces in houses made from wood and cob with their poor resistance to fires and floods, hazards that are able to affect almost any profile. Apart from earthquakes, the most serious poten-tial risks are linked to accidents that might occur on the Butan Gaz platform to the north, the Izovolta chemical manufacturing factory to the east, and the Grozaves¸ti and Progresul crude oil power plants. Most industrial hazards could affect neighborhoods with a strong so-cioeconomic vulnerability profile and a large number of low-resistant buildings. The most worrying scenario, however, is that of the Grozaves¸ti power plant. An ac-cident at this plant, located in the area of maximum seismic wave amplification, would directly expose the presidential palace, the main campus, and a major com-mercial area, as well as the city’s most important medical center. An accident or an earthquake would cause major damage and disorganize national institutions while also destroying the key means of intervention and medical assistance. Bucharest is clearly a city at risk. In this case, the spectroscopy of urban vulnerability provides an un-derstanding of different local interactions that reinforce vulnerability and that could expand the consequences of a disaster from a local to a national level.
Conclusion
The spectroscopy of urban vulnerability meets the increasing need to have an all-hazards comparative vul-nerability assessment method (Cutter 2003). Drawing on previous results from the place-based approach, it focused on the local convergence of specific character-istics and processes reinforcing (or reducing) vulnera-bility to inform the implementation of more targeted mitigation policies. The results suggest that focusing on the complexity of relative vulnerability and local inter-actions rather than attempting to quantify an absolute level of weakness or resilience might be a way to over-come most methodological obstacles facing vulnerabil-ity assessment. The combination of factor and cluster analyses allowed us to minimize a priori expectations and underlying assumptions. Instead, it requires inter-pretations to emerge from the resulting graphs reveal-ing the specific vulnerability signature of the different groups that we have calledspectra of vulnerability. It also forces us to make explicit explanations of the complex
local interactions impacting risk and vulnerability. This method leads to a readable mapping while transferring the original complex data that have not undergone any transformations. It juxtaposes maps and the vulnerabil-ity spectra of the various profiles and then overlays them on hazard maps. The result is an intuitive and synthetic reading. The Lyon and Bucharest case studies reveal two very distinct historical and cultural backgrounds, the specificities of local situations in the face of the various hazards, and interactions among hazards, urban dynamics, and vulnerability. The two cities also permit local multithreat comparisons as well as international comparisons by shifting focus from vulnerability met-rics to the identification of specific local interrelated processes and characteristics impacting vulnerability.
This assessment method also calls for a number of comments, however. Although it answers mitigation and decision-making needs, the multiplication of in-formation makes the overlaid mapping a complicated task. Although the hazards have been analyzed one by one, climatic, biological, and nuclear hazards have not been taken into account. Besides, we made use of the official hazard exposure maps produced for risk man-agement and planning purposes. It is worth noting that all of these delineations are deterministic rather than probabilistic. They face the classical issue that drawing the lines defining the scope of potential disasters does not prevent disasters from occurring outside the area, though. Those hazard maps tend to be arbitrary, and making use of them often masks the negotiation pro-cess underlying their production and adoption. Never-theless, hazard zonation mapping is necessary for proper risk management policies, and those delineations are still the only available reliable data. In addition, this method is partially subject to arbitrary decisions in the delineation of the census tracts despite the fact that the clustering permits the identification of coherent groups that extend beyond grids. A smoothing algorithm would overcome these difficulties, but it would also eliminate the census tracts necessary to inform risk management policies. Another limitation lies in the decision to give the choice of abode (main residence) as the frame of ref-erence. If places of work had simultaneously been taken into consideration, this would have led to a proportion of the population being counted twice. Consequently, this method only indirectly examines the vulnerabil-ity of activities and networks. These are treated by the functional dimension of vulnerability but in connection with the place of residence. Finally, nonbuilt spaces are deemed to be uniform and their specific vulnerability is never taken into account.
The spectroscopy of urban vulnerability can still be improved, especially through the use of remote sensing aimed at extending the analysis to all types of spaces and agglomerations. In addition, improved accounts of activities, networks, and flows would be valuable. Once further developed, this method could be extended from urban to extraurban analysis and become a multi-scale vulnerability assessment method. More case stud-ies would be needed, however, to develop the method’s local and international comparison possibilities.
Acknowledgment
The author would like to thank the editor and the two reviewers for their helpful comments on earlier drafts of this article.
Notes
1. In the case of Lyon, the optimal partitioning defined five (67 percent of explained inertia), nine (71 percent), and eleven groups (75 percent). We selected the five defined groups partitioning as the following stages did not pow-erfully increase the amount of explained inertia. The fur-ther divisions tended to isolate very small clusters on the grounds of acute values for one single variable.
2. In the case of Lyon, in the absence of better data, we made use of the official hazard delineation approved by the local authorities in August 2004 in application of the European Seveso directive (2003/105/CE).
3. In the case of Bucharest, the optimal partitioning defined three (49 percent of explained inertia), five (68 percent), and nine groups (73 percent). We selected the five defined groups partitioning because the first partitioning only ex-plained a slight amount of the total inertia and the last partitioning did not supply a consequent increase of the amount of explained inertia.
4. In the case of Bucharest, we also made use of the offi-cial hazard maps produced for risk management and plan-ning purposes. We also used the industrial hazard zoplan-ning approved by the local authorities in September 2008 in application of the Seveso directive and the seismic wave amplification microzonation released by the Romanian National Institute for Earth Physics (INFP) in September 2006. It is worth noting that all of these delineations are deterministic rather than probabilistic.
References
Adger, W. 2000. Social and ecological resilience: Are they related?Progress in Human Geography24 (3): 347–64. Adger, W. N., N. Brooks, G. Bentham, M. Agnew, and
S. Eriksen. 2004.New indicators of vulnerability and adap-tive capacity.Norwich, UK: Tyndall Centre for Climate Change Research. http://www.tyndall.ac.uk/theme3/ final reports/it1 11.pdf (last accessed 1 May 2011).
Authier, J. Y., Y. Grafmeyer, I. Mallon, and M. Vogel. 2010.Sociologie de Lyon [Sociology of Lyon].Paris: La D´ecouverte.
Barnett, J., S. Lambert, and I. Fry. 2008. The hazards of in-dicators: Insights from the environmental vulnerability index.Annals of the Association of American Geographers 98 (1): 102–19.
Birkmann, J. 2006. Measuring vulnerability to natural haz-ards: Towards disaster resilient societies.New York: United Nations Publications.
Blaikie, P., T. Cannon, I. Davis, and B. Wisner. 1994.At risk: Natural hazards, people’s vulnerability and disasters. London and New York: Routledge.
Bonneville, M. 1997.Lyon—M´etropole r´egionale ou euro-cit´e? [Lyon—Regional metropolis or Euro-city?] Paris: An-thropos.
Burton, I., R. W. Kates, and G. F. White. 1978.The environ-ment as hazard.Oxford, UK: Oxford University Press. Cannon, T. 1994. Vulnerability analysis and the explanation
of natural disasters. InDisasters, development, and envi-ronment, ed. A. Varey, 13–30. Chichester, UK: Wiley. Cardona, O. D. 2005. Indicators of disaster risk and risk
management: Summary report.Washington, DC: Inter-American Development Bank.
Chakraborty, J., B. E. Montz, and G. A. Tobin. 2005. Pop-ulation evacuation: Assessing spatial variability in geo-physical risk and social vulnerability to natural hazards. Natural Hazards Review6 (1): 23–33.
Cin`a, G. 2005. Bucarest, dal villaggio alla metropoli: Iden-tit`a urbana e nuove tendenze [Bucharest, from village to metropolis: Urban identity and new trends].Milan, Italy: Unicopli.
Comfort, L., A. Boin, and C. Demchak, eds. 2010.Designing resilience: Preparing for extreme events. Pittsburgh, PA: University of Pittsburgh Press.
Cutter, S. 1996. Vulnerability to environmental hazards. Progress in Human Geography24 (4): 529–39.
———, ed. 2001.American hazardscapes: The regionalization of hazards and disasters.Washington, DC: Joseph Henry Press.
———. 2003. The vulnerability of science and the science of vulnerability. Annals of the Association of American Geographers93 (1): 1–12.
———, ed. 2006. Hazards, vulnerability and environmental justice.London: Earthscan.
Cutter, S., B. Boruff, and L. Shirley. 2003. Social vulnerability to environmental hazards.Social Science Quarterly84 (2): 242–61.
Cutter, S., J. T. Mitchell, and M. S. Scott. 2000. Revealing the vulnerability of people and places: A case study of Georgetown County.Annals of the Association of Ameri-can Geographers90 (4): 713–37.
Cutter, S. L., and C. Finch. 2008. Temporal and spatial changes in social vulnerability to natural hazards. Pro-ceedings of the National Academy of Sciences105:2301–06. Danta, D. 1993. Ceausescu’s Bucharest.The Geographical
Re-view83 (2): 170–82.
De Sherbinin, A., A. Schiller, and A. Pulsipher. 2007. The vulnerability of global cities to climate hazards. Environ-ment and Urbanization19 (1): 39–64.
Eakin, H., and A. Luers. 2006. Assessing the vulnerability of social-environmental systems.Annual Review of Envi-ronment and Resources31:365–94.
Flax, L. K., R. W. Jackson, and D. N. Stein. 2002. Commu-nity vulnerability assessment tool methodology.Natural Hazards Review3 (4): 163–76.
Gilles, A. 2004. Cartographie du risque naturel dans le monde. Etude comparative entre une approche d’ordre social et une approche d’ordre ´economique de la vuln´erabilit´e. Cybergeo: European Journal of Geography 286. http://www.cybergeo.eu/index2614.html (last ac-cessed 1 May 2011).
Hartman, C., and G. D. Squires, eds. 2006.There is no such thing as a natural disaster: Race, class, and Hurricane Kat-rina.London and New York: Routledge.
Hewitt, K. 1983.Interpretations of calamity from the viewpoint of human ecology.Boston: Allen & Unwin.
———. 1997. Regions of risk: A geographical introduction to disasters.Essex, UK: Longman.
Holland, J. 1995. Hidden order: How adaptation builds com-plexity. New York: Helix Books.
Jones, B., and J. Andrey. 2007. Vulnerability index con-struction: Methodological choices and their influence on identifying vulnerable neighborhoods. International Journal of Emergency Management4 (2): 269–95. Kaly, U. L., C. R. Pratt, and J. Mitchell. 2004.The
demon-stration Environmental Vulnerability Index (EVI) 2004. UNEP-SOPAC, Technical Report 384, Suva, Fiji Is-lands.
Kasperson, J., and R. Kasperson, eds. 2005.Social contours of risk: Vol. II.London: Earthscan.
King, D. 2001. Uses and limitations of socio-economic in-dicators of community vulnerability to natural hazards: Data and disasters in Northern Australia.Natural Haz-ards24:147–56.
Kreimer, A., ed. 2003.Building safer cities: The future of disaster risk.Washington, DC: The World Bank.
Linkov, I., and A. B. Ramadan, eds. 2004.Comparative risk assessment and environmental decision making.Dordrecht, The Netherlands: Kluwer—NATO Scientific Affairs Division.
Machedon, L., and E. Schoffman. 1999. Romanian mod-ernism: The architecture of Bucharest 1920–1940. Cam-bridge, MA: The MIT Press.
Majuru, A. 2003.Bucures¸tii mahalelor, sau periferia ca mod de existent¸˘a[Bucharest of mahala, or the periphery as a way of life].Bucharest, Romania: Compania.
Mihailescu, V. 2003.Bucures¸ti: Evolut¸ia geografic˘a a unui oras¸ [Bucharest: Geographical evolution of a city].Bucharest, Romania: Paideia.
Mileti, D. S. 1999. Disasters by design. Washington, DC: Joseph Henry.
Mitchell, J. K., ed. 1999.Crucibles of hazard: Mega cities and disasters in transition.Tokyo: United Nations University Press.
Mitchell, J., N. Devine, and K. Jagger. 1989. Contex-tual model of natural hazards.The Geographical Review 79:391–409.
Morrow, B. H. 2008. Community resilience: A social justice perspective. The Community and Re-gional Resilience Initiative Research Report 4. http://www.resilientus.org/library/FINAL MORROW 9 -25-08 1223482348.pdf (last accessed 1 May 2011). Moss, R. H., E. L. Malone, and A. L. Brenkert. 2002.
Vul-nerability to climate change: A quantitative approach. Col-lege Park, MD: Joint Global Change Research Institute.