FUTURE PLANET STUDIES
–
INTERDISCIPLINAIRY PROJECT
Floods & Jakarta Urban Poor
An assessment of vulnerability and its indicators, towards adaptive development
for the urban poor in Jakarta Utara, according to the impact of future floods
Supervisor:
Jaap Rothuizen MSc
Expert:
Alison Gilbert
Date :
December 18, 2015
Word count:
12000
Source: CNN (2013)
1
Abstract
2
Table of Contents
Abstract ... 1
1. Introduction ... 4
2. Case Area: Jakarta Utara ... 6
2.1 Utara and the urban poor ... 6
2.2 Development for the urban poor ... 7
3. Research Design ... 9
3.1 Defining vulnerability ... 9
3.2 Approach ... 10
3.3 Interdisciplinarity ... 11
3.4 Scenario analysis ... 11
4. Understanding Vulnerability ... 13
4.1 Exposure ... 13
4.1.1 Climate change ... 13
4.1.2 Surface subsidence ... 13
4.2 Sensitivity ... 14
4.2.1 Human systems ... 14
4.2.2 Natural systems ... 14
4.3 Adaptive Capacity ... 15
4.3.1 Structural deficits ... 15
4.3.2 Risk management ... 15
4.3.3 Sustainable adaptation ... 16
5. Results – Indicators of Vulnerability ... 18
5.1 Human capital ... 18
5.2 Information & technology ... 18
5.3 Material resources & infrastructure ... 19
5.4 Organization & social capital ... 20
5.5 Political capital + Institutions and entitlements ... 20
5.6 Wealth & Financial Capital ... 21
5.7 Physical ... 21
5.8 Data presentation ... 21
6. Adaptive Development ... 24
7. Conclusion and Recommendations... 25
3
7.1.1 Exposure ... 25
7.1.2 Sensitivity ... 25
7.1.3 Adaptive Capacity ... 25
7.2 Recommendations ... 26
7.2.1 Community Platform ... 26
7.2.2 Early Warning Systems ... 27
8. Discussion ... 28
4
1. Introduction
Every year, Jakarta is faced with floods due to its geographical location (Brinkman & Hartman, 2008). Moreover, human induced processes of climate change and land subsidence put the city under increased threat. Especially poor communities that lack means to protect themselves against floods will be the most vulnerable. This research recognizes the opportunities this group can offer in order to decrease the impacts of future floods. In this introduction we explain the most important concepts of our research.
The metropolitan Jakarta is the capital city of Indonesia, located on the northern coast of Java Island in Southeast Asia. The entire urban conglomeration of Jakarta (Jakotabek) counts approximately 23 million inhabitants (World Bank, 2010). However, people living in Jakarta’s metropole face challenges that have physical as well as socio-economic origins. The fact that Jakarta is located within a deltaic plain together with the yearly heavy rainfall (which often exceeds river capacity), makes it naturally highly prone to flood events (Texier, 2008). Budiyono et al. (2015) even state that Jakarta is one of the sites that experiences the highest impacts from flooding in entire Asia. Illustratively, in 2007, Jakarta was hit by a flood that affected almost 60 percent of the urban area. Between 58 and 74 people died and at least 340.000 people had to leave their homes (Texier, 2008; Shepherd& Boll, 2015). Future floods will be unavoidable in the future due to the geographic location but there are different processes that increase the pressure exerted on the already fragile setting of Jakarta.
According to the analysis of Brinkman and Hartman (2008) the frequency and magnitude of flood events will most likely increase as a result of more extreme weather events and global warming induced sea-level rise. Nonetheless Brinkman & Hartman point to surface subsidence as the main factor for concerns, regarding future flood events. A combination of these physical processes will imply the surface of Jakarta to decline and the water levels to rise creating an alarming outlook for the city. Most impact of the above named processes will be found in the North of Jakarta where the sea is close, the rivers come together and surface subsidence is strongest (Simarmata, Sianturi, Yudono, 2013). This study therefore restricts itself to this region defined as most vulnerable, Jakarta Utara.
Another characteristic for Utara is the large share of squatter settlements (urban slums) in the area. These informal settlements are inhabited by the urban poor that lack the financial assets to compete in the housing market and therefore settle in informal areas. McCarthy (2003)points out that the number of urban poor is depended on one’s definition of poverty. In this project there will be referred to the urban poor as Jakarta Utara residents who live in urban slums, representing one of the poorest segments of society. As the group being most vulnerable the urban poor need to receive attention with the increasing likelihood of flood events. Defining vulnerability is the first step in addressing the problem. When talking about vulnerability in the case of Jakarta the following definition will be used based on the definition given by the IPCC (2007): “The degree to which the urban poor are susceptible to, and unable to cope with, the impacts of floods”.
5
6
2. Case Area: Jakarta Utara
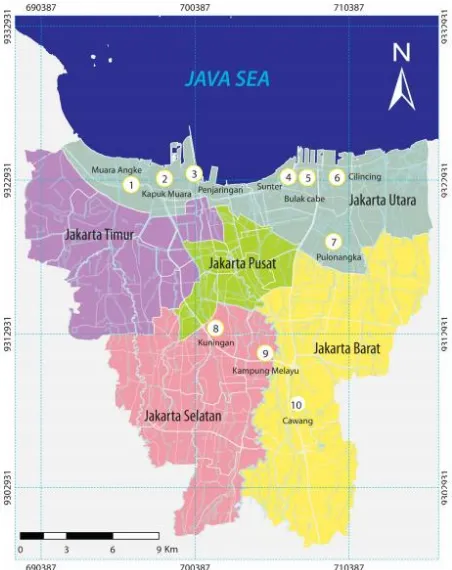
The capital city of Indonesia encompasses an area of approximately 654 square kilometers and is situated in the northern part of the Java Island. Jakarta has a total of six districts, figure 1, one of which is an island, Kepulauan Seribu that lies off the coast of Jakarta and is not included in the figure, derived from Marfai et al. (2015). The district in the northern part of the city is called Jakarta Utara (Marfai, Sekaranom & Ward, 2015).
Jakarta is considered to be one of the megacities of Southeast Asia, and even of the world, that is most vulnerable to consequences of climate change (Yusuf & Francisco, 2009). Due to Jakarta’s geographical location future floods can have two origins: river floods and flooding generated in the coastal area. The latter caused generally by high tides (Marfai,Sekaranom & Ward, 2015). Currently, frequent water loggings are almost solely the result of river floods. Nine rivers in the dense river network in Jakarta Utara alone have been characterized as major contributions to the river floods (Marchiavelli, 2008). Nonetheless, in the future Jakarta is likely to become more prone to both the river floods as
to those originated from sea (Budiyono et al., 2015; Marfai, Sekaranom & Ward, 2015).
In this research no distinction between these two types of flooding is being made since this would irrelevant and beyond our scope. The focus of this research includes the effect of a flood in general, in terms of vulnerability of the urban poor. However, this distinction must be recognized when structural protection measures are examined.
2.1 Utara and the urban poor
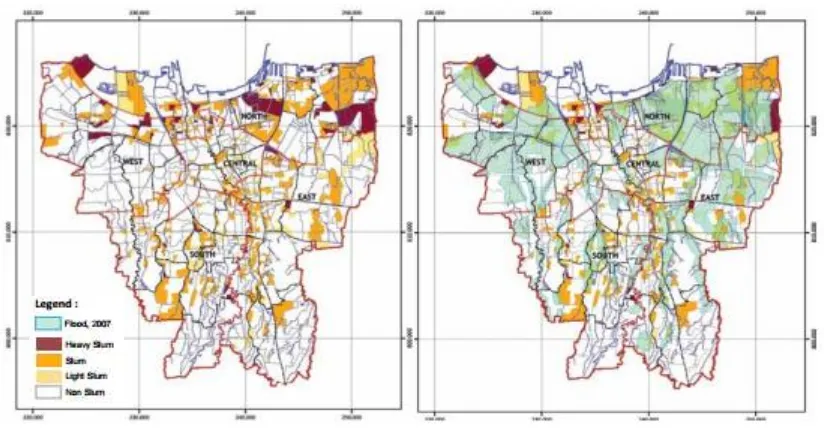
Padawangi (2012) states that impacts of climate change and land-subsidence are spatially unequal; some areas are more prone than others and the north coast of Jakarta is one of the more vulnerable to floods. According to Abidin (2013) land subsidence in the North is also most severe. This is also explicitly clarified by Marfai et al. (2015) and Marchiavelli (2008). Next to this, Padawangi (2012) indicates that even in the same region that is confronted with similar risks, the impact distribution of flood events can be unequal for different social groups. This is also the case for Jakarta Utara that is characterized by a relative high number in squatter settlements. Squatter settlements are often built on the coast and along waterways, areas no one prefers to live. As Schellekens (2015) point out that universal definitions of the urban poor lack but that there is a consensus of the fact that they inhabit urban slums, locally referred to as ‘kampungs’. The map below, figure 1, gives an indication of the location of slum areas in Jakarta’s metropolitan area.
7
Urban slums are indicated and graded (from non-slum to heavy slum) on both of the maps. ‘The grade of slum is based upon a ranking system by the Bureau of Statistics measuring the number of houses unfit for habitation, the quality of water and sewer services, population density, the use of streams as toilets and water sources, and how marginal of a location it is found in’ (World Bank, 2010).
With respect to flood events the urban poor are physically vulnerable to injury and property loss, and economically vulnerable since their livelihoods are mostly dependent on these same areas (World Bank, 2011). Because of the lack of registration of the urban poor, giving exact numbers on the share of the urban poor in the total population is difficult; however population in slums areas ranges from 6% to 25% (Schellekens, 2015). The urban poor in Jakarta therefore make up a significant group of the population and are also ‘productive and integral members of the city’s economy’ (World Bank, 2011).
2.2 Development for the urban poor
Having recognized that the contribution of the urban poor is relevant makes them actors in the question of development. Although being the most vulnerable group in society the urban poor seem to be highly resourceful and adaptive with many action taking place at the individual or community level. Although the houses and livelihoods of the urban poor may be fragile, strong social networks and cultural identification of place run deep and are important elements of adaptive opportunities (World Bank, 2011). The definition of vulnerability might seem deterministic in the fact that there are no ways for the urban poor to improve their situation but by assessing the different components of vulnerability it will be clarified that there are opportunities within the concept. Therefore, taking into account those opportunities for the urban poor to improve their situation is a crucial component in the future development for Jakarta, since it hasn’t received proper attention.
When studying the urban poor there are multiple challenges. One of the challenges is the lack of quantitative and qualitative data on these groups. According to the World Bank (2010) data gaps include: maps of poverty in the city, socio‐economic and housing data of the poorest, well-established qualitative definitions of slums and urban settlements, up‐to‐date census data (including the very poor) and immigration and emigration rates. Lack of data is a result of the informal character of the urban poor, their housing and occupations. Because there is often no registration on these areas it is difficult to make estimations or statements about size and development. Incorporating the urban poor can however be very beneficial for Jakarta’s overall development since they are highly adaptive (World Bank, 2011). The World Bank (2011) states that
8
9
3. Research Design
To answer our research question: ‘What are adequate indicators to identify vulnerability of the urban poor in Jakarta Utara and how can these contribute to adaptive development?’ we have developed a research design adequate to our study case. Since our research involves a case study, we first needed a comprehensive understanding of the case area: Jakarta Utara. This chapter includes an operationalization of the concepts of vulnerability and also adaptive development will be presented. Lastly, our approach to the case study will be presented.
3.1 Defining vulnerability
Measuring vulnerability is generally difficult and depends on what definition of the concept is used. As mentioned earlier this report will use the definition of IPCC (2001). The IPCC (2001) has noted vulnerability can be seen as a function of exposure, sensitivity and the adaptive capacity (abbreviated AC). What are considered relevant indicators for vulnerability also depends on the level to which the concepts are defined. In this research the study of Jakarta is limited to community level; the research focuses on the exposure, sensitivity and adaptive capacity of Utara’s urban poor as a whole. There will be factors mentioned that say something about vulnerability on individual or household level but those will not be discussed in depth; they will not be part of the recommendations. Figure 3 shows a model by Smith (2001) which is a conceptualization of the different attributes that make up vulnerability.
Figure 3 Smith, T. F., (2001). A framework for understand vulnerability. Climate Change Responses across Regional Australia: Social Learning and Adaptation. Victoria: VURRN Press.
The figure shows that the IPCC (2001; 2007) has grouped the influencing factors; exposure and sensitivity are considered the potential impact factors, AC interplays with those to result in an overall vulnerability. This grouping can be explained by the fact that exposure and sensitivity are regarded weaknesses in both the physical (exposure) and socio-economic (sensitivity) aspects of Jakarta Utara and might negatively influence vulnerability.
10
on the socio-economic status of the urban poor and points to development constraints. The other distinction being made in Smith’s model are the ‘past focus’ and the ‘emerging concerns’. In our research the focus will also be on adaptive measures that can promote stability among the urban poor in Utara. Because it is difficult to change the exposure, and less likely to radically correct the sensitivity, as it is mostly influenced by previous events, strengthening the community’s adaptive capacity is crucial to decrease Jakarta Utara’s vulnerability. Adaptive capacity is strongly connected with socio-economic developments and constraints which come forward in the sensitivity. In the case of Jakarta socio-economic problems are maybe as important to vulnerability as the physical risk. The relevance to group sensitivity and adaptive capacity can therefore be explained as the need to integrate socio-economic developments with adaptation measures. This new insight will be used as a framework for our recommendations for Jakarta Utara’s urban poor.
3.2 Approach
In order to find indicators that can measure the concepts of vulnerability, a literature study for the case of Jakarta has been carried out. Scientific papers were used to get an idea of the current understanding of the three concepts and what are considered relevant indicators. Since the study deals with the case of Jakarta (Utara) the focus has been on previous flood events in Jakarta, especially the 2002 and 2007 floods. Additional literature on the physical and social environment of Jakarta was used to analyze the business-as-usual scenario.
The obtained knowledge has been used to address the stages within a disaster situation, which has been crucial in order to give recommendations to improve the adaptive capacity. Literature from different disciplines was studied to create a broad understanding. Moreover, the three concepts compass many different disciplines, in order to apprehend the vulnerability level and the way in which it can be decreased an interdisciplinary approach was crucial. Furthermore, additional information derived from other case studies to complement the documentation concerning Jakarta Utara is used; this information is only used, when the other case was considered similar in a particular way and could generate new insights in the situation for Jakarta, for instance a case study about Bangladesh, which is broadly known for among others its land subsidence and high flood risk, which is very comparable to Jakarta Utara’s case.
Most of the data that has been collected from the papers is qualitative. As Walliman (2011, p. 72)states, qualitative data is rather described in words than in numbers, because it is difficult to accurately measure and count. This is definitely applicable to the concepts of exposure, sensitivity and adaptive capacity. Walliman (2011, p. 73)underlines that one should use the appropriate methods for analysis, because the data is often a combination of both qualitative and quantitative. Nonetheless, in the current case, the use of mainly qualitative data makes it possible to use data that has been collected from other cases because qualitative studies rather than quantitative studies can say something about the perceived experience of a flood (Walliman, 2011). Basing research on quantitative data only, would restrict the understanding of the way urban poor are vulnerable as well as adaptive. This is mainly the result of focusing on the damage that has been caused by the event, rather than appointing adaptive behavior which has led to decrease the actual impact of the flood in comparison with the potential impact.
11
subsidence and climate change cannot adequately be represented, whereas quantitative data is able to do this.
In order to overcome the complications that have been proposed by the uncertainty of data, a qualitative measurement of the sensitivity and the adaptive capacity has been conducted by a literature study. The literature has been used to extract the indicators of exposure, sensitivity & adaptive capacity. The results have been documented in a table, which has been included in the results. From the collected data from literature, recommendations will be developed, this can be considered the main aim of our project.
3.3 Interdisciplinarity
As can be concluded from the previous paragraphs our case study uses concepts that touch study areas from several disciplines. A complete understanding of vulnerability cannot be provided within the scope of a single discipline. An interdisciplinary approach is therefore required. The discipline of earth sciences will be used to focus mainly on the exposure of Jakarta Utara. This domain will determine the processes at play for the natural vulnerability but can also give insights in recommendations for land use practices. The discipline of human geography will give attention to the socio-economic characteristics of the urban poor in Jakarta and their integration in society. This will be a necessary attribute to determine sensitivity and deduct opportunities for the adaptive capacity of the community. The domain of business studies focuses on the importance to focus on the urban poor since they make up a large part of the Jakarta’s economy. Lastly, the study field of artificial intelligence is included to discover opportunities for improving early warning system and other forms of communication during disaster events. To fully understand the vulnerability for the case of Jakarta Utara a combination of the insight from the different disciplines is necessary. Common ground is needed to develop our recommendations. The integration of the disciplines will happen within the analysis and results of our research. These will be based on the following approach.
3.4 Scenario analysis
The analysis and results of our research will take the shape of a disaster analysis where vulnerability will be assessed in every stage of the crisis. Each stage in the process of a crisis will be observed with these qualitative measurements of exposure, sensitivity and AC. The stages that will be distinguished are: 1. ‘business as usual’; 2. pre-crisis; 3. crisis; 4. post-crisis and recovery and 5. ‘new stable state’.
These phases are based on previous assessments, whereby this has been stated in the under mentioned method of scenario analysis.
Kaewkitipong & Chen et al. (2012) distinguished three phases, where they also state the stages of pre-crisis (2), crisis (3) and post-crisis. They used these stages in their research on social media based communication during the 2011 flooding in Thailand.
Vorst (2010) described John Leach’s Dynamic Disaster model, in this model there are multiple phases possible, where Vorst (2010) uses either three or five phases. The theory of John Leach’s is a theory with its origin in the disaster psychology and acknowledged by Vorst (2010) for its useful implementation of the impact of human actions in crisis in disaster. This theory is also used as starting point by Barton (1969). Barton (1970) & Bardo (1978) differentiate different phases in order to a disaster.
The following will shortly discuss the outlines of the phases that will be used in this research.
1. Business as Usual
The phase before a threat of a flood has presented itself. During this period of time there is assumed that the community’s contingency is calm and would, to some extent, be durable if there are no crises that come to pass. Barton (1969) stated that formal organizations should employ in the preparation of potential disasters (Barton, 1969; Bardo, 1978).
12 2. Pre-crisis
Pre-crisis is comparable with the threat and warning stage described by Leach (1994), and the pre-disaster phase presented by Barton (Vorst, 2010; Barton, 1969). Leach (1994) states that in this stage recognizable signs will forecast a disaster and that evacuation could be a possibility (Vorst, 2010). Moreover, at the time of threat the action response begins (Barton, 1969).
The pre-crisis stage is important in understanding the adaptive capacity of multiple mechanisms within the community. Firstly, human reactions to the threat induce certain movements like migration or evacuation, as was the case in/as described by XXX (REF). Secondly one could also see multiple responses in terms of communication between the formal organizations or within the community (Kaewkitipong & Chen et al., 2012). Thirdly, monetary flows can show the response in a more detailed way (REF). Nonetheless, the interaction between the different aspects is expected to be most important in order to understand the vulnerabilities and AC.
3. Crisis
Once the disaster strikes, the crisis phase starts. The community will face the flood as it occurs. Barton (1969) mentions this as the immediate response phase, in which he underlines that the community or organizations should act instantaneously and might be challenged by the unexpected damages. Furthermore, the crisis phase is characterized by the inevitable evacuation that should emerge, but due to the high stress and emotional levels of the community it is difficult to mobilize the community, also caused by the enduring impact of the flood (Vorst, 2010). Kaewkitipong & Chen et al. (2012) have showed in their research that the crisis phase is also marked by self-regarding behavior, to assure an individual’s own safety and to survive the crisis phase.
The crisis phase is crucial in addressing the lack in AC and the sensitivity of Jakarta Utara. The way a flood affects the socio-economic processes in Jakarta Utara, will create a clear vision in which way the response of community could decrease the total effect of the flood to the community and this will highlight the most vulnerable and sensitive components in order to disasters.
4. Post-crisis and recovery
After the decrease of initial dangers, a more organized and structured phase will emerge: post-crisis and recovery. The community and the formal organizations will now focus on a more ordered response to the encountered situation (Kaewkitipong & Chen et al., 2012). After the evacuation of the most severely affected areas and providence of the first necessities of life, the focus mostly shifts towards the first recovery of the community and building up to achieve a new stable state. According to this, factories and shop will have to be restored in order to create possibilities for new employment and increasing possibilities to reach a new stable state.
5. ‘New stable state’
13
4. Understanding Vulnerability
In this chapter we will make an analysis of the literature we have found on indicators of vulnerability of the urban poor in Utara. We will do this according to the stage analysis approach that has been explained in the research design. The results of the stage analysis will be discussed in the Integrated Results. Logically we will start by studying the business as usual situation of Jakarta which sets the scene for the following stages. We will combine business as usual with the stage of pre-crisis since floods are yearly phenomena. Firstly exposure will be investigated, followed by sensitivity and lastly AC.
4.1 Exposure
The location of Jakarta is the biggest factor that determines its exposure to floods. As said earlier, Jakarta is located at a river delta of the Ciliwung River (Marfai, Sekaranom & Ward, 2015). This river spreads into a complex network of channels and tributaries, creating more areas that can be of high risk of flooding – and by this means, causing higher degree exposure. Floods occur when these rivers exceeds their maximum discharge capacity (Brinkman & Hartman, 2008). This occasionally happens during the wet-season, also called monsoon. The monsoons are typical for the tropical climate and this results in a dry-season that is during the months May - October and a wet-season in November till April (WMO). During the wet-season, extreme weather event that include high precipitation rates, are common. This means that during this events the catchment of the Ciliwung receives more precipitation which has to drain downstream the river towards the city of Jakarta. This causes discharge peaks of rivers in Jakarta which quite often exceeds the maximum discharge capacity of the river and causes floods (Brinkman & Hartman, 2008).
4.1.1 Climate change
Climate change is a topic that is discussed by authorities and considered to have a role in the increasing severity and the frequency of the occurrence of flooding events in the future. Probably the most prominent sources is the IPCC climate reports. Their last two synthesis reports (AR4, 2007 & AR5, 2014) states many future predictions of which two are particularly interesting future flooding events in Jakarta. One of the predictions is the suggestion that extreme weather events are more likely to occur a frequent base and may even become more extreme. As earlier stated, extreme weather events can causes maximum discharge peaks that exceeds the rivers boundaries. This means that the probability that Jakarta encounter more severe floods and more frequently will increase as climate change continues.
Since 40% of Jakarta lies below sea level, another process will play a part in the future floods. Sea level rise is one of the most known and discussed consequence of climate change. Due to the melting worlds snow and ice masses and thermal expansion of water as consequence of the rising temperature. The AR4 report predicts a possible sea level rise of 200-500mm on global average mean by 2100. In the future, this means that Jakarta becomes more prone to flood events coming from the Java Sea.
4.1.2 Surface subsidence
This risk increase is stimulated by surface subsidence of the land where Jakarta is built on (Brinkman & Hartman, 2008). A few location in Jakarta are having a subsidence rate of 20-25cm/year, however, the most common rates are between 1-14 cm/year (Abidin, 2006).
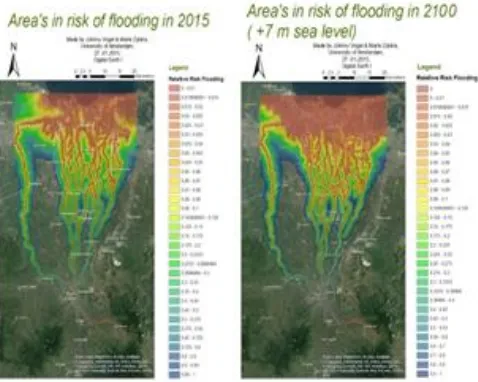
14 Assuming that rate of inclination remains
constant at rate of 7,5 cm/yr in the future, the net sea level rise can be 7 meters in 2100 (7,5cm/yr × 85 yr + 50 cm sea level rise = ± 700 cm). As can be seen in the figure 4 (Vogel & Zijlstra, 2015), a net elevation change of 7 meters results in a significant increase of areas that are at high risk of flooding. Especially Jakarta’s coastal area, Jakarta Utara, will become significantly more exposed to flood events. spring tides over a period of 100 years and found a cycle that correlated with a cycle that represents the distance from Earth to
the moon - which varies from time to time. This causes changes in moon's’ gravitational forces on Earth, that results into a changes in tidal patterns. He concluded that a cycle that repeats every 18.6 year. 2025 is the next year that this cycle will be at its peak, which may increase the risk of flooding.
Altogether, the conclusion can be drawn that Jakarta is highly very exposed to floods by its very nature. Additionally, human influences like urbanisation and unsustainable use of groundwater makes Jakarta contributes to the degree of exposed negatively. In the future, Jakarta is likely to become even more exposed to flooding events. Mainly, due to climate change, surface inclination and the ongoing urbanisation.
4.2 Sensitivity
Sensitivity is the combination of attributes, whether human or natural, that influence a system more or less susceptible to exposure and higher sensitivity will lead to higher potential impacts (Yoo, Kim & Hadi, 2014). The authors divided Jakarta into human and natural systems.
4.2.1 Human systems
For the human systems, in the article is population density considered as one of the most important aspects of sensitivity. According to Yoo, Kim & Hadi (2014) it is natural to assume that higher population density will lead to higher sensitivity to environmental exposure, taken into account that Jakarta is one of the most overcrowded cities in the world.
But not only population density itself is an import factor to predict the degree of damage, but different part of the total population are possibly more sensitive to the same (magnitude of) hazards. The number of slum population (BPS, 2008 in Yoo, Kim & Hadi, 2014) was used as a relative measure of the poor population.
4.2.2 Natural systems
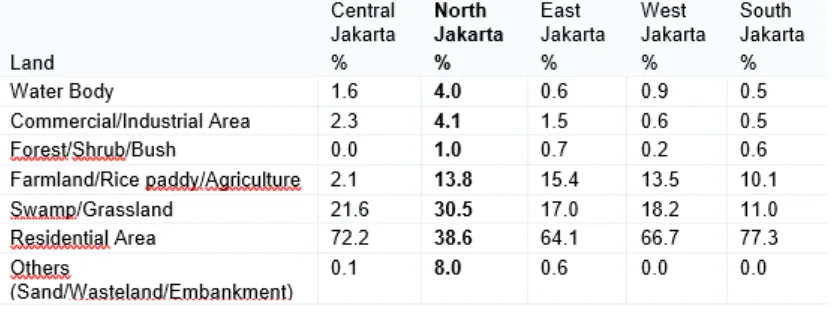
The natural systems were divided by Yoo, Kim & Hadi (2014) into managed and unmanaged natural systems based on a land cover map. The relative dividends of land cover by district are shown in Figure 5. Managed natural systems including farmland, rice paddies and agricultural field are assumed by the authors as more sensitive because vegetation and crop yield would be negatively influenced by environmental degradation. For the unmanaged natural system, swamp and grassland areas are assumed as sensitive land covers, while they have theoretically the capacity to act as a buffer against
15
environmental degradation. In this particular case, the unmanaged areas are too much negatively influenced by facets of the city of Jakarta.
Figure 5 Relative dividends of land cover by district (Yoo, Kim & Hadi, 2014)
4.3 Adaptive Capacity
Adaptive capacity’s (AC) share within the model of Smith (2001), discussed in the previous chapter, is the sort of positive feedback loop, to decrease the potential impact of a hazard. Lemos, Eakin, Nelson, Engle & John (2013) define adaptive capacity (AC) as ‘designing and implementing policy that both addresses structural deficits and risk management’. Lemos et al. (2013) discuss how a proper adaptation within both the generic as the specific AC may lead to adaptive development. We will therefore provide a short description of those two main factors. The indicators of AC for Jakarta Utara will be based on the definition of Lemos et al. (2007; 2013), this paragraph will explain the relation between the floods in Jakarta Utara and the AC in more detail.
4.3.1 Structural deficits
The generic adaptive capacity of is referred by structural deficits. Lemos et al. (2013) state this generic adaptive capacity as subjects like; universal access to education & health, income and land distribution, the political reform as democratic decision-making and transparency and the institutional and administrative capacity-building as investing in human capital and decreasing the inefficiencies of the political system. This generic adaptive capacity in Jakarta Utara is more about the role of the government of Indonesia and Jakarta, than the role of the community in Jakarta Utara; the macro-environment the inhabitants have to deal with.
4.3.2 Risk management
With risk management Lemos et al. (2013) imply the specific adaptive capacity such as investment in adaptation technology, social innovation and specific interventions to mitigate the exposure of different groups to particular climate threat as relocating vulnerable population according to recurrent and unmanageable floods as applicable for this particular case in Jakarta Utara. This specific interventions in order to risk management as stated by Lemos et al. (2013) could develop the adaptive capacity to a new state.
16
specific interventions, this development could in a broader sense influence the situation in Jakarta Utara.
An interesting additional insight to this specific and generic capacities (and the development of this capacities) is about the ‘corporate citizenship’ (Prahalad, 2012; Crane & Matten, 2005). In this research, the focus is on the community based and not on the macro-environment including the international businesses.
4.3.3 Sustainable adaptation
The paper of Lemos et al. (2013) includes a lot of historical background and appoints many factors of AC. Before they discuss the multiple indicators, which they also denoted as determinants in their previous paper of 2007 (Lemos et al., 2007) on a similar subject, the definition of AC is briefly set out. They appoint how AC influences not only the capability of the community to respond and protect themselves against the hazardous situations; but they also underline that it is challenging to enhance AC as this might threaten the existing relationships with the authority and the distribution of the resources (Lemos et al., 2013, p. 5). Whit other words, Lemos et al. (2013) state that by improving the AC, there is an increased risk that the power will shift towards the institutions that have the necessary resources, which will decrease the power of the communities. Thus, a “...successful adaptation should result in an equal or improved situation…” (Lemos et al., 2013, p. 4). As just discussed, if the responsibility for adaptive capacity is not equally distributed, the sensitivity of the community might increase because the segregation between the communities is enlarged. Therefore it is important to increase the AC in a sustainable manner, this will also be highlighted in the section on Adaptive Development.
An indicator which can appoint an unequally divided responsibility and involvement regarding the AC is not subject to a specific determinant. Consequently, a disproportional share by one or two of the determinants, compared to the influence of others, in enhancing the AC would be an indicator of unsustainable AC. Bearing in mind that the inhabitants of Jakarta Utara are predominantly urban poor and have limited financial resources (Schellekens, 2015), it can be expected that the majority of the AC precautions are provided by for instance the government. Moreover, this might indicate that the AC is not sustainable and adaptive, but would lead to short term solutions which do not alter the level of vulnerability on the long run. If the AC within a system is managed in a sustainable way this will increase the likelihood of the system to be resilient to face climate stress (Lemos et al., 2013; Yoo et al., 2014).
17
Table 1 Determinants of AC Source: Lemos et al., (2013); Eakin and Lemos (2006) (based on Smit et al., (2001) and Yohe & Tol (2002))
Determinant Encompasses
Human Capital Knowledge (scientific, “local”, technical, political), education levels, health, individual risk perception, labour
Information & Technology
Communication networks, freedom of expression, technology transfer and data exchange, innovation capacity, early warning systems, technological relevance
Material Resources & Infrastructure
Transport, water infrastructure, buildings, sanitation, energy supply and management, environmental quality
Organization & Social Capital
State-civil society relations, local coping networks, social mobilization, density of institutional relationships
Political Capital Modes of governance, leadership legitimacy, participation, decentralization, decision and management capacity, sovereignty
Wealth & Financial Capital
Income and wealth distribution, economic marginalization, accessibility and availability of financial instruments (e.g. insurance, credit), fiscal incentives for risk management
Institutions & Entitlements
18
5. Results
–
Indicators of Vulnerability
In this chapter the results of our literature research will be presented. The determinants that were appointed by Lemos et al. (2007; 2013) have been used as a guideline to structure the indicators of exposure, sensitivity and AC. Each of the determinants will be discussed by explaining the findings of our literature research. A table has been assembled to give a clear overview of all the indicators per phase, per determinant.
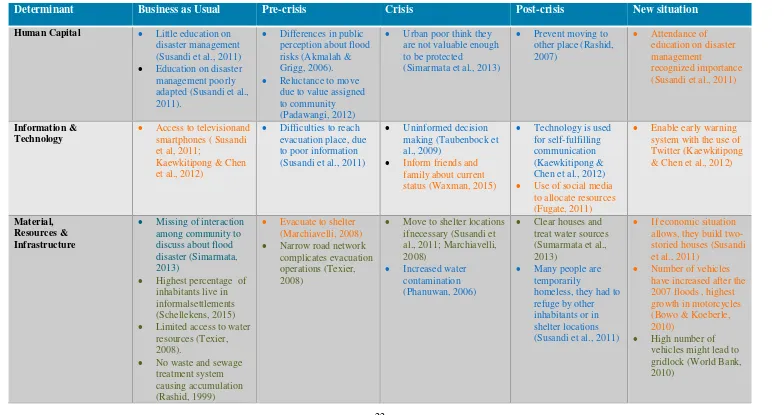
5.1 Human capital
As acknowledged by Susandi (2011) part of ‘human capital’ is growing after the flood event of 2007, but there are still little availability to workshops and education on disaster management in Jakarta Utara. The little education that is present is only poorly adapted to society. Due to a lack of knowledge of disaster management for some groups segregation between the inhabitants is created, based on education level and social-economic conditions.
Visitors of the disaster management classes, as stated by Susandi (2011) have recognized the importance of the disaster management, which brings them into a more prepared situation in case of a flood. This underlines the importance of the human capital in the adaptation to floods, but also shows that there is a lack of knowledge to understand the importance of flood protection for the urban poor.
For this reason there exists a differed public perception about the risks and consequences of a flood event (Akmalah & Grigg, 2006). As a result of this differed perception, Simarmata et al. (2013) describe a situation in which the urban poor are aware of their low possession of economic valuable goods, and therefore think that they are insignificant to be protected, by for instance, the government. However, by neglecting the protection need of the urban poor, as a result of their own inability to secure their goods and themselves, the less developed parts of the city will remain very vulnerable to be highly affected by floods (Simarmata et al, 2013; World Bank, 2011).
The idea that the urban poor are not valuable enough to protect is maintained by the low interest in the available information about floods (Susandi et al, 2011), but also because there is only so little knowledge that is provided by the government (Schellekens, 2015). This differed public perception might induce an even bigger difference between the social and economic classes, in order to the preparation to a flood. Since a higher human capital will increase the willingness of inhabitants to adapt, but also in relation to the social capital, which will increase the compliance to invest in a less vulnerable Jakarta (Wals, 2015).
Another important issue within flood management for the urban poor is that there is generally no adequate assessment of their human capital. For instance resettlement plans are often found problematic because it would move the community away from the place they value most. In a case study by Padawangi (2012) residents of a squatter settlement in Jakarta indicated that even if they were confronted with flood risks they would be reluctant to move. This is due to their strong ties with the place and the reliance on community networks. In a study on floods in Dhaka residents of squatter settlements indicated they preferred reduction of risk in their current living place instead of relocation (Rashid, 2007) In the case of Utara resettlement housing would move residents away from the fish market, where majority of them work. As one of the respondents in Padawangi’s research indicated:” They always came back to area and rebuild their homes because it was “the place that we knew. We are fishermen; fishing is the life that we know (Padawangi, 2012, p. 6).
In total, more than 50% of poor households in Muara Baru (east of Utara) depend on the fish marketplace, mostly for occupation (Padawangi, 2012). Costs due to loss of jobs are therefore significant and should not be overlooked (Schellekens, 2015).
5.2 Information & technology
19
community. Social media is often used in crisis situations as a means to indicate personal safety. Facebook has launched the ‘mark as safe button’ after the Nepal Earthquake in April of 2015 which enables a Facebook user to indicate whether they are in the affected area and to mark themselves as ‘safe’ (Waxman, 2015) . In the immediate aftermath of a flood, as Kaewkitipong & Chen et al. (2012) point out in their case study on the 2011 flood in Thailand, inhabitants of the affected area will primarily focus on their own safety and will act to fulfil their own needs, rather than to interact with the community to reassure those needs. The use of technology, such as social media but also satellite images, can also be helpful to locate resources that are needed to increase the recovery of inhabitants, keep the food and water supplies to a maximum and rebuild of the area (Fugate, 2011; Kaewkitipong & Chen et al, 2012).
Even though the information systems that have emerged appear to be applicable during a flood, Susandi et al, (2011) documented that many inhabitants have experienced difficulties in reaching the evacuation place. This can be the result of the many different warning messages that were given, from various sources, which led to uninformed decision making (Taubenbock et al, 2009). One may understand that the uncertainty of the information will increase if there does not exist a good warning system for hazardous events with high risks, such as a flood. If inhabitants can rely on the information that is given, they will be more prone to react.
5.3 Material resources & infrastructure
The inhabitants of Jakarta Utara have the opportunity to be evacuated to shelter locations (Susandi, 2011; Marchiavelli, 2008), but during the past flood events these opportunities are not taken advantage of when a flood presents is selves, and are only used at the last moment; while this sudden last moment evacuation has led to complicate the operation due the extreme bustle in the narrow road network (Texier, 2008). In addition, a rather paradoxical growth of motorized vehicles has been signalized in the informal communities (Bowo & Koeberle, 2010). Because after the flood event of 2007 the highest growth in motorcycles has been documented, especially in Jakarta Utara. Even though this might seem rather strange, as the evacuation operations of 2007 were problematic; however it could indicate that this growth in vehicles is an adaptive reaction, in order to evacuate quicker and more effectively. However the general conclusion that can be made is that the increasing number of vehicles on the streets of Jakarta is outpacing the development of new roads. The World Bank (2010) speaks its concern about a total gridlock of the city streets as early as 2016.
Due to the rapid urbanization multiple investments have not kept pace with the increasing demand of Jakarta’s population; including basic service deliveries like sewerage systems, clean water access, road construction and solid waste management. For example rivers and waterways have been sacrificed for economic growth and green areas have been converted to residential areas. These processes are putting pressure on the run-off of water in times of floods. In the meanwhile urban poor communities had to make place and therefore settled notably along polluted riverbanks and waterfronts that become dumpsites of wastes. Wastes in Jakarta’s waterways eventually accumulate in the north coast, where the rivers end (Padawangi, 2012). Strong pollution in the North persists because a city‐wide solid waste management plan for Jakarta is currently non-existent. Waste collection is largely done by private corporations, excluding the poor who are not able to afford this service (World Bank, 2010). The accumulated waste in combination with blocked drainage and sewage systems created a nightmare for health and environment (Rashid, 1999). Research has turned out that the microbial contamination level in floodwater is greater than in the streams of the Ciliwung River, which indicates a higher health risk during flood events, especially to the people who walk through, and children playing in, floodwater. In addition, due to the lack of access to clean water many people use the floodwaters for washing and other domestic purposes which increased the risk of infection to them. This definitely applies to the urban poor in Utara (Phanuwan, 2006).
20
inability of building something new. If their economic situation allows, they have built two-storied houses after the previous flood (Susandi et al. 2011) to increase the probability of surviving upcoming floods.
5.4 Organization & social capital
Susandi et al. (2011) states that the limited meetings among villagers and the low interest in the (formal) community organizations were part of the situation before the floods of 2007. There was low social coherence among the inhabitants and Susandi et al. (2011) reported that more than halve of the respondents was not able to find help when needed. In combination with the neglecting government, as earlier mentioned, this creates a complex situation in which there is low adaptive capacity to act as a whole to protect Jakarta and the inhabitants against floods (Taubenbock et al 2011). After the floods, however, there was more involvement in helping other members of community (Susandi et al., 2011), but this involvement was still very low. A strong social capital would be favourable as this induces the willingness to invest in a safer future for not just those individuals, but also the whole community (Wals, 2015). Therefore it would be advisable to improve the social capital and the understanding of the difficulties the inhabitants are facing to stand strong in the preparation and prevention of a flood (Wals, 2015; Schellekens, 2015).
One of the coping mechanisms after the previous floods was the ‘gotong royong’: clean up houses and surrounding together (Marchiavelli, 2008). In order to prevent and be prepared in case of an upcoming flood, the local community organisations have set up a text early warning system (Bowo & Koeberle, 2010). Both of these mechanisms appear to have a small scope, but will improve the overall adaptive capacity of the community and leave room for improvement to achieve adaptive development.
Lack of interaction among community to discuss about flood disaster can have negative influences on disaster relief (Susandi et al. 2011). In the research of Ahmed & Ahmed (1999) analysis of different slums in Dhaka was done. It appeared that the community responses differed within slums due to variations in the level of unity. Community mobilization appeared to be an important factor in the distribution of relief goods and services.
5.5 Political capital + Institutions and entitlements
The government provided temporary shelter locations in schools, mosques etc., during the flood and in the immediate aftermath of the floods. At the moment, the damage of the floods was known, the government provided shelter locations for a longer period of time, (Marchiavelli, 2008). Since the political capital neglects the need of the urban poor for protection against floods, the government is lacking in providing the necessities to prepare the weakest link in society (Schellekens, 2015; Wals, 2015). Surveys have shown inhabitants believe that the construction of a dyke or other defence mechanisms is not their responsibility, but a task of the government (Susandi et al, 2011; Pamunkas, 2012). However, this points back at the neglect of the government.
Moreover, the informal settlements that forms the biggest part of Jakarta Utara’s accommodations and the housing of the urban poor is not properly documented; there is a lack of official data regarding the number of inhabitants (Schellekens, 2015). Consequently this leads to the inability to estimate the number of resources that is needed and the lack of willingness to interfere with these unofficial residents of Jakarta (Taubenbock et al, 2011).
21
5.6 Wealth & Financial Capital
As stated before, the amount of well-constructed houses in Jakarta is very low. This is mainly because of the financial capital of the inhabitants in Jakarta Utara. (Bowo & Koeberle, 2010). In Jakarta Utara, the average income is very low, but there is a high number of working family members per household (Susandi at al., 2011). In this families, there is a high child rate among the urban poor, as more children are able to generate more income.
Because of the little financial capital of the inhabitants, they stay at home during flood events to prevent the loss of goods (Texier, 2008). If the economic resources allow the victims of the previous floods, they try to move to safer areas (Susandi et al., 2011).
5.7 Physical
In the case study of Marchiavelli (2008), there is shown that most of the inhabitants of the Eastern & Northern part of Jakarta throw their garbage in the river. This garbage decreases the flow of water by blocking and narrowing the waterways (Texier, 2008), and increases flood risks. For instance, the Angke River used to be 40-60 meters wide, but has shrink over the past years to 5-10 meters due to the dumping of garbage by the people that live alongside the river (Steinberg, 2007).
Due to the lack of economic resources and the ongoing urbanization, the very poorest will built their house on where there is space, with whatever resources they have. This results in very poorly constructed houses on the riverbanks, that are often built on ground where building houses is not allowed. These houses have no construction permit and are illegally built on state property, and very exposed to floods (UNESCO, 1999).
5.8 Data presentation
22
Table 2. Integrated results of the identified indicators of vulnerability. Green represents the exposure, blue the sensitivity and adaptive capacity is given the color orange.
Determinant Business as Usual Pre-crisis Crisis Post-crisis New situation
23
Determinant Business as Usual Pre-crisis Crisis Post-crisis New situation
Organisation &
24
6. Adaptive Development
Adaptive Development has been set out by Lemos et al. (2013). They address adaptive development as the mean to achieve adaptation to the hazard in a sustainable way. To induce a permanent decrease of the level of vulnerability a sustainable and long term adaptation is needed “to facilitate transitions and transformations—the long-term adaptation directed to more desirable states” (Lemos et al., 2015, p.5).Only with an integrated approach which involves all the actors and by acknowledging the synergy between them structural changes can be accomplished.
As Lemos et al. (2013) point out, adaptive development puts emphasis on the intersection of risk management and policies that aim at the decrease of sensitivity, such as enhancing economic growth, develop the human capital or increase the early warning systems. If the government only addresses the exposure, by building dykes or dredging the rivers, the overall level of vulnerability is not likely to drop. Since the adaptation to flood events within the community has not been altered, thus the same risk remains present. However, focusing on the sensitivity within the urban poor community alone may also not be the ultimate solution for structural changes in the adaptation of floods. Even though it is expected that the knowledge is increased by an intervention within the human capital and the coherence within the villages are enlarged; without precautions to diminish the impact of a flood to for instance the road network, an evacuation will not be able to succeed, which could cause the loss of goods and many innocent lives. The idea of adaptive development can help to take the complexity of the systems into account. To quote Lemos et al. (2013, p.10 ) “Adaptive development provides the social infrastructure that bridges individual actions to reduce personal vulnerability into a framework in which such actions contribute to collective capacity to manage risk.”
25
7. Conclusion and Recommendations
7.2 Conclusion
‘What are adequate indicators to identify vulnerability of the urban poor in Jakarta Utara, and how can these contribute to adaptive development?’
This research has aimed to firstly identify the indicators of vulnerability of the urban poor in Jakarta Utara and secondly to appoint the contribution or deficits of these indicators to achieve adaptive development. With the help of a literature study we have been able to identify many indicators that indicate the overall level of vulnerability of the urban poor. The level of vulnerability of Jakarta Utara is liable to the three components of vulnerability; exposure, sensitivity and adaptive capacity (AC) (Smith, 2001; IPCC, 2001).
7.1.1 Exposure
There appears to be a high contribution of exposure to the potential impact, this situation can be seen in all of Jakarta’s districts. This is, on the one hand, the result of Jakarta’s location, in the river delta of the Chiliwung River (Marfai et al., 2015). However, the city does not only face risk of flooding from the rivers but also ones that are generated in the coastal area, the latter is expected to increase over time (Brinkman & Hartman, 2008). Moreover, Jakarta is facing severe surface subsidence, with the fastest subsidence rate signalized in Jakarta Utara (Brinkman & Hartman, 2008). Furthermore, human influences like urbanization and unsustainable use of groundwater increase the exposure of Jakarta. In addition, climate change is expected to increase the sea level rise, which will put more stress on the coastal area, as the relative rise of the sea level will cause it to be significantly more exposed to flood events.
The indicators of exposure can predominantly be seen in the stages before a crisis, as these are mostly rather stable factors. However, the exposure indicators, such as the disposing of garbage in the rivers (Susandi et al., 2011), which often occurs in the informal settlements in Jakarta Utara, increase the already high flood risk. Other indicators that have been identified in the table regard the urbanization and the unsustainable use of resources. The latter are visible in all the stages of the disaster cycle, this indicates that there is a lack of knowledge on the impact of these actions.
7.1.2 Sensitivity
The lack of knowledge is also visible in the indicators of sensitivity. Sensitivity is the combination of attributes that influences a system to be susceptible to exposure and will increase the potential impact (Yoo, Kim & Hadi, 2014). The lack of knowledge, especially seen in the determinant ‘Human Capital’, will lead to higher sensitivity and environmental exposure. Urban poor communities, which make up most of the inhabitants of Jakarta Utara, are often more sensitive because the little financial resources (Bowo & Koeberle, 2010) result in a lack of education. The perception of a flood is affected by the level of education and the knowledge on disaster management. Since the urban poor often experience that they are not valuable enough to be protected, as they do not own many goods (Susandi et al, 2011), this indicates that there is little understanding about how the urban poor affect the overall level of vulnerability. The table in the integrated results shows that the resistance of the urban poor to evacuate, in order to protect the goods that are left, and the actions they undertake during a crisis situation, are increasing the sensitivity.
7.1.3 Adaptive Capacity
26
mechanisms will lead to a form of AC that is only effective to cope with the impacts of a flood on short term. However, to induce a permanent decrease of the level of vulnerability a sustainable and long term adaptation “to facilitate transitions and transformations—the long-term adaptation directed to more desirable states” (Lemos et al., 2015, p.5). The chapter on integrated results highlights how the current adaptive manners are mostly short-term adaptations. Moreover, the bigger AC indicators such as the availability of evacuation locations is provided by the government. This also indicates that the current level of AC is not equally divided, and should be improved in order to achieve a lower level of vulnerability. We think that this can be accomplished with adaptive development, a term that has also been used by Lemos et al. (2013).
The following paragraph sets out the recommendations that are created as a means to improve flood management in the case of a crisis. Ultimately the recommendations facilitate adaptive development. The indicators of vulnerability have shown that there is a lack of understanding between not only the individuals and the community, but also among the urban poor community and the government or stakeholders. Without a coherent plan of action and cooperation, investments to decrease the exposure or sensitivity will not be effective. New approaches have to acknowledge the negative synergy between exposure and sensitivity (Heltberg, Siegel et al., 2009). Moreover, a policy that denies the impact of, among others, the lack of education, political power, and financial resources on the vulnerability will not be able to induce development (Lemos et al., 2013).
7.2 Recommendations
As can be concluded from this report, the poor community in Jakarta Utara has a very complex socio-economic structure and is maybe even more complex in relation to Jakarta as a whole. This means that the development of the urban poor community towards a better organized and better prepared community is likely to become a slow and gradual process.
7.2.1 Community Platform
To address the set of indicators that make the urban poor so vulnerable we recommend the establishment of a local-based physical platform in Utara in which anyone can participate. The platform is a form for the community of Utara to participate. The platform we envisage will involve multiple actors but most importantly the inhabitants of the squatter settlements themselves. In this paper it is argued that an adequate understanding of the values of the urban poor is an essential part of development that is currently lacking. Building a bridge between the people in Utara and development planners will help to increase understanding of adaptation within development for both of them. In other words, the platform seeks to decrease physical exposure by potentially increasing the adaptive capacity of the urban poor to react more quickly to an incoming disaster.The logistics of the platform (including its precise locations, the amount of sessions and the duration of a session) will be left out of the discussion. We are rather pointing to the issues that need to be tackled and making suggestions how this should be done.
Core points of the platform will include:
Incorporating the interests of urban poor in current building projects and monitoring systems
Developing suitable evacuation plans that take into account the dependence of the community on the coast area.
Developing a waste-system by mobilizing the community and providing compensation
Improving communication in the pre-stage, crisis and aftermath of a flood by presenting developments in mobile devices and especially smartphones (Smith, 2009; Keim & Noji, 2011).
Strengthening community coherence
27
&Racthamp, 2012). Consequently, research shows that in the immediate aftermath of a natural hazard the use of social networking sites through cyber-physical devices increased predictably and has even surpassed the use of more conventional communication methods (Velev & Zlateva, 2012).The use of social media in those phases, pointed out by Kaewkitipong& Chen et al. (2012), can be linked to Giddens structuration theory (Kaewkitipong, Chen, & Racthamp, 2012).
7.2.2 Early Warning Systems
In order to create an early warning system that works properly and has the desired effect it is crucial to choose one platform that one can rely on and is familiar with (Taubenbock et al, 2012). Twitter is a popular social media platform and is commonly used in daily life. Jakarta even has one of the highest number of Twitter users in the world (Sysomos, 2010). Hossman et al. (2011) argue that extending Twitter with a special ‘disaster mode’, Twimlight, which one can easily activate during extreme events, will enable so called opportunistic communication. By using a platform that the inhabitants of Jakarta Utara are already familiar with will increase the genesis of Giddens communication dimension. Moreover Twitter is by default open and public, via a search tag that a user can add to their tweets, called hashtags (a keyword marked with a #), it is easy to keep track of the number of tagged events (Hossmann, Legendre, Carta, Gunningberg, & Rohner, 2011).
Another platform that is currently being used to monitor the events and proceedings of a flood is PetaJakarta.org. PetaJakarta.org is an online platform that uses twitter information to create a real time flood map (Holderness & Turpin, 2015). The platform has enabled inhabitants of flood prone areas to make decisions on safety and navigation, as they are aware of the current damages and can help others to response. Such a platform is extremely effective in achieving not only a higher adaptive capacity, but also adaptive development. Because the inhabitants are included in the process and will increase the social cohesion as well as the corporate responsibility (Holderness & Turpin, 2015). However, a platform as PetaJakarta.org which is very useful to get a better understanding of the events and Twimlight as a powerful communication method during the crisis, only works optimally and can than induce adaptive development, if the data is partially given by the government. But also used by the government to adapt to the events (Schellens, 2015). Without the cooperation of all the individual links in this system, an early warning system will not have the intended results and will only be useful for short term solutions.
Underlining Holderness & Turpin (2015) a firm recommendation to create a situation in which the community can communicate in a sustainable way and increase the social coherence to react on a flood event, the government should provide data on the number of inhabitants, the economic resources and other required data. Consequently the addition of this data can help predict the scope of a crisis, but most of all a well-funded preparation.
28
8. Discussion
This research has used a vulnerability approach to address the repeatedly occurring flood events in Jakarta, and more specific in Jakarta Utara. By identifying the indicators for exposure, sensitivity and adaptive capacity, the research has put emphasis on creating a more sustainable reaction to floods and thereby reducing the overall level of vulnerability. This aim is especially important with the expected increase in flood events due to climate change.
In the process of our research there have been many alterations to the overall endeavour and the research design. Since there is a lack of data on the urban poor in Jakarta, whom form the predominant inhabitants of Jakarta Utara, it has been difficult to find reliable statistics on for instance the money flows and the number of inhabitants. We have contacted Royal HaskoningDHV on 16th September, 2015, whom are currently creating a so called seawall to decrease the exposure for floods generated by the coastal area. They have confirmed this lack of data. This uncertainty proposed an unforeseen difficulty, as it was expected that the EBS could provide the needed data, which could be compared to severe floods in other countries. The latter to gain more insight in the indicators and how these expressed themselves in a slightly different environment.
To overcome the problems, we have altered the research design, focusing on qualitative data that has been derived from other case studies in the area. The way vulnerability has been addressed in the used literature has formed the basis for defining vulnerability. We have chosen the current approach because of its interdisciplinary character and the applicability with adaptive development. It is important to acknowledge there is extensive literature on the topic of vulnerability and the way in which one should define it. The model that was used, derived from Smith (2001, also used by IPCC) is a rather simple one, limiting the number of external events that can be appointed.
In the first phases of this research, we had different issues with defining abstract terms as vulnerability, adaptive capacity & adaptive development and zooming in to a subject, specific enough to conduct achievable research. An integrated approach of using all the different disciplines of the authors, has led to a situation whereby the (little) amount of time to write and the interests of the different authors played a significant role. In order to answer a question like our research question there must be a very consistent and clear framework to all of the authors, especially when conducting interdisciplinary research. If conducting an interdisciplinary research, framing of the research subject is a specific, careful, and time-consuming issue, but very important. With the different disciplines and an extremely various situation in Jakarta, there is more to cover than a single research can do. For this research, we should have done better when we earlier limited our research to create a more in-depth research.
This were the main reasons we did not achieve all our goals. In the beginning of the process, we would like to give a concrete advice for the Indonesian government and concretize the upcoming floods in every detail. Although, we are satisfied with the process and this final report.