P-ISSN.2503-0817, E-ISSN.2503-0825
CrossMark
Abstract
O
OObbbjjjectivvve: The purpose of this study is to know the toxicity of brown algae extract sargassum sp given orally to mice. The research performed is an experimental laboratory research type with experimental post-test-only control group design. The research samples used are females white mice (mus musculus).
M M
Maaateriaaal aaannnd MMMethods: The demand of seaweed in the world increases due to increasing use of seaweed for various purpose in the field of industry, food, textile, paper, paints, cosmetics, medical and pharmaceutical field. Alginate is commonly used in the field of dentistry as printed materials to create study models. Materials in the field of dentistry must be biocompatible to the oral cavity tissues. The materials should be stable, safe, comfortable and certainly nontoxic to the oral cavity tissues and other tissues in human body.
Treatment group 1 was given 500 mg/kg b.w. dose of sargassum sp, group 2 was given 1000 mg/Kg b.w. dose of sargassum sp, group 3 was given 1500 mg/Kg b.w. dose of sargassum sp, group 4 was given 2000 mg/Kg b.w. dose of sargassum sp and a control group was given only dose of Sodium carboxymethyl cellulose.
Resuuults: This study is a dose in humans that is converted into 2000 mg/Kg b.w. in mice, is a dose that does not cause the death of whole animals.
Connncluuusionnn:Based on the acute toxicity category, the extracts of sargassum sp obtained from Punaga Takalar Regency, South Sulawesi contains mild toxicity.
Keywords:Sargassum sp, Toxicity, Mice,Mus musculus
Cite this Article:Wariz R, Asfar NW, Fauzi A. 2016. The Toxicity of Brown Algae (Sargassum sp) Extract to Mice (Mus musculus). Journal of Dentomaxillofacial Science 1(2): 102-108. DOI:10.15562/jdmfs.v1i2.7
Introduction
The potential of Indonesia to develop and exploit its marine biological resources is expected to esca-late development rate and descend dependence on mainland. One of the marine biological resources is seaweed. The application of seaweed in Indonesia has extensively been
Developed, and has become one of income sources for Indonesians living in coastal areas, which has high potency of seaweed. Nevertheless, the seaweed application has not significantly increased in develop countries. It becomes very pathetic circumstance, considering that Indonesia is one of the countries that has the largest seaweed area in the world.1
Brown alga is one of seaweeds, which spread out in territorial waters of Indonesia. There are several genera of Brown algae. One of the brown algae gener-ally founded in South Sulawesi, Indonesia is the genus Sargassum sp. The seaweed is pretty much spread out in several areas in South Sulawesi. Although Sargassum spis not widelycultivated, it is still consumed by local community for industrial needs.2
Brown seaweed contains active compound with various bioactivities so that it has potencies to be developed as a nutraceutical materials. Its metabo-lite source such as carotenoids, laminaria, alginate,
fucoidan, mannitol and phlorotannin has economic value. Brown alga is better known as alginate and is a source of iodine. Pigment content in thali (Brown alga) is dominated by chlorophyll a, c, β-carotene, violaxanthin, and fucoxanthin.4
Alginate is one of common materials adminis-tered in the field of dentistry as printed material to create study model. A material administered in the field of dentistry obviously must have good biocom-patibility against oral cavity tissue and its surround-ings. Materials administered have to be stable, safe, pleasurable, and obviously not have toxic character, both the oral cavity tissue and surroundings as well as other tissues in human’s body.
Based on the research by Nursid et al.,4 on administering six kinds of brown seaweeds, such as: Sargassum ilicifolium (S. ilicifolium), Sargassum binderi(S. binderi),Turbinaria decur-rens(T. decurrens),Turbinaria ornata(T. ornata), Padina australis (P. australis), and Hormophysa triquetra (H. triquetra). The results of cytotoxic test conducted reveals that H. triquetra extract stands at the first rank in hampering the HeLa and T47D cells and T. decurrens stands at the second place. The highest fucoxanthin level is produced by H. triquetra extract, followed by T.
1,2Department of Prosthodontics,
Faculty of Dentistry, Hasanuddin University
3Departement of Oral and
Maxillofacial Surgery, Faculty of Dentistry, Hasanuddin University, Makassar, Indonesia
*Correspondence to: Rahmat Wariz,
Department of Prosthodontics, Faculty of Dentistry, Hasanuddin University
Received: 29 July 2016 Revised: 15 August 2016 Accepted: 17 August 2016 Available Online: 31 August 2016
The toxicity of brown algae (
Sargassum sp
)
extract to mice (
Mus musculus
)
decurrens and P. australis, whereas the fucoxan-thin level of S. Ilicifolium,T. ornata and S. binderi extract is relatively much low (<20 ppm). The fukosantin specifically works against particular tumor cell and obstructs their proliferation
through several mechanisms.4
Astawan et al.3
reveals that methanol extract
from brown seaweed (Sargassum echinocar
-pum) contains tannins, polyphenol, saponins, glycosides and steroids, classified as moder-ately toxic and safe for consuming at a dose of 1250 mg/kg b.w. On consuming the methanol extract of Sargassum echinocarpum at approx-imately ≥1250 mg/kg b.w. may obstruct the enhancement of mice weight. However, a dose up to 5000/kg b.w. does not induce death. The research conducted by Ayyad et al.5
analyzed four pure compounds reveals that fucoxanthin level in Sargassum sp has high potency as antioxidant and cytotoxic against breast cancer (MCF-7) with IC50=11.5 mg/ml. The fucoxanthin is naturally safe and it can be consumed as antioxidant and antitumor supplement.
The Sargassum polycystum extract positively contains alkaloid in extract using hexane solvent and steroid in methanol, ethyl acetate, and hexane. The results of toxicity test of Sargassum polycystum extract show that it has toxic effect against Artemia salina with chronic category at hour 24 hours of observation, in other words Sargassum polycystum extract tends to be toxic against living organisms.6
Material and Methods
The type of the research performed is laboratory experiment research, with post-test only with control group design of the research contrivance. This research was conducted in Phytochemicals and Biopharmaceuticals Laboratory, Faculty of Pharmacy, Hasanuddin University. The research samples are classified into five groups that consisted of five female mice for each treatment group.
The extraction method administered in this research is maceration method. This research was begun with the preparation of test animals. Before the animals were provided the treatment, they obtain acclimatization for 7 days to adapt with their circumstance and have to fast for 3–4 hours.
The observation of toxicity effect of brown seaweed extract Sargassum sp are performed by three means, i.e. physical symptom test, increase of respiration rate, descent of moving activities, diarrhea, urine and excessive saliva, test of daily weight change and observation of mice death.
Results
Based on the research conducted to observe the toxic effect of brown seaweed Sargassum sp against mice, we obtain the results and that can be referred to table 1.
Based on the test results suggested in table 1, the highest p-value is 0.09 in 1.000 mg/kg b.w. dose group that the value (0.9 or > 0.005) indicates that
Table 1 The result of activity test based on dose and time
Dose (mg/
Time (minute)
p-value
5 10 15 30 60 120 180 240
Mean ± SD mean±SD Mean ± SD Mean ± SD Mean ± SD Mean ± SD Mean ± SD Mean ± SD
Na-CMC 0.40 ± 0.54 0.60 ± 0.54 1.40 ± 1.51 2.40 ± 0.89 1.60 ± 1.14 1.60 ± 1.14 1.40 ± 0.89 1.20 ± 0.83 0.010
500 2.20 ± 0.83 1.00 ± 0.00 1.00 ± 0.00 0.40 ± 0.89 0.40 ± 0.89 1.00 ± 0.70 1.00 ± 1.22 0.80 ± 1.09 0.024
1.000 0.40 ± 0.54 0.20 ± 0.44 0.60 ± 1.34 1.60 ± 1.34 1.00 ± 0.70 0.20 ± 0.44 0.80 ± 0.44 0.00 ± 0.00 0.097
1.500 0.20 ± 0.44 0.40 ± 0.54 0.60 ± 0.54 0.60 ± 0.54 0.80 ± 044 1.80 ± 0.44 3.00 ± 0.00 3.00 ± 0.00 0.000
2.000 1.00 ± 0.00 0.40 ± 0.54 0.20 ± 0.44 0.00 ± 0.00 0.00 ± 0.00 0.00 ± 0.00 0.00 ± 0.00 0.00 ± 0.00 0.003
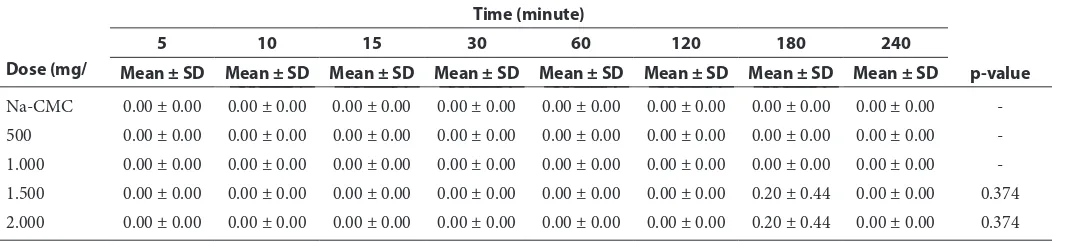
Table 2 The result of catalepsy test based on dose and time
Dose (mg/
Time (minute)
p-value
5 10 15 30 60 120 180 240
Mean ± SD Mean ± SD Mean ± SD Mean ± SD Mean ± SD Mean ± SD Mean ± SD Mean ± SD
Na-CMC 0.00 ± 0.00 0.00 ± 0.00 0.00 ± 0.00 0.00 ± 0.00 0.00 ± 0.00 0.00 ± 0.00 0.00 ± 0.00 0.00 ± 0.00
-500 0.00 ± 0.00 0.00 ± 0.00 0.00 ± 0.00 0.00 ± 0.00 0.00 ± 0.00 0.00 ± 0.00 0.00 ± 0.00 0.00 ± 0.00
-1.000 0.00 ± 0.00 0.00 ± 0.00 0.00 ± 0.00 0.00 ± 0.00 0.00 ± 0.00 0.00 ± 0.00 0.00 ± 0.00 0.00 ± 0.00
-1.500 0.00 ± 0.00 0.00 ± 0.00 0.00 ± 0.00 0.00 ± 0.00 0.00 ± 0.00 0.00 ± 0.00 0.20 ± 0.44 0.00 ± 0.00 0.374
there is no frequency differences of activation inci-dent in every minute of observation, meanwhile the lowest p-value is in 2000 mg/kg b.w. dose group. The significant data are shown in 1.500 mg/kg b.w. and 2000 mg/kg b.w. dose group with (p<0.005). The highest mean for activation test is in 1.500 mg/kg b.w. dose group at the 180 and 240 minute, whereas the lowest mean is 0.00 mostly in 2000 mg/kg b.w.
dose group at minute 30, 60, 120, 180 and 240 as well as in 1000 mg/kg BB dose group at 240 minute. In catalepsy test, the highest p-value is 0.375 in 1.000 mg/kg b.w. and 2.000 mg/kg b.w. dose group, meanwhile the lowest mean is p (-) or <0.005 in Na-CMC, 500 mg/kg BB, and 1.000 mg/kg b.w. dose group, indicating that there is no difference at all from the first until the last minute. Whereas the
Table 3 The result of urination test based on dose and time
Dose (mg/
Time (minute)
p- value
5 10 15 30 60 120 180 240
Mean ± SD Mean ± SD Mean ± SD Mean ± SD Mean ± SD Mean ± SD Mean ± SD Mean ± SD
Na-CMC 0.00 ± 0.00 0.20 ± 0.44 0.00 ± 0.00 0.40 ± 0.54 0.80 ± 0.83 2.00 ± 1.00 0.60 ± 0.54 0.00 ± 0.00 0.007
500 0.00 ± 0.00 0.20 ± 0.44 0.00 ± 0.00 0.60 ± 1.34 1.40 ± 0.54 0.80 ± 0.83 0.80 ± 0.83 0.80 ± 0.44 0.097
1.000 0.00 ± 0.00 0.00 ± 0.00 0.00 ± 0.00 0.40 ± 0.89 1.40 ± 0.89 2.20 ± 0.44 2.00 ± 0.83 0.80 ± 1.30 0.001
1.500 0.00 ± 0.00 0.40 ± 0.54 0.00 ± 0.00 0.20 ± 0.44 1.40 ± 1.51 2.80 ± 0.44 1.40 ± 1.34 1.40 ± 1.14 0.002
2.000 0.00 ± 0.00 0.40 ± 0.54 0.20 ± 0.44 1.40 ± 0.54 0.60 ± 1.34 3.00 ± 0.00 1.60 ± 0.89 0.20 ± 0.44 0.000
Table 4 The result of defecation test based on dose and time
Dose (mg/
Time (minute)
p- value
5 10 15 30 60 120 180 240
Mean ± SD Mean ± SD Mean ± SD Mean ± SD Mean ± SD Mean ± SD Mean ± SD Mean ± SD
Na-CMC : 0.20 ± 0.44 0.00 ± 0.00 0.20 ± 0.44 0.80 ± 1.09 0.80 ± 0.83 0.00 ± 0.00 0.60 ± 0.54 0.140
500 0.00 ± 0.00 0.20 ± 0.44 0.00 ± 0.00 0.60 ± 0.89 0.20 ± 0.44 1.40 ± 1.14 1.20 ± 0.83 0.80 ± 0.83 0.023
1.000 0.20 ± 0.44 0.00 ± 0.00 0.80 ± 1.30 1.40 ± 1.14 1.00 ± 1.00 1.00 ± 1.22 1.40 ± 0.54 0.80 ± 0.83 0.043
1.500 0.00 ± 0.00 0.40 ± 0.54 0.60 ± 0.89 0.80 ± 0.83 1.40 ± 0.54 1.20 ± 1.30 1.40 ± 0.54 0.80 ± 1.09 0.016
2.000 0.20 ± 0.44 0.60 ± 0.89 0.80 ± 1.30 1.20 ± 1.30 1.60 ± 1.14 1.60 ± 1.51 0.80 ± 0.44 0.00±0.00 0.199
Table 5 The result of salivation test based on dose and time
Dose (mg/
Time (minute)
p-value
5 10 15 30 60 120 180 240
mean ± SD mean ± SD mean ± SD mean ± SD mean ± SD mean ± SD mean ± SD mean ± SD
Na-CMC 0.00 ± 0.00 0.00 ± 0.00 0.00 ± 0.00 0.00 ± 0.00 0.00 ± 0.00 0.00 ± 0.00 0.00 ± 0.00 0.00 ± 0.00
-500 0.00 ± 0.00 0.00 ± 0.00 0.00 ± 0.00 0.40 ± 0.54 1.80 ± 1.30 1.60 ± 1.34 1.40 ± 1.14 0.80 ± 1.09 0.004
1.000 0.00 ± 0.00 0.00 ± 0.00 0.40 ± 0.54 0.40 ± 0.54 1.00 ± 1.22 1.20 ± 1.09 0.80 ± 0.83 0.00 ± 0.00 0.065
1.500 0.00 ± 0.00 0.00 ± 0.00 0.00 ± 0.00 0.00 ± 0.00 0.00 ± 0.00 0.00 ± 0.00 0.20 ± 0.44 0.00 ± 0.00 0.374
2.000 0.00 ± 0.00 0.40 ± 0.54 2.20 ± 0.83 0.60 ± 0.54 0.80 ± 0.83 2.00 ± 1.00 0.80 ± 0.83 0.40 ± 0.54 0.000
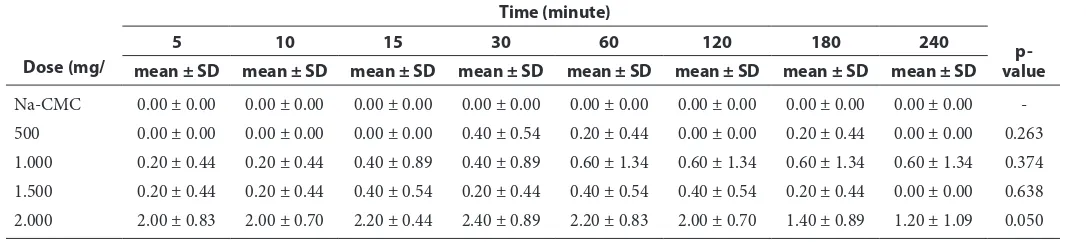
Table 6 The result of vascular test based on dose and time
Dose (mg/
Time (minute)
p- value
5 10 15 30 60 120 180 240
mean ± SD mean ± SD mean ± SD mean ± SD mean ± SD mean ± SD mean ± SD mean ± SD
Na-CMC 0.00 ± 0.00 0.00 ± 0.00 0.00 ± 0.00 0.00 ± 0.00 0.00 ± 0.00 0.00 ± 0.00 0.00 ± 0.00 0.00 ± 0.00
-500 0.00 ± 0.00 0.00 ± 0.00 0.00 ± 0.00 0.40 ± 0.54 0.20 ± 0.44 0.00 ± 0.00 0.20 ± 0.44 0.00 ± 0.00 0.263
1.000 0.20 ± 0.44 0.20 ± 0.44 0.40 ± 0.89 0.40 ± 0.89 0.60 ± 1.34 0.60 ± 1.34 0.60 ± 1.34 0.60 ± 1.34 0.374
1.500 0.20 ± 0.44 0.20 ± 0.44 0.40 ± 0.54 0.20 ± 0.44 0.40 ± 0.54 0.40 ± 0.54 0.20 ± 0.44 0.00 ± 0.00 0.638
highest mean is in Na-CMC and 2.000 mg/kg b.w. dose group at minute 180.
The highest p-value in 500 mg/kg b.w. dose group based on the data in table 3 is 0.09 or (ρ>0.005) and the p-value of Na-CMC dose group is 0.007 atau (ρ>0.005). Whereas, the lowest p-value is 0.000 in 2.000 mg/kg b.w. dose group. Meanwhile, the highest mean is 3.00 in 2.000 mg/kg b.w. dose group at the minute 120 and the lowest mean is 0.000 in every dose group at minute 5 and 15 except 2.000 mg/kg b.w. dose group and 1.000 mg/kg b.w. dose group at minute 10.
For the results of defecation test, the highest mean is 1.60 in 2.000 mg/kg b.w. dose groups at minute 60 and 120. Meanwhile the lowest mean is 0.00 in Na-CMC, 500 mg/kg b.w., and 1500 mg/ kg b.w. dose group. The highest p-value is 0.199 in 2.000 mg/kg b.w. dose group and the lowest p-value is 0.016 in 1.500 mg/kg b.w. dose groups.
In salivation test, the highest mean is 2.20 in 2.000 mg/kg BB dose group at minute 15 and the lowest mean is 0.00 in Na-CMC group. The highest p-value is 0.374 in 1.500 mg/kg b.w. dose group and the lowest p-value is (-) or <0.005 in Na-CMC group which means that there is no differences at all from the first until the last minute.
In vascular test, the highest mean is 2.40 in 2.000 mg/kg b.w. dose group at minute 30 and the lowest mean is 0.00 in Na-CMC group. The highest p-value is 0.638 in 1.500 mg/kg b.w. dose group and the lowest p-value is (-) in Na-CMC dose group, which means that there is no significant differences at all from minute 5 until 240. After performing toxicity examination by testing the six variables it was continued to scale the mice weight conducted for 7 days, starting from the first day after giving the Sargassum spextract until day 7. The table of mice weight observation may be monitored in the table 7.
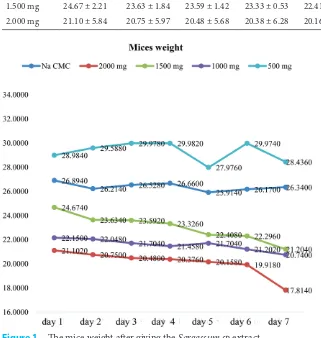
The lowest mean is (21.10), (20.75), (20.48), (20.38), (20.16), (19.92), and (17.81) successively suggested by 2.000 mg/kg b.w. dose group from the first until the seventh days.
Figure 1 reveals that the Na-CMC group in the first day does not encounter dominant weight difference counting from the first day (26.89) until the seventh day (26.34), however on day 5, the mice weight encounters a descent (25.91). In 500 mg/Kg b.w. dose group, the mice weight does not encounter modification of dominant weight descent. The mice weight runs into escalation and descends periodically, and at day 7, it runs into escalation again
(26.34).
From data analyzed in 500 mg/kg b.w. dose group, we obtain that mean is in 1.000 mg/kg b.w. dose group, the mice weight encounters descent from day 1 until day 4 (21.46), and encounters escalation again at day 5 (21.70). The difference is suggested by 1500mg/kg b.w. dose group, the mice weight gradually encounters descent from day 1 with mean value (24.67) until day 7 (21.20). It is the same as 1500 mg/kg b.w. dose group, the 2.000 mg/ kg b.w. dose group also reveals that there are grad-ual descents of mice weights where the means from
Table 7 The result of mice weight for 7 days after providing Sargassum sp extract
Dose (mg/kg b.w.)
Day 1 Day 2 Day 3 Day 4 Day 5 Day 6 Day 7
p-value mean ± SD mean ± SD mean ± SD mean ± SD mean ± SD mean ± SD mean ± SD
Na-CMC 26.89 ± 0.95 26.21 ± 5.04 26.53 ± 5.09 26.66 ± 5.06 25.91 ± 3.84 26.17 ± 3.87 26.34 ± 3.72 0.709
500 mg 28.98 ± 3.13 29.59 ± 3.30 29.98 ± 3.44 29.98 ± 3.60 27.98 ± 1.18 29.97 ± 3.27 28.44 ± 2.81 0.335
1.000 mg 22.15 ± 4.81 22.05 ± 4.76 21.70 ± 4.57 21.46 ± 4.56 21.70 ± 4.57 21.20 ± 4.47 20.74 ± 4.35 0.026
1.500 mg 24.67 ± 2.21 23.63 ± 1.84 23.59 ± 1.42 23.33 ± 0.53 22.41 ± 1.41 22.30 ± 1.41 21.20 ± 1.40 0.028
2.000 mg 21.10 ± 5.84 20.75 ± 5.97 20.48 ± 5.68 20.38 ± 6.28 20.16 ± 5.79 19.92 ± 5.54 17.81 ± 5.13 0.153
day 1 until day 7 are successively (21.10), (20.75), (20.48), (20.16), (19.92) and (17.81).
Discussion
This research is administering five treatment groups consisting of the first group as control group, which only provided Na-CMC; the second group provided 500 mg/kg b.w. Sargassum sp extract; the third group provided 1.000 mg/kg BB Sargassum sp extract; the fourth group provided 1.500 mg/kg b.w. Sargassum sp extract and the fifth group provided 2000 mg/kg b.w. Sargassum sp extract. Each treat-ment group consists of five mice. The observation of toxic effect is monitored at the minute 5, 10, 15, 30, 60, 120, 180, and 240. The toxic effect may be monitored when the mice run into descent of motion activity, escalation of catalepsy (imbalance test), salivation (spending saliva), urine (spending urine) and vascular (vasoconstriction). After moni-toring the toxic effect, the mice weight is scaled after performed intervention (giving extract) for 7 days to observe the change of mice weight.
Based on the result of analyzed data in table 1, we can recognize that p-value (0.000) < 0.005 is in the 1.500 mg/kg b.w. and 2.000 mg/kg b.w. dose groups. It reveals that there is significant difference on the descent of motion activity because of the toxic from Sargassum sp extract among the minute observations. The highest mean is 3.00 in
1.500 mg/kg b.w. dose group and ρ-value is 0.000 atau <0.005, the lowest mean is in 2.000 mg/kg b.w. dose group. It also indicates that the descent of motion activity is connected to depression of the composition of the central nervous system (CNS).30
Based on the Seomardji et al.31
research, he clarifies that the reduction of motor activity can be manifestation of tranquilizer activity, depression of central nerves, relaxation of muscle, paralysis, or anesthesia.
The catalepsy test revealed that there is no imbalance of dominant toxic effect against mice, because the imbalance effect only occurs at minute180 in the highest dose that is 1.500 mg/ kg b.w. and 2.000 mg/kg b.w., and the mean is 0.20 and the p-value is 0.375. Meanwhile, the results of analysis in other mice groups do not exhibit that there is imbalance of toxic effect at all. It can be observed in table 2 that the p-value is (-) or < 0.005 in Na-CMC, 500 mg/kg b.w., and 1.000 mg/ kg b.w. dose group which means that change does not occur from the first until the last minutes. Based on the data it is indicated that the imbalance in mice occurs because of the Sargassum spextract that is given although it is relatively minor and only occurs in 1.500 mg/kg b.w. and 2.000 mg/kg b.w. dose
group. Occurrence of the imbalance is connected to depression of central nervous system (CNS) compo-sition and muscle relaxation in mice.30
Catalepsy test or imbalance test is also called as righting reflex test that is the one restoring body position returning to normal position. Loss of reflex can indicate the existence of restriction of sensory nervous, spinal synapses, or efferent pathways.2
Based on the results of datum analysis of uri-nation test suggested in table 3, test results reveal that there is significant difference in 1.000mg/kg BB, 1.500 mg/kg b.w., and 2.000 mg/kg b.w. dose groups. It is referred to the p-value (<0.005) which is different from Na- CMC and 500mg/kg b.w. dose group not indicated significant difference (ρ > 0.005). The highest mean is 3.00 in 2.000 mg/kg b.w. dose pointed that the frequency of occurrence of the highest urine excretion is in 2.000 mg/kg b.w.. Rasyid et al.30
clarifies that there is exaggerated urine excretion connected to cholinergic effect in mice.
Differed from the results of urination test, the defecation test reveals that there are no signif-icant differences in all of dose groups, which is (ρ > 0.005). However, the results of defecation test in table 4 reveal that the lowest p-value is 0.016 atau (p > 0.005) in Na-CMC group indicated that the lowest frequency of occurrence of feces excretion during each minute of observation is in Na-CMC group and the highest one is in 2.000mg/kg b.w. dose group. Rasyid et al.30
assumes that the occur-rence of exaggerated excretion of feces (diarrhea) is connected to cholinergic effect in mice.
The results of salivation test clarified in table 5 reveal that there are significant differences among doses in Na-CMC, 500 mg/kg b.w., and 2.000 mg/ kg b.w. groups which is (p < 0.005) meaning the data is significant. Meanwhile the data in Na-CMC group in which the p-value is (-) or <0.005 also indicate that there is no occurrence of toxic effect of salivation at all, in other words we can assume that the mice in Na-CMC group do not encounter exaggerated saliva excretion. Table 5 also indicates that there is high saliva excretion in 2.000 mg/kg b.w. dose group suggested with the highest average of mean, which is in 2.000 mg/kg b.w. dose group. Rasyid et al.30
clarifies that the exaggerated saliva excretion is connected to cholinergic in mice.
system will support potencies to escalate blood-pressure. The occurrence of several toxic effects that is parallel to Riyanto et al.,6
stating that the Sargassum polycystum extract is able to induce the toxic effect in experimental animal, Artemia salina. It is assumed that Sargassum polycystum extract, which is found in Artemia salina medium, diffuses into the body and interrupts the metabolic and enzymatic process such as individual cell respira-tion and osmoregularespira-tion inArtemia salina.
Based on the results of data analysis performed, we can assume that the higher dose can provide highly dominant toxic effect in mice. The observation results indicate that the extract with higher concentration has more effect. It can be witnessed from the frequency of toxic symptom presenting from the descent of motion activities, occurrence of imbalance, escalation of diarrhea symptom, urination, and salivation as well as escalation of vaso-constriction. The results of datum analysis reveal that treatment with provided with 500 mg/kg b.w. dose of methanol extracts of Sargassum sp does not indicate the descent of dominant weight in mice. It indicates that the extracts of Sargassum sp do not inflict metabolism disorder in experimental animal where in this circumstance, refers to mice (Mus musculus). Nagayama et al.and Loomis35 stated that mice provided with Ecklonia kurome extracts do not indicate growth disorder. The growth of organism depends on absorption and bioavailability of nutrient, including protein, in the body. The absence of obstruction of the weight escalation reveals that the process of protein absorption in digestive canal is not disturbed by the presence of phlorotannin.
The observation results of mice for 7 days after providing the intervention, shown in table 7, in 1.000 mg/kg b.w., 1.500mg/kg b.w., and 2.000 mg/ kg b.w. dose group causes descent of mice weight
Sargassum echinocarpum extract indicates the
descent of mice weight as experimental animal except in control treatment and in the lowest dose group, which is 625 mg/kg b.w.
Based on the results of data analysis performed the toxic effect can be observed from the decrease of mice weight dominantly occurs in 2.000 mg/kg b.w. dose group from day 1 until day 7. It is also because of the assumption that the higher concen-tration of extract, the higher doses, and more active compound is contained in extract suspension. as we know that the dose is the main problem in determining whether the chemical substance is
categorized as toxic.2
With the higher concentra-tion of extract, the possibilities of metabolism disorder occurring in experimental animals are also high. It can be observed in table 7where Stern et al.andLoomis35
reported that the brown seaweed extract could obstruct the growth of the organism because of the presence of phlorotannin ability to form hydrogen bond with protein including enzyme in digestion canal.
Some research reveals that Sargassum
polycys-tum extracts contain phytochemical compound
such as, alkaloids, steroids and triterpenoids.6
Sargassum cinereum generally contains chemical
compounds, which are alkaloids, steroids, sapo-nins and tansapo-nins.32
Methanol extract of Sargassum duplicatum contains alkaloids, saponins, quinone, phenolic steroids, and flavonoid compound. Meanwhile, ethyl acetate extract of Sargassum duplicatum contains alkaloids, saponins, steroids, and flavonoid compound.14
It was Estimated that one of the several active compounds contained in
Sargassum spextract is an active compound, which
is responsible for occurrence of toxicity effect in mice. According to Riyanto et al.6
the alkaloids in Sargassum polycystum extract is toxic, because the compound indicates extensively physiological activity, almost all without exception, which tends to be alkali.
The results of Firdaus et al.3
research revealed that consumption of methanol extract of Sargassum
echinocarpum obtained from water of Talango
Island, East Java orally once up to 5.000 mg/kg BW of dose does not inflict death in experimental mice. It is indicated that the component or compound contained in methanol extract of Sargassum echi-nocarpum is categorized as relatively non-toxic
compound.3
Derelanko et al.33
categorizes that if a material or compound is consumed orally in experimental animals as many as 5.000 mg/ kg b.w. and does not induce death, it includes the moderate-toxin. In addition, when consumed more than 15.000 mg/kg b.w., it includes as non-toxic compound.
The research result obtained reveals that no mouse was dead during treatment. Based on the results, the data cannot be processed by using SPSS 22 for Windows. According to the agreement accepted by authorities, if the maximal dose does not evoke death of experimental animals, the LD50 is called as ‘pseudo’ LD50 with taking the maximal dose4
when the maximal dose of a compound does not create death in experimental animals, the compound is categorized as mildly toxic.
Conclusion
Based on the acute toxicity category, the extracts of Sargassum sp that was obtained from Punaga Takalar Regency, South Sulawesi includes mild toxicity.
Conflict of Interest
The authors report no conflict of interest
References
1. Yenusi, Tien N, Dimara, et al. Uji aktivitas antibak- teri dan antioksidan ekstrak pigmen klorofil rumput laut Caulerpa racemosa (Forsskal) J. Agardh. Jurnal Biologi Papua 2011;3: 53–58.
2. Suparmi. Sahri, Achmad. Mengenal potensi rumput laut: kajian pemanfaatan sumber daya rumput laut dari aspek industri dan kesehatan. Sultan Agung 2009;118: 154. 3. Firdaus M, Astawan, Made, et al. Toksisitas akut
ekstrak methanol rumput laut coklat sargassum echinocarphum. JPHPI 2012;2: 15.
4. Nursid, Muhammad, Wikita, et al. Aktivitas antioksidan, sitotoksisitas dan kandun-gan fukosantin ekstrak rumput laut coklat dari Pantai Binuangeun Banten. JPB Kelautan dan Perikanan 2013; 8.
5. Ayyad, Seif-Eldin N, Ezmilry ST, et al. Antioxidant, cytotoxic, antitumor and protective DNA damage metabolites from the red sea brown alga Sargassum sp. Pharma Res 2011;3: 3.
6. Riyanto, Erwin I, Widowati, et al. Skrining aktivitas antibakteri pada ekstrak Sargassum polycystum terhadap bakteri Vibrio harveyi dan Micrococcus luteus di Pulau Panjang Jepara. J Marine Res 2013; 115– 121.
7. Tjitrosoepomo G. Taksonomi tumbuhan: schizophyta, thallophyta, bryophyta dan pteridophyta. Yogyakarta: Gadjah Mada University Press; 2001.
8. Pamungkas, Tri A, Sunaryo, et al. Pengaruh suhu ekstraksi terhadap kualitas natrium alginat rumput laut sargassum sp. J Marine Res 2013; 2.
9. Anwar, Fauzi, Djunaedi, et al. Pengaruh konsentrasi KOH yang berbeda terhadap kualitas alginat rumput laut cokelat sargassum duplica-tum J. G. Agardh. J Marine Res 2013;2.
10. Aslan LM. Budidaya rumput laut. Kanisius, Yogyakarta: 1991.
11. Nurjanah, Abdullah A, Sudirman S. Aktivitas antioksidan dan komponen bioaktif kangkung air (Ipomoeae aquatica). J Inovasi dan Kewirausahaan. 2014;3.
12. Chismirina S, Rezeki S, Rischa CR. Pengaruh bahan antikaries beberapa tanaman herbal yang dikombinasi dengan pasta gigi yang mengandung fluoride terhadap pertumbuhan Steptococcus mutans secara in vitro. Dentika Dent J 2010;15: 2.
13. Eka K, Nanik S. Aktivitas fungsi ekstrak etanol batang binahong (anredera cordifolia (tenore) Steen.) terhadap candida albicans serta skrining fitokimia. J Ilmiah Kefarmasian 2011;1: 51–62.
14. Santi, Ika W, Radjasa, et al. Potensi rumput laut sargas-sum duplicatum sebagai sargas-sumber senyawa antifouling. J Marine Res 2014;3.
15. Fretes, Helly-De, Susantho AB, et al. Karatenoid dari makroalgae dan microalgae: potensi kesehatan aplikasi dan biote-knologi. J Teknologi dan Industry Pangan 2013;23: 2.
16. Sutarno, Tti Handayani, Setyawan, et al. Analisis komposisi nutrisi rumput laut sargassum cras-sifolium J. Agardh. Biofarmasi 2004;2.
17. Wikanta, Thamrin, Prehati, et al. Pengaruh pemberian ekstrak ethanol turbinaria decurrens terhadap per-baikan kerusakan hati tikus putih. Jurnal Pascapanen dan Bioteknologi Kelautan dan Perikanan 2010.
18. Sylvia PP, Nabilla VRP, Fitri DAP, et al. Pemanfaatan ekstrak kecubung (datura metel) untuk mengatasi nyeri gigi dan gingiva. BIMKGI 2012;1.
19. Ganiswarna SG. Farmakologi dan terapi. 5th Ed. Jakarta: Bagian Farmakologi FK-UI; 2007. p. 823–826.
20. Ariens EJ, Mutschler E, Simons AM. Pengantar toksikologi umum. In Yoke RW, Mathilda BW, Elin YS editors. Yogyakarta: Gajah Mada University Press; 1985; 2. 21. Lu FC. Toksikologi dasar, asas, organ sasaran dan
penilaian resiko. 2nd ed. In Edi N editor. Jakarta: UI-Press; 1995. p. 85–86.
22. Hayes AW. Principles and methods of toxicology. New York: Raven Press; 1983. p. 4.
23. Pusat Riset Obat dan Makanan. Pedoman uji toksisitas non-klinik secara in vivo. Jakarta: Badan Pengawasan Obat dan Makanan Republik Indonesia; 2001.
24. Klasse CD. Casarett and Duoll’s toxicology; the basic science of poisons. 3rd ed. New York: Macmillan Publishing Company; 1986. p. 11–13.
25. Turner RA. Screening methods in pharmacology. London: Academic Press; 1965. p. 61–63.
26. Loomis TA. Toksikologi Dasar. 3rd ed. In Imono AD. Yogyakarta: Laboratorium Farmakologi dan Fakultas Farmasi Gajah Mada; . p. 21; 225–226, 233–238.
27. Hodsgon E. A textbook of modern toxicology 4th ed. Canada: A John Wiley & Sons, Inc. Publication; 2010. p. 230–231.
28. Koeman JH. Pengantar umum toksikologi. In Yudoyono RH. Yogyakarta: Gajah Mada University Press; 1987; 34– 36.
29. Malole MBM, Pramono CSU. Penggunan hewan-hewan laboratorium. In Mashudi P. Bogor: Departemen Pendidikan dan Kebudayaan Direktorat Jenderal Pendidikan Tinggi Pusar antar Universitas Bioteknologi Institut Pertanian; 1989. p. 94.
30. Rasyid, Murniyanti, Usmar, et al. Uji toksisitas akut ekstrak etanol lempuyang wangi (Zingiber aromaticum Val.) pada mencit. Majalah Farmasi dan Farmakologi 2012;16: 13–22.
31. Soemardji, Andreanus A, Kumolosari, et al. Toksisitas akut dan penentuan DL 50Oral ekstrak air daun gandarusa (Justicia gendarussa Burm. F.) pada Mencit Swiss Webster. J Matematika dan Sains 2002;7: 57–62.
32. Alamsyah, Heru K, Widowati, et al. Aktivitas antibakteri ekstrak rumput laut Sargassum cinereum(J.G. Agardh) dari perairan Pulau Panjang Jepara terhadap bakteri escherichia coli da staphylococcus epi-dermidis. J Marine Res 2014;69– 78.
33. Derelanko MJ, Hollinger MA. CRC handbook of toxicology. Boca Raton: CRC Press; 1995.
34. Nurlaila, Donatus IA, Sugiyanto, et al. Petunjuk praktikum toksikologi. 1st ed. Yogyakarta: Laboratorium Farmakologi dan Toksikologi Fakultas Farmasi Universitas Gajah Mada; 1992. p. 3–5, 16– 30.
35. Loomis TA. Essential of toxicology. 3rd ed. Philadelphia: Lea & Febiger; 1987. p. 198–202.