The journal homepage www.jpacr.ub.ac.id p-ISSN : 2302 – 4690 | e-ISSN : 2541 – 0733
This is an open access article distributed under the terms of the Creative Commons Attribution-NonCommercial 4.0 International which
Development of Simple Bacterial Biosensor for Phenol Detection
in Water at Medium Concentration using Glass Microelectrode
Setyawan P. Sakti1*, Sri Sugiarti2 and Unggul P. Juswono1
1
Department of Physics, Brawijaya University, Malang, Indonesia
2
STIKES Widya Cipta Husada, Kepanjen, Indonesia
*
Corresponding email : [email protected]
Received 2 October 2015; Revised 11 November 2015; Accepted 13 January 2016
ABSTRACT
Water is one of the most fundamental natural resources on the earth. The availability of clean water becomes a global interest. Many human activities result in water pollution. One of many pollution substances in water is phenol. Phenol is a prevalent residual compound in industrial activity. Extensive use of phenol in industry degrades water quality. Regulation has been set in many countries to prevent further damage to the water resource caused by phenol and limiting phenol concentration in water before released into the environment. Therefore, it is important to develop a sensor which can detect phenol concentration in water to be used as a wastewater quality control system. This paper presents a development of bacterial biosensor using Pseudomonas putida and
Pseudomonas fluorescens as a sensitive biological material. The sensor was made from glass microelectrode using Ag/AgCl electrode as the reference electrode, silver electrode, and cellulose ester. The Pseudomonas putida was entrapped inside the nutrient solution and separated by cellulose ester membrane from water containing phenol. It was found that the Pseudomonas putida in used must be growth in 10 hours to reach its optimum growth condition. The linear relationship between biosensor output voltages to phenol concentration was measured for phenol concentration below 200 ppm. The sensitivity of the developed biosensor was 72 V/ppm for Pseudomonas putida and 68.8 V/ppm for
Pseudomonas fluorescens.
Key word: microelectrode, phenol biosensor, Pseudomonas putida, Pseudomonas fluorescens
INTRODUCTION
Clean water availability is one of the essential needs. Clean water resource, supply and distribution becoming a world crucial issue as water becomes a limited resource on the earth. Industrial, household and other human activities can produce residual products, which can pollute water. Sometimes, in an area where water is abundant, clean water can be limited because of people behavior, which produces pollutants.
water is harmful to the habitat in the polluted water and also people who consume the water. Phenol is efficiently degrading in the air and takes several days in soil. However, phenol can resist in water for a longer time this can cause danger to the ecology. The quality of water decrease when the water contains phenol.
Phenol enters a human body through many different routes. It can go inside human by through skin absorption, ingestion or inhalation [1]. Whatever the pathway is, phenol in a human body can cause health problems. The toxicology report of phenol from U.S. Department of Health [2] said that phenol toxicology could occur from skin to liver and cardiovascular system. Because of its toxicity and difficulties to be solved in water, the Environmental Protection Agency of the USA (EPA) set a low phenol concentration to be allowed in wastewater to less than 1 ppm. However, phenol concentration in the household and industrial wastewater is ranging from much higher. It can be tens to thousands ppm.
Effort minimizes phenol contents in wastewater done through many difference's approaches. Decomposing phenol in water is done based on several physical and chemical treatments have been reported. Among them are using ultrasonic [3,4], pulse discharge [5], ozonification [6], oxidation [7] and others. Phenol decomposition can be done using microbial based bioremediation [8–11]. Pseudomonasputida is one of the microbes, which is used to degrade phenol [8,11,12]. Phenol removal using absorbing material was also studied [13].
Many phenol detections has been reported using many different approaches [14–20]. As the methods primarily based on colorimetric or potentiometric methods, the system still required reagent solution, which will react with the phenol give a color change or voltage changes. Sensor development and method to detect phenol concentration until a recent year show that phenol detection method is even so attractive due to the importance to know phenol concentration in water as it is harmful not only for human being but also for other inhabitancies.
Biosensors for chemical substances detection is one of many promising methods to be developed. The recent paper shows an increasing number of enzyme inhibitor based biosensor for chemical substances detection, including phenol [21]. Bacterial biosensors are developed by use of bacterial organism as a leading agent for environmental pollutant's detection [22]. Biosensors for phenol detection is also among many developed biosensors [23–28] showing a high interest and importance of phenol detection. Pseudomonas is one of many bacterial species, which is used as a biological element in microbial biosensor [23,29– 33]. Pseudomonas consumes oxygen during the process of degrading phenol [34, 35]. Increasing number of phenol will also raise the respiratory activity of the Pseudomonas to degrade phenol. This mechanism can be used as a basis for a bacterial biosensor to detect phenol in water.
This paper presents a development step and potential use of Pseudomonas putida and
Pseudomonas fluorescens to be applied as a basis for the bacterial biosensor to detect phenol concentration in water. The biosensor is developed using a glass microelectrode and simple two-compartment separated by cellulose ester membrane. The detection is the indirect detection of phenol, but through the detection of biological oxygen demand contents in the water sample which is needed by the cell to degrade phenol in water.
EXPERIMENT
Chemicals and instrumentation
The journal homepage www.jpacr.ub.ac.id 3
NaCl, FeSO4.7H2O, Na2HPO4, CaCl2.2H2O, K2HPO4, KH2PO4, MgSO4.7H2O, (NH4)2SO4,
and phenol. Other materials are nutrient agar and bacto agar for bacterial culture media. The microelectrode was made using borosilicate microcapillary glass (GC 150F-10) with an external diameter of 1.5mm and silver wired (99.9%). The bacterial isolate
Pseudomonas putida, and Pseudomonas fluorescens was obtained from the Microbiology Laboratory of the Faculty of Mathematics and Natural Sciences, Brawijaya University, Malang, Indonesia. The microelectrode was made using a simple microelectrode maker using gravitational force and heating element. For the measurement, an electromechanical plotter with high input impedance was used.
Microorganism Preparation
Pseudomonas putida and Pseudomonas fluorescens was prepared from main bacterial stock. The bacterial were growth in a simple growth medium. Growth media for the
Pseudomonas putida was made of NH4NO3 1gr, (NH4)2SO4 0.5gr, NaCl 0.5gr, MgSO4·7H2O
0.5gr, K2HPO4 1.5gr, KH2PO4 0.5gr, CaCl2·2H2O 0.014gr, FeSO4·7H2O 0.01gr and trace element (1 ml/L). Growth media for Pseudomonas fluorescens was made of Na2HPO4 2.44gr,
KH2PO4 1.52gr, (NH4)2SO4 0.5gr, MgSO4·7 H2O 0.2gr, CaCl2·2H2O 0.05gr and trace element 10 ml/L. The media was mixed and sterilized at 121OC for 15 minutes. Phenol solution at 100mg/L was added to the media.
Pseudomonas putida and Pseudomonas fluorescens inoculant solution were made by growing bacterial in nutrient agar followed by growing in the simple growth mediums for inoculant. The bacteria were placed on nutrient agar and incubating at 30OC for 24 hours. Then the bacterial in nutrient agar were taken and put in 60 mL simple growth medium. Incubation was done on top of incubator shaker at 120 rpm for 24 hours. The temperature was maintained at 30OC.
Pseudomonas growth was observed by counting the number of cells. The number of cells was increased exponentially from 0 to 10 hours after incubation. At 10-hour incubation, the population growths were slowed down to reach its maximum population. The maximum number of Pseudomonasputida and Pseudomonasfluorescens were 8×10⁷/ml and 7×10⁷/ml. Those numbers were reached after 14-hour incubation. The number of cells was steady at their maximum number of cells from 14 hours to 24 hours after incubation in the simple growth medium. Based on the bacterial growth, the best time to use the Pseudomonasputida
and Pseudomonas fluorescens as bio-sensitive material of the biosensor is 10 hours after incubation.
Microelectrode Preparation
Glass microelectrode was made by pulling a borosilicate capillary glass using gravitational traction force from 0.4kg mass. In the middle of the borosilicate glass, a heater ring made from a tungsten wire was heated using 7 A current. The glass electrode was filled with KCl 0.1 M solution. The silver electrode was platted with AgCl using electro deposition method. Two silver wires were dipped in HCl 0.1 M solution, and 1.5 Volt DC voltage were applied across the electrode for the electrodeposition of AgCl on the silver wire. As a result, the silver electrode as the anode was platted with AgCl.
Mechanism and measurement
the proportional amount of dissolved oxygen. Therefore, phenol concentration can be detected indirectly by measuring the biochemical oxygen demand (BOD) in water.
Oxygen consumption in water by phenol depends on the two conditions. One is the number of Pseudomonas cells and phenol concentration. Higher cell's number means higher oxygen demand as more cells degrade phenol. Therefore, it is important to use Pseudomonas
cell when the cell is already in its steady-state growth condition, where the number of cell is constant. However, it must be selected not to close at the time where the cell will die. In addition, increasing phenol concentration will also push cell activity to degrade phenol. Therefore, by maintaining cells number will give a relationship between BOD concentrations to phenol concentration. One method to detect the BOD concentration is by using glass microelectrode. Therefore, in the detection of phenol concentration in water, glass microelectrode can be used for the detection of BOD concentration.
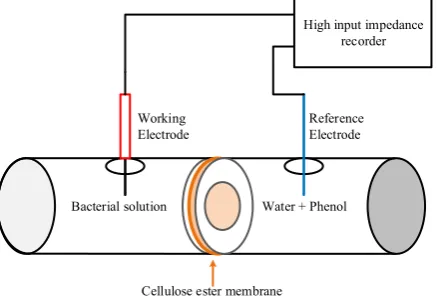
Pseudomonas solution and water containing phenol were separated by a cellulose ester membrane, as shown in Figure 1. The membrane works as a semipermeable membrane to encapsulate the pseudomonas as a sensitive biological layer of the sensor system. Cellulose ester membrane thickness is 0.14 mm with surface diameter in contact with water is 9 mm.
The working electrode (microelectrode containing KCl with Ag/AgCl wire) is placed in the Pseudomonas solution and the reference electrode (Ag/AgCl electrode) is placed in the phenol solution. Cell respiration activity during phenol degradation is measured through the potential difference between electrodes. The steady-state voltage across two electrodes was taken after 2 minutes at pH 7.0 under room temperature.
Figure 1. Measurement configuration
RESULT AND DISCUSSION
Phenol concentration and BOD1
Phenol concentration detection using bacterial biosensor is taken indirectly through the measurement of BOD concentration in water, which is detected using the glass microelectrode. Therefore, it is a must to know the relationship between the knowing phenol concentration and BOD concentration. BOD concentration was measured using Winkler's titration method. The measured BOD is the BOD after one day or known as BOD1. The used
of BOD1 is by assuming that the sample measurement is done as soon as possible to get a
rapid phenol concentration measurement.
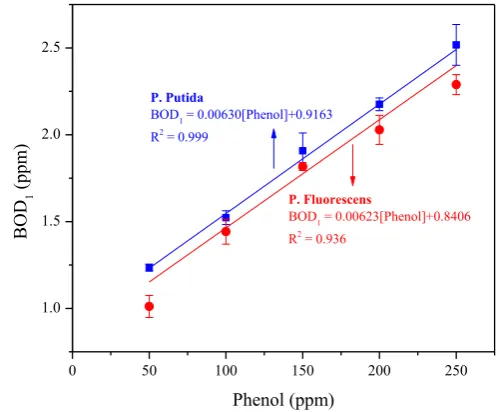
Figure 2 shows the relationship between phenol concentration and BOD1
concentration with Pseudomonas putida and Pseudomonas fluorescens in water phenol solution. Linear relationships between phenol concentration and BOD1 were found for the
Bacterial solution Water + Phenol
High input impedance recorder
Reference Electrode Working
Electrode
The journal homepage www.jpacr.ub.ac.id 5
concentration showing that the respiratory cell activity related proportionally to the phenol concentration.
Both Pseudomonas putida and Pseudomonas fluorescens show a similar respiration rate again phenol concentration indicated by similar value of the slope. The difference is only 1.1% which fell in the measurement uncertainty. For Pseudomonas putida, the curve intercepts the BOD value of 0.9163 ppm at no phenol, and 0.8406 ppm for Pseudomonas fluorescens. The measured BOD value at no added phenol is 0.642 ppm for Pseudomonas putida and 0.599 ppm for Pseudomonasfluorescens. Higher value of the measured BOD1 in a
solution with Pseudomonasputida can be caused by a higher number of Pseudomonasputida
cells compare to the Pseudomonasfluorescens. Nevertheless, both graphs show that the BOD concentration change is related directly to the phenol concentration change, independent of the initial number of cells.
Figure 2. Relationship
between phenol concentration and measured BOD1
The linear relationship between phenol concentration in water and measured BOD1
suggests that measuring the BOD1 can be related proportionally to the phenol concentration.
Regardless of the relationship coefficient one can measure the phenol concentration indirectly by measuring the BOD1 concentration. It means that the potential difference between
working glass microelectrode and reference electrode caused by the oxygen concentration can directly relate to the phenol concentration. This valid for the bacterial biosensor in this experiment using Pseudomonasputida or Pseudomonasfluorescens as bio-sensitive material.
Bacterial biosensor potential output
Based on the phenol concentration and BOD1 relationship above, the biosensor immobilized with Pseudomonas putida and Pseudomonas fluorescens to detect phenol concentration in water can be used for phenol concentration within the range from 50 ppm to 250 ppm. As the working microelectrode and reference electrode according to Figure 1 was measured the generated potential difference again, phenol concentration can be used as the relationship for the bacterial biosensor.
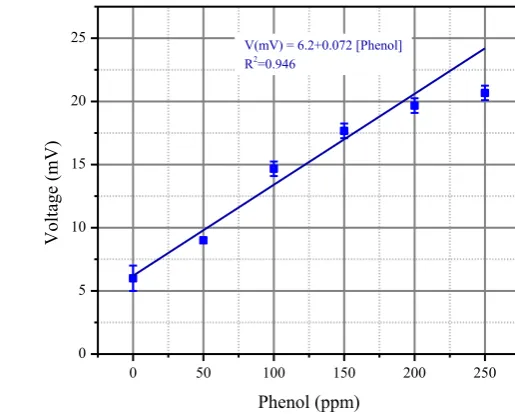
Figure 3 shows the potential differences at the electrodes again phenol concentration in water. The maximum measured output voltage at 250 ppm phenol concentration is 20.7 mV. The linear relationship between the phenol concentrations to the output voltage is found at phenol concentration from 0 to 200 ppm. At concentration 250 ppm, the output voltage of the
0 50 100 150 200 250
1.0 1.5 2.0 2.5
P. Putida
BOD1 = 0.00630[Phenol]+0.9163
R2 = 0.999
BOD
1
(ppm)
Phenol (ppm)
P. Fluorescens
BOD
1 = 0.00623[Phenol]+0.8406
biosensor is no longer in the linear relationship regime. The output voltage changes by 72.0
V/ppm for each ppm of phenol Suppose the output voltage of the biosensor will be processed using a 10bit analog to digital converter (ADC) with voltage reference at 5V in most microcontroller systems. It is suggested to be amplified by 200 times before the biosensor output connected at the ADC input.
Figure 3. Dependency of
Pseudomonasputida
bacterial biosensor output voltage to phenol
concentration
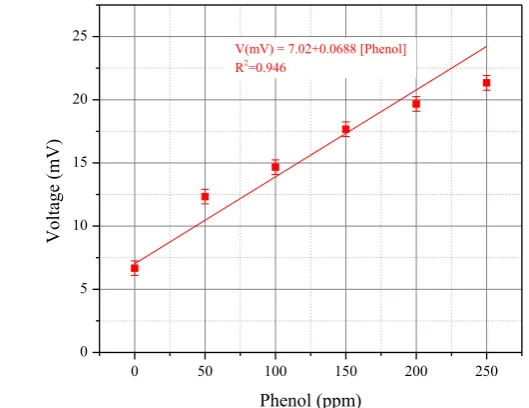
Figure 4 shows the potential differences at the electrodes again phenol concentration in water for biosensor immobilized with Pseudomonas fluorescens. The maximum measured output voltage at 250 ppm phenol concentration is 21.3 mV, slightly higher than the output voltage of the biosensor with Pseudomonas putida. The linear relationship between the phenol concentrations to the output voltage is also found at phenol concentration from 0 to 200 ppm. Although it is still in the linear regime, the initial stage of the non-linear response of the bacterial biosensor was observed at the phenol concentration of 200 ppm.
At phenol concentration below 200 ppm, the sensitivity of the biosensor using
Pseudomonas fluorescens is 68.8 V/ppm. This value is slightly lower compared to the sensitivity of the bacterial biosensor using Pseudomonas putida. However, the overall behavior of the biosensor is similar.
Comparing the output response of the biosensor with the BOD1 concentration; we can
see that the sensor responds not only affected by the BOD1 concentration but also the
physical chemistry properties of the membrane and the microelectrode. The linear relationship between the BOD1 and phenol from phenol concentration of 50 ppm to 250 ppm is not followed by the linear relation of the bacterial biosensor on those phenol ranges. It seems phenol transport from the phenol solution to the bacteria solution is limited by the membrane. The membrane limits the phenol transport at high phenol concentration. This is indicated by smaller voltage difference caused by increasing phenol at high concentration (200 ppm to 250 ppm). It means that the use of the bacterial biosensor developed using glass microelectrode is only limited for phenol concentration detection up to 200 ppm. Higher phenol concentration leads to more significant signal differences between the expected linear model and measured data. The ability of both pseudomonas bacterial biosensor to detect the high concentration of phenol may be suitable for industrial wastewater detection.
0 50 100 150 200 250
0 5 10 15 20 25
Voltage (mV)
Phenol (ppm)
The journal homepage www.jpacr.ub.ac.id 7
Figure 4. Dependency of
Pseudomonasfluorescens
bacterial biosensor output voltage to phenol
concentration
CONCLUSION
The concentration of phenol in water is linearly correlated to the BOD1 concentration
on the water containing Pseudomonas putida or Pseudomonas fluorescens. Linear relationship is found from the phenol concentration from 50 ppm to 250 ppm. There is no significant difference in the BOD1 concentration dependency to the phenol concentration
from both pseudomonas. The slope different is only 1.1% which fell under the measurement uncertainty.
The experiment shows that phenol concentration in the water below 200 ppm can be detected using developed bacterial biosensors utilizing Pseudomonas putida or Pseudomonas fluorescens. Output voltage of the bacterial biosensor immobilized with Pseudomonasputida
or Pseudomonasfluorescens is linear for a phenol concentration below 200 ppm. At 250 ppm (higher than 200 ppm) phenol concentration, the output voltage change is below the expected voltage according to the linear relationship.
REFERENCES
[1] Bruce, R. M., Santodonato, J., & Neal, M. W. Toxicol. Ind. Heal.1987, 3(4), 535–568. [2] Crawford, J., Faroon, O., Wilson, J., Llados, F. T., Garber, K., Paikoff, S. J., & Lumpkin, M. H. Cutan. Ocul. Toxicol. 2008. U.S. Department of Health & Human Services: Atlanta.
[3] Drijvers, D., Van Langenhove, H., & Beckers, M. Water Res.1999, 33(5), 1187–1194. [4] Vončina, D. B., & Majcen-Le-Marechal, A. Dye. Pigment.2003, 59(2), 173–179. [5] Sato, M., Tokutake, T., Ohshima, T., & Sugiarto, A. T. IEEE Trans. Ind. Appl.2008,
44(5), 1397–1402.
[6] Dombi, A., Ilisz, I., László, Z., & Wittmann, G. Ozone Sci. Eng. 2002. [7] Ji, F., Li, C., & Deng, L. Chem. Eng. J.2011, 178, 239–243.
[8] González, G., Herrera, G., García, M. T., & Peña, M. Bioresour. Technol.2001, 80(2), 137–142.
[9] Heerema, L., Wierckx, N., Roelands, M., Hanemaaijer, J. H., Goetheer, E., Verdoes, D., & Keurentjes, J. Biochem. Eng. J.2011, 53(3), 245–252.
[10] Loh, K. C., & Cao, B. Enzym. Microb. Technol.2008, 43(1), 1–12.
[11] Mordocco, A., Kuek, C., & Jenkins, R. Enzym. Microb. Technol. 1999, 25(6), 530– 536.
0 50 100 150 200 250
0 5 10 15 20 25
V(mV) = 7.02+0.0688 [Phenol] R2=0.946
Voltage (mV)
[12] El-Naas, M. H., Al-Muhtaseb, S. A, & Makhlouf, S., J. Hazard. Mater. 2009, 164 (2-3), 720–725.
[13] Bazrafshan, E., Kord Mostafapour, F., & Jafari Mansourian, H. Heal. Scope. 2013,
2(2), 65–66.
[14] Chriswell, C. D., Chang, R. C., & Fritz, J. S. Anal. Chem.1975, 47(8), 1325–1329. [15] Cerdà, V., Cerdà, a., Cladera, a., Oms, M. T., Mas, F., Gómez, E., Bauzá, F., Miró,
M., Forteza, R., Estela, J. M. TrAC - Trends Anal. Chem.2001, 20(8), 407–418.
[16] Sheikheldin, S. Y., Cardwell, T. J., Cattrall, R. W., Luque De Castro, M. D., & Kolev, S. D. Anal. Chim. Acta. 2000, 419(1), 9–16.
[17] Rueda, M. E., Sarabia, L. A, Herrero, A., & Ortiz, M. C., Anal. Chim. Acta. 2001,
446, 267–277.
[18] Pocurull, E., Sanchez, G., Borrull, F., & Marce, R. J. Chromatogr. A. 1995, 696(1), 31–39.
[19] Maya, F., Estela, J. M., & Cerdà, V. Talanta. 2010, 81(1-2), 1–8.
[20] Christophersen, M. J., & Cardwell, T. J. Anal. Chim. Acta. 1996, 323(1-3), 39–46. [21] Amine, A., Arduini, F., Moscone, D., & Palleschi, G. Biosens. Bioelectron.2016, 76,
180–194.
[22] Tecon, R., & Van Der Meer, J. R. Sensors. 2008, 8(7), 4062–4080. [23] Liu, C., Yong, D., Yu, D., & Dong, S. Talanta. 2011, 84(3), 766–770.
[24] Liu, Z., Liu, Y., Yang, H., Yang, Y., Shen, G., & Yu, R. Anal. Chim. Acta. 2005,
533(1), 3–9.
[25] Li, Y. F., Liu, Z. M., Liu, Y. L., Yang, Y. H., Shen, G. L., & Yu, R. Q. Anal. Biochem.
2006, 349(1), 33–40.
[26] Stoytcheva, M., Zlatev, R., Gochev, V., Velkova, Z., Montero, G., & Beleño, M. T.
Electrochim. Acta. 2014, 147, 25–30.
[27] Wang, P., Liu, M., & Kan, J. Sensors Actuators, B Chem.2009, 140(2), 577–584. [28] Karim, N., & Lee, H. J. Talanta. 2013, 116, 991–996.
[29] Reshetilov, A. N., Iliasov V, P., Filonov, A. E., Gayazov, R. R., Kosheleva, I. A., & Boronin, A. M. Process Biochem.1997, 32(6), 487–493.
[30] Timur, S., Pazarlioǧlu, N., Pilloton, R., & Telefoncu, A. Talanta. 2003, 61(2), 87–93. [31] Velusamy, V., Arshak, K., Korostynska, O., Oliwa, K., & Adley, C. Biotechnol. Adv.
2010, 28(2), 232–54.
[32] Conroy, D. J. R., Millner, P. a, Stewart, D. I., & Pollmann, K. Sensors. 2010, 10(5), 4739–4755.
[33] Deng, T., Li, J. S., Wang, H., Shen, G. L., & Yu, R. Q. J. Immunol. Methods. 2005,
299(1-2), 1–8.
[34] Mahiudddin, M., Fakhruddin, A. N. M., & Abdullah-Al-Mahin. ISRN Microbiol. 2012,
2012, 1–6.