O R I G I N A L A R T I C L E
Neuromuscular performance of paretic versus non-paretic plantar
flexors after stroke
Marius Steiro Fimland•Per Marius R. Moen• Tessa Hill•Tor Ivar Gjellesvik•Tom Tørhaug• Jan Helgerud•Jan Hoff
Received: 17 September 2010 / Accepted: 17 March 2011 / Published online: 1 April 2011 ÓThe Author(s) 2011. This article is published with open access at Springerlink.com
Abstract The objective of this study was to compare the neuromuscular function of the paretic and non-paretic plantar flexors (i.e. soleus, gastrocnemius medialis, latera-lis) in chronic stroke patients. It was hypothesized that the contractile rate of force development (RFD) and neural activation, assessed by electromyogram (EMG) and V-waves normalized to the M-wave, and voluntary acti-vation (twitch interpolation) would be reduced during plantar flexor maximum voluntary isometric contraction and that the evoked muscle twitch properties would be reduced in the paretic limb. Ten chronic stroke survivors completed the study. The main findings were that the paretic side showed deteriorated function compared to the non-paretic leg in terms of (1) RFD in all analyzed time
windows from force onset to 250 ms, although relative RFD (i.e. normalized to maximum voluntary force) was similar; (2) fast neural activation (for most analyzed time windows), assessed by EMG activity in time windows from EMG onset to 250 ms; (3) V-wave responses (except for gastrocnemius medialis); (4) voluntary activation; (5) the evoked peak twitch force, although there was no evidence of intrinsic muscle slowing; (6) EMG activity obtained at maximal voluntary force. In conclusion, this study dem-onstrates considerable neuromuscular asymmetry of the plantar flexors in chronic stroke survivors. Effective reha-bilitation regimes should be investigated.
Keywords H-reflexNeural driveBrain infarction Cerebrovascular accident Rehabilitation
Introduction
5–7 million people died of stroke in 2005, and there were 62 million survivors worldwide (Strong et al. 2007). The majority of these are chronically disabled. Reduced maxi-mal muscle strength is probably the best documented motor impairment after stroke (Bohannon 2007; Canning et al. 2004), particularly on the side contralateral to the lesion (Bohannon and Walsh1992; Horstman et al.2009).
Recently, the importance of explosive force production, namely rate of force development (RFD) (Dforce/Dtime) in the early phase of force production (\250 ms) has been emphasized for high functional performance (e.g. walking, postural balance, and avoiding falls) in elderly and diseased populations (Fleming et al.1991; Suetta et al.2004,2007; Aagaard et al. 2010). The capacity of the knee extensors (Bohannon and Walsh1992; Horstman et al.2010) and arm muscles (Canning et al. 1999; McCrea et al. 2003) to Communicated by Arnold de Haan.
M. S. Fimland (&)
Department of Public Health and General Practice, Faculty of Medicine, Norwegian University of Science and Technology, 7489 Trondheim, Norway
e-mail: [email protected]; [email protected]
M. S. Fimland
Hysnes Rehabilitation Center, St. Olavs University Hospital, Trondheim, Norway
P. M. R. MoenT. HillJ. HelgerudJ. Hoff Department of Circulation and Medical Imaging, Faculty of Medicine, Norwegian University of Science and Technology, Trondheim, Norway
T. I. GjellesvikT. TørhaugJ. Hoff
Department of Physical Medicine and Rehabilitation, St. Olavs University Hospital, Trondheim, Norway
J. Helgerud
perform fast voluntary contractions is reduced after stroke, particularly on the paretic side. However, no studies have investigated the degree of hemiparesis with regards to plantar flexor RFD at various time windows, which are important for different functional performance tasks, such as locomotion and postural balance. This investigation is of importance as the plantar flexors provide the majority of the power for onward gait progression (Winter1983), and plantar flexor weakness is considered a limiting factor of gait speed in stroke survivors (Nadau et al.1999).
There is a moderate to strong relationship between RFD and surface electromyogram (EMG) activity in the early phase of muscle contraction, indicating that contractile RFD is greatly dependent on the level of neuromuscular activity (Del Balso and Cafarelli 2007; Klass et al. 2008; Aagaard2003). Hence, it is likely that the EMG activity in the early phase of contraction is attenuated in the paretic limb compared with the non-paretic limb after stroke. Indeed, some studies have reported abnormal neuromus-cular activation among stroke survivors (Horstman et al. 2008; Newham and Hsiao 2001), which impairs their ability to drive the relevant muscles in both paretic and non-paretic limbs, although the impairment is usually more severe in paretic limbs. Recently, Klein et al. (2010) reported that paretic plantar flexor strength, EMG ampli-tude, and voluntary activation (twitch interpolation) was less than one half, about a third, and about a half, respec-tively, compared with the non-paretic limb. However, the degree of neural impairment of the paretic versus non-paretic plantar flexors during rapid contractions in chronic stroke has not been assessed.
The contractile properties of the muscle–tendon com-plex are commonly assessed with electrically stimulated contractions and are considered to reflect the morphology and mechanical muscle function of these tissues (Harridge et al. 1996). Consequently, the evoked muscle twitch properties were found to be associated with early RFD during voluntary contraction (Andersen and Aagaard 2006). To assess whether some of the hypothesized reduction in contractile RFD of the paretic limb could be due to changes at the muscle–tendon level we also wanted to assess muscle twitch properties.
An increasing number of studies have employed elec-trically evoked V-waves (a variant of the H-reflex) to assess the voluntary motor output from spinal motor neu-rons to muscle fibers in healthy individuals (Fimland et al. 2009; Gondin et al. 2006; Aagaard et al. 2002b), and recently also in multiple sclerosis patients (Fimland et al. 2010). The V-wave is produced when a stimulus sufficient to evoke a maximal M-wave is delivered to a motor nerve during voluntary contraction. The peak-to-peak amplitude of the V-wave is considered to reflect the magnitude of descending neural drive from supraspinal centres to spinal
motor neurons (Upton et al. 1971; Aagaard et al.2002b), though spinal factors (motor neuron excitability, pre/post-synaptic inhibition) could also be implicated (Aagaard 2003). This technique was recently proposed to be a useful and non-invasive tool to investigate neural alterations in neurological patients (Fimland et al. 2010).
To prescribe effective rehabilitation regimes, it is important to improve the understanding of asymmetry of motor performance between limbs after stroke and its underlying mechanisms. Therefore, the objective of this study was to compare the neuromuscular function of the paretic and non-paretic plantar flexors in chronic stroke survivors, with special regard to neural impairments of the paretic plantar flexors. It was hypothesized that the RFD and neural activation (assessed by EMG, V-wave responses and twitch interpolation technique) would be reduced and that the intrinsic muscle properties would be diminished in the paretic compared with the non-paretic plantar flexors.
Methods
Participants
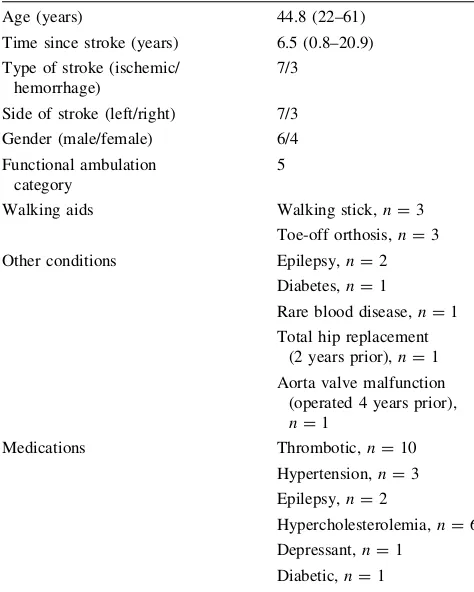
Twelve participants who had suffered a cerebrovascular injury (8 left hemisphere lesions and 4 right hemisphere lesions) were recruited through a stroke rehabilitation center register. All participants took part in physical ther-apy sessions regularly at the community-based level. Inclusion criteria were[6 months since stroke, and mod-erate to severe hemiparesis but with the capacity of walk-ing independently, although use of a walkwalk-ing stick or orthosis was permitted. The exclusion criteria were high blood pressure resistant to treatment, pregnancy, reduced cognitive and visuospatial abilities to such an extent that it could influence the ability to undergo testing. All recruited participants underwent a medical examination before final inclusion. Two participants were excluded: one because no plantar flexor hemiparesis was observed and the other because of discomfort due to spasticity that was caused by electrical stimulation of the tibial nerve. The study was approved by the Regional Committee for Medical Research Ethics and all participants signed informed consent prior to inclusion. We certify that all applicable institutional and governmental regulations concerning the ethical use of human volunteers were followed during the course of this research. Participant characteristics are presented in Table1.
Study overview
voluntary activation via twitch interpolation, as well as the maximal muscle strength of the paretic and non-paretic plantar flexors of chronic stroke survivors.
Experimental procedure
Prior to the experimental session, the participants attended two sessions in which they were familiarized with electri-cal stimulation and practiced plantar flexor maximum voluntary isometric contractions (MVCs).
To obtain MVCs and electrophysiological measure-ments of the plantar flexors, participants were lying in the prone position on a bench with one foot (in random order) placed in a custom-made isometric dynamometer made of steel and hard plastic. Rigid straps made sure the heel and forefoot were secured to the footplate with the ankle in a 90° position. The tested leg was fully extended. The opposite leg rested on a pillow with the knee slightly flexed. Participants were instructed to perform the MVCs as ‘fast and hard as possible’, and were given strong verbal encouragement. To optimize performance during the experimental session, participants were provided energetic verbal encouragement, and visual feedback of force on a computer screen.
After positioning of electrodes and the subject in the correct position, electrical stimuli of increasing current
were delivered to the tibial nerve. The stimulation started below H-reflex threshold and the current was increased by 2–5 mA every 10 s until the maximal peak-to-peak amplitude SOL M-wave was obtained. The stimulation intensity was doubled and three maximal M-waves and associated mechanical twitches were recorded. Subse-quently, eight V-waves and concomitant MSUP-waves and interpolated twitches were obtained during MVCs at a rate of 1 per 45 s. These responses were manually elicited*2 s after onset of MVC. Subsequently, the procedure was repeated for the other leg.
Electromyogram and force recordings
After careful preparation of the skin to obtain inter-elec-trode impedance\5 kX, pairs of bipolar Ag/AgC1 surface electrodes (Ambu M-00-S, Ballerup Denmark) were placed on the soleus (SOL) along the mid-dorsal line, approxi-mately 5 cm distal to the gastrocnemius muscles, while the electrodes on gastrocnemius medialis (GM), tibialis ante-rior (TA), and gastrocnemius lateralis (GL) were placed according to the recommendations proposed by SENIAM (Hermens et al.2000).
Electromyogram was sampled (ME6000 Biomonitor, Mega Electronics LTD, Kuopio, Finland) at 2 kHz, CMRR: 110 dB, amplified, band-pass filtered (8–500 Hz), and stored on a personal computer. Neuromuscular activity levels for each muscle were calculated by converting the raw EMG activity to the root mean square (RMS) values of the 500 ms (250 ms on each side) epoch corresponding with peak force preceding the evoked maximal M-wave superimposed on the MVC (MSUP). The EMGRMSactivity, except from antagonist TA coactivity which was expressed in absolute units (mV), was normalized to the average MSUP (i.e. EMGRMS/MSUP). To estimate rapid neural activity, EMGRMSactivity was analyzed in the time win-dows 0–50, 0–100, 0–150, 0–200, and 0–250 ms and nor-malized to the average MSUP. Onset of EMG activity was identified manually.
The contractile RFD (N s-1) was defined as the mean slope of the force–time curve (Dforce/Dtime) in intervals of 0–50, 0–100, 0–150, 0–200, and 0–250 ms. Relative RFD (i.e. RFD/MVC expressed as %MVC/s) was also calculated for the same time windows. The onset of contraction was defined as the point corresponding to 3% of peak force. The three MVCs with the highest peak forces were analyzed and averaged to obtain the above EMG and force variables. Voluntary activation was determined via the twitch interpolation technique. Percent voluntary activation was calculated as [1-(superimposed twitch/resting peak twitch)]9100 (Belanger and McComas1981).
The isometric forces were recorded by a force-trans-ducer (Model 363-D3-50-20P1, Revere Transducers,
Table 1 Participant characteristics
Age (years) 44.8 (22–61)
Time since stroke (years) 6.5 (0.8–20.9)
Type of stroke (ischemic/ hemorrhage)
7/3
Side of stroke (left/right) 7/3
Gender (male/female) 6/4
Functional ambulation category
5
Walking aids Walking stick,n=3
Toe-off orthosis,n=3
Other conditions Epilepsy,n=2
Diabetes,n=1
Rare blood disease,n=1
Total hip replacement (2 years prior),n=1
Aorta valve malfunction (operated 4 years prior),
n=1
Medications Thrombotic,n=10
Hypertension,n=3
Epilepsy,n=2
Hypercholesterolemia,n=6
Depressant,n=1
Diabetic,n=1
Tustin, CA, USA) that responds linearly within a load ranging between 0 and 250 kg with a reproducibility error of 0.1% attached to the ankle dynamometer. Force was recorded at 1 kHz and digitally low-pass filtered (10 Hz). EMG, contractile RFD, and plantar flexion force were analyzed with commercial software (Mega Electronics LTD, Kuopio, Finland).
Evoked potentials
To evoke interpolated mechanical twitches of the plantar flexors, and V-waves, and concomitant MSUP-waves in
the SOL, GM, and GL we delivered 1 ms square wave stimuli to the posterior tibial nerve in the popliteal fossa using a constant-current stimulator (DS7AH, Digitimer, Welwyn Garden City, UK), via gel-coated bipolar felt pad electrodes (8 mm diameter, 25 mm between tips; Digitimer, Welvyn Garden City, UK). To avoid anodal block, the cathode was placed medial to the anode (Pierrot-Deseilligny and Burke 2005). After the optimal site of stimulation was determined, rigid taping ensured that the stimulation electrode maintained the same posi-tion throughout the experimental session. 200% of the stimulus intensity needed to obtain a maximal SOL M-wave from the resting muscle was employed to evoke V-waves, maximal M-waves, and interpolated twitches. To ensure that measurement conditions were stable, only V-waves with a corresponding MSUP[90% of the highest MSUP were included in the analysis (Fimland
et al. 2009).
Muscle contractile properties
The following twitch characteristics were determined from the mechanical twitch associated with the maximal M-wave evoked at rest: (1) peak twitch, defined as the difference from baseline to peak twitch force, (2) time to peak twitch force, defined as the time difference between onset (3% of peak twitch) and peak twitch force, and (3) half-relaxation time, defined as the time difference between peak twitch force and half-twitch force. Three twitches were analyzed and averaged for each limb.
Statistical analysis
The Wilcoxon signed ranks test (non-parametric equivalent to the pairedttest) was used to assess differences between the paretic and non-paretic plantar flexors. Statistical sig-nificance was set at P\0.05 (two-tailed). The data are presented as mean±SD in the text and tables and mean±SE in figures, unless otherwise stated. Statistical analyses were performed with SPSS version 17.0 and 18.0 (Chicago, IL, USA).
Results
MVC, contractile RFD, voluntary activation, and muscle twitch properties
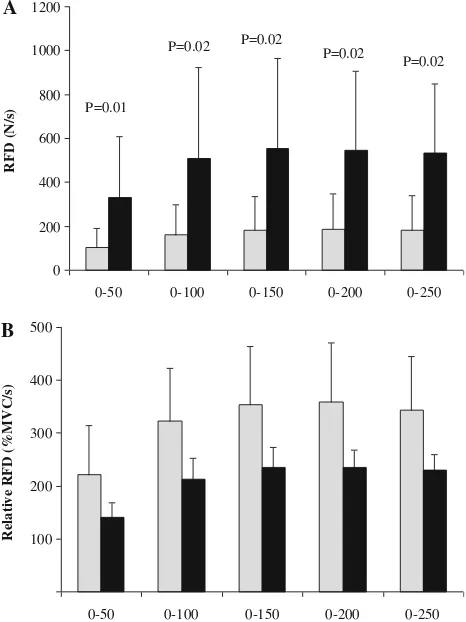
The MVC of the paretic limb was 70±62 N while the non-paretic leg produced 229±66 N (-72%;P=0.005). Contractile RFD was significantly lower in the paretic leg compared with the non-paretic leg during time windows 0–50, 0–100, 0–150, 0–200, and 0–250 ms (-54 to-67%; Fig.1a). Relative RFD (i.e. %MVC/s) was similar between limbs (P =0.515–767; Fig. 1b). Voluntary activation was substantially reduced in the paretic- compared with the non-paretic plantar flexors (-71%; Fig.2) The evoked peak twitch force of the paretic plantar flexors was sig-nificantly lower compared with the non-paretic plantar flexors (-35%), while time to peak twitch force and half-relaxation time were similar for both limbs (Table2).
EMG activity
Significantly lower EMGRMS/MSUP activity of the SOL,
GM, and GL were observed during MVC of the paretic limb
0 200 400 600 800 1000 1200
0-50 0-100 0-150 0-200 0-250
RF
D (
N/
s) P=0.01
P=0.02
P=0.02 P=0.02
P=0.02
100 200 300 400 500
0-50 0-100 0-150 0-200 0-250
Relati
v
e
RFD (%MVC/s)
A
B
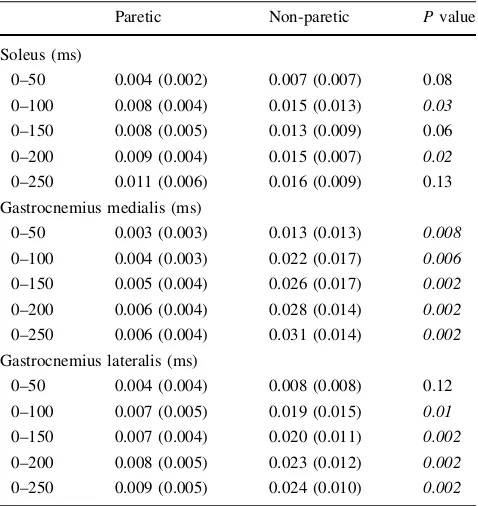
compared with the non-paretic limb (-34 to-73%; Fig.3). No difference between limbs could be detected for absolute (mV) antagonist TA EMGRMScoactivity (P=0.62). The SOL of the paretic limb had a lower EMGRMS/MSUPduring time windows 0–100 and 0–200 ms (-25,-32%, respec-tively), but did not reach statistical significance for the time intervals 0–50, 0–150, and 0–250 ms (Table3). The GM EMGRMS/MSUPof the paretic limb was significantly reduced
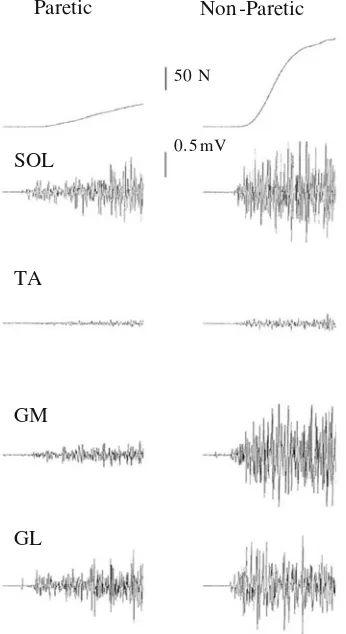
for all time windows (-58 to-81%; Table 3). The GL of the paretic limb had a lower EMGRMS/MSUP during time windows 0–100, 0–150, 0–200, and 0–250 ms (-41 to -61%), but did not reach statistical significance for the time window 0–50 ms (Table3). Sample recordings of raw force and EMG traces are presented in Fig.4.
M-waves and V-waves
The V/MSUPratios for the SOL and GL were significantly reduced for the paretic limb compared with the non-paretic leg (-35,-34%), while no differences were observed for the GM V/MSUPratio (Fig.5). There were no differences between limbs for the maximal M-waves evoked at rest or during MVC (i.e.MSUP; Table 4).
Discussion
This study examined side-to-side differences of contractile RFD, normalized EMG, V-wave responses, voluntary activation, and muscle twitch properties of the plantar flexors of the paretic and non-paretic legs in chronic stroke patients. The main findings are that (1) absolute RFD was substantially reduced in the paretic plantar flexors in all analyzed time windows from force onset to 250 ms of muscle contraction; (2) fast neural activation (normalized 0
10 20 30 40 50 60 70 80 90 100
Voluntary activation (%)
P=0.005
Paretic Non-Paretic
Fig. 2 Percent voluntary activation of the plantar flexors calculated via twitch interpolation. Mean±SE
Table 2 Muscle contractile properties
Paretic Non-paretic Pvalue
Peak twitch (N) 34 (19) 52 (22) 0.01
Time to peak twitch (ms) 80 (9) 79 (28) 0.73
Twitch half-relaxation time (ms) 87 (24) 101 (43) 0.23
Data are presented as mean (SD)
0,00 0,01 0,02 0,03 0,04 0,05
SOL GM GL
E
M
Gr
ms/M
su
p
P=0.006
P=0.002 P=0.002
Fig. 3 Root-mean-square electromyogram activity (EMGRMS) obtained in the soleus (SOL) gastrocnemius medialis (GM) and lateralis (GL) during plantar flexor maximum voluntary isometric contraction, and normalized to the superimposed M-waves (MSUP).
Gray barsparetic limb. Mean±SE
Table 3 Rapid neural activation
Paretic Non-paretic Pvalue
Soleus (ms)
0–50 0.004 (0.002) 0.007 (0.007) 0.08
0–100 0.008 (0.004) 0.015 (0.013) 0.03
0–150 0.008 (0.005) 0.013 (0.009) 0.06
0–200 0.009 (0.004) 0.015 (0.007) 0.02
0–250 0.011 (0.006) 0.016 (0.009) 0.13
Gastrocnemius medialis (ms)
0–50 0.003 (0.003) 0.013 (0.013) 0.008
0–100 0.004 (0.003) 0.022 (0.017) 0.006
0–150 0.005 (0.004) 0.026 (0.017) 0.002
0–200 0.006 (0.004) 0.028 (0.014) 0.002
0–250 0.006 (0.004) 0.031 (0.014) 0.002
Gastrocnemius lateralis (ms)
0–50 0.004 (0.004) 0.008 (0.008) 0.12
0–100 0.007 (0.005) 0.019 (0.015) 0.01
0–150 0.007 (0.004) 0.020 (0.011) 0.002
0–200 0.008 (0.005) 0.023 (0.012) 0.002
0–250 0.009 (0.005) 0.024 (0.010) 0.002
EMG activity in time windows before 250 ms) was reduced in the paretic leg for most time windows; (3) the normalized V-wave was substantially reduced in the SOL and GL of the paretic limb; and (4) voluntary activation was considerably reduced in the paretic plantar flexors. In addition, normalized EMG activity obtained during maxi-mal force, as well as MVC, was substantially decreased in the paretic limb.
The present investigation found substantial differences in the contractile RFD between the lower limbs in all 50 ms time windows from 0 to 250 ms. Absolute RFD was between one-half and one-third of the paretic limb. However, when RFD was normalized to MVC (i.e. rela-tive RFD) these differences disappeared. This reveals that there is no significant difference between limbs with respect to contractile speed properties of the muscles. It also demonstrates that maximum voluntary force is important to achieve a high absolute RFD for these patients in all investigated time periods. Similar to the results for absolute RFD, the normalized EMG activity
during the 50 ms time windows from onset of electrical activity to 250 ms was substantially lower in the paretic plantar flexor muscles for most time windows (see Table3). Unsurprisingly, this suggests that reduced neu-romuscular activity to a large extent explains reduced contractile RFD of the paretic plantar flexors. It can be speculated that the gastrocnemii contributed more to the absolute RFD impairment of the paretic limb, as the EMG impairments seemed to be more substantial for these muscles than the SOL (see Table3).
It should be noted that substantial disuse atrophy of the muscles occurs after stroke (Hachisuka et al.1997; Slager et al.1985) which would negatively affect explosive- and maximal strength capacity, particularly in the paretic limb (Gracies 2005). The present participants had an average
Paretic Non -Paretic
50 N
0. 5 mV SOL
TA
GM
GL
Fig. 4 Recordings of plantar flexor maximum voluntary isometric contraction force and corresponding soleus (SOL), tibialis anterior (TA), gastrocnemius medialis (GM) and gastrocnemius lateralis (GL) electromyogram. The end of the sample traces are 500 ms after onset of contraction. The differences between the paretic and non-paretic limb can easily be observed
0,00 0,05 0,10 0,15 0,20 0,25 0,30
SOL GM GL
V/Msup
P=0.02 P=0.01
Fig. 5 V-waves normalized to the concomitant superimposed M-wave (MSUP) obtained in the soleus (SOL) gastrocnemius medialis (GM) and lateralis (GL) during plantar flexor maximum voluntary isometric contraction.Gray barsparetic limb. Mean±SE
Table 4 Amplitudes (lV) of evoked potentials
Paretic Non-paretic Pvalue
Soleus
MMAX 7,317 (2,730) 6,921 (2,293) 0.846
MSUP 8,352 (2,839) 9,481 (1,751) 0.232
V-wave 935 (888) 1,654 (1,448) 0.002 Gastrocnemius medialis
MMAX 7,488 (2,178) 7,002 (2,225) 0.557
MSUP 7,492 (2,873) 6,581 (3,285) 0.131
V-wave 924 (727) 885 (406) 0.625 Gastrocnemius lateralis
MMAX 6,222 (2,235) 7,242 (3,041) 0.232
MSUP 6,890 (2,456) 7,887 (2,741) 0.557
V-wave 788 (392) 1,784 (1,472) 0.006 Data are presented as mean (SD)
time since stroke of 6.5 years, which would provide ample time for disuse atrophy to occur. In support of this, a decreased magnitude of the evoked twitch was observed in the paretic versus the non-paretic plantar flexors, although there was no evidence for slowing of the paretic versus the non-paretic leg assessed by the time to peak twitch or half-relaxation time of the twitch.
The reduced ability to generate maximal force in the paretic compared with the non-paretic limb is in line with several previous reports (Bohannon and Walsh 1992; Gracies2005; Klein et al.2010), and was accompanied by lower normalized SOL, GM, and GL EMG activity, as well as reduced plantar flexor voluntary activation in the paretic compared with the non-paretic leg. Decreased agonist EMG activity of the paretic plantar flexors is in line with findings from paretic thigh (Horstman et al.2008; Newham and Hsiao 2001) and recently also from paretic plantar flexor muscles (Klein et al. 2010). Substantially reduced voluntary activation of paretic plantar flexors is in agree-ment with Klein et al. (2010).
In addition to conventional EMG recordings we also evoked V-wave responses in the present study. Like EMG amplitude, the V-wave is also considered a measure of efferent neural drive but depends on different underlying physiological mechanisms (Aagaard 2003; Fimland et al. 2010). The EMG amplitude comprises the sum of the electrical contributions from active motor units located underneath the recording electrodes (Farina et al.2004). In contrast, the evoked V-wave depends on the amount of antidromic clearing attributable to collision between voli-tionally generated descending action potentials and anti-dromic action potentials evoked by supramaximal nerve stimulation (Aagaard et al. 2002b; Fimland et al. 2010). That is, greater descending drive should abolish more of the evoked antidromic action potentials, allowing more of the evoked reflex to pass to the muscle where it is recorded as a V-wave (see Aagaard et al.2002bfor a more detailed description). Furthermore, the V-wave amplitude involves H-reflex excitability, namely factors such as motor unit excitability and pre/post-synaptic inhibition (Aagaard 2003). Substantial reliability was recently documented for normalized V-wave responses of the SOL and GM (intra-class correlation coefficients 0.86 and 0.90, respectively) (Solstad et al.2011).
As expected, there were significant differences between the paretic and non-paretic SOL and GL V/MSUP ratios. There was, however, no difference in the GM V/MSUP ratio. This is quite surprising considering the EMG results which suggest that the GM is at least as affected as the SOL and GL. Nonetheless, the lower V-wave responses of the SOL and GL of paretic plantar flexors suggest reduced descending drive from supraspinal centers to the paretic limb, although spinal factors may also be involved
(Fimland et al. 2010; Upton et al. 1971; Aagaard 2003; Aagaard et al. 2002b).
Although methodological limitations exist with surface EMG recordings (for review see Farina et al. 2004), the reduced EMG activity recorded in the paretic limb is to a large extent caused by a reduced outflow of action poten-tials from spinal motoneurons to muscle fibers. This notion is further strengthened by the V-wave measurements. Further, both the EMG and V-wave responses were nor-malized to the evoked compound muscle action potential (MSUP), which should at least partly take into account peripheral influences on the EMG and V-wave recordings (Gandevia2001; Aagaard2003). To our knowledge, this is the first time that rapid EMG activity and the evoked V-wave has been obtained in stroke patients; thus, the present study has made an important contribution by reporting new evidence of reduced efferent neural drive to muscle fibers of the paretic limb after stroke during explosive and maximal force production.
The reduced EMG and V-wave responses to muscle fibers in the paretic limb we observed are caused to a large extent by reduced descending drive from supraspinal cen-ters, and probably increased recurrent inhibition (Garland et al. 2009). This will result in slower motoneuron firing frequencies and insufficient motoneuron recruitment (Garland et al.2009; Gracies2005). However, differences in motoneuron excitability and pre/post-synaptic inhibition may also influence V-wave responses (Aagaard 2003).
et al.2004; Keenan et al.2005). In the present study these factors should partly be accounted for, as EMG signals were normalized to the compound muscle action potential (Gandevia 2001). Lack of statistical power due to a low number of participants (n=10) likely contributed to the inability to find statistical significance for all time windows.
Force production is also dependent on factors that are located distal to the neuromuscular junction. A substan-tially reduced peak mechanical twitch was observed for the paretic plantar flexors. This suggests detrimental effects on muscle morphology in the paretic compared with the non-paretic limb. The finding of decreased evoked force of the plantar flexors is not entirely in line with the findings of Horstman et al. (2008) who observed reduced intrinsic capacities of paretic and non-paretic knee extensors in subacute stroke compared with healthy volunteers. The inability of the study to detect differences between limbs could be due to the fact that their volunteers were in the subacute phase, and thus paretic muscles may not have degraded to the same extent as in the present study. We observed no differences in the maximal M-waves evoked at rest or during MVC, suggesting that the muscle fibers of the plantar flexor muscles of the paretic and non-paretic limbs are similarly responsive to neural outflow. Thus, the peripheral impairments appear to be considerably less than the neurological impairments.
The side-to-side differences observed underlines the need for effective rehabilitation programs for improving neuromuscular activation and explosive strength of par-ticularly the paretic leg in stroke survivors. Previous well-controlled studies in stroke patients investigating effects of strength training on locomotion and postural balance per-formance have reported little or no effects (Saunders et al. 2009). However, these studies did not employ a training strategy optimized for developing explosive strength. That is, strength training was not performed with high inten-tional velocity which has been suggested to be an important stimulus for explosive strength adaptation (Behm and Sale 1993). Several previous studies have shown that strength training is an effective way of increasing efferent neural drive and explosive strength in healthy young and elderly individuals (Caserotti et al. 2008; Aagaard et al. 2002a), and in various other patient groups (Fimland et al. 2010; Suetta et al.2004), and should be further investigated for stroke patients. Notably, for the paretic plantar flexors we observed the lowest V-wave responses reported for any group of subjects. However, 15 sessions of maximal strength training normalized this neurological impairment in multiple sclerosis patients (Fimland et al.2010), and we suggest that this should also be examined in stroke patients. In conclusion, the present study demonstrates that the neuromuscular performance of paretic versus non-paretic
plantar flexors after stroke is substantially decreased. Specifically, contractile RFD and rapid neural activation during various time windows, evoked peak twitch force, voluntary activation and normalized EMG activity, and V-wave responses, as well as maximal isometric strength were, in general, substantially lower on the paretic side.
Open Access This article is distributed under the terms of the Creative Commons Attribution Noncommercial License which per-mits any noncommercial use, distribution, and reproduction in any medium, provided the original author(s) and source are credited.
References
Aagaard P (2003) Training-induced changes in neural function. Exerc Sport Sci Rev 31:61–67
Aagaard P, Simonsen EB, Andersen JL, Magnusson P, Dyhre-Poulsen P (2002a) Increased rate of force development and neural drive of human skeletal muscle following resistance training. J Appl Physiol 93:1318–1326
Aagaard P, Simonsen EB, Andersen JL, Magnusson P, Dyhre-Poulsen P (2002b) Neural adaptation to resistance training: changes in evoked V-wave and H-reflex responses. J Appl Physiol 92:2309–2318
Aagaard P, Suetta C, Caserotti P, Magnusson SP, Kjaer M (2010) Role of the nervous system in sarcopenia and muscle atrophy with aging: strength training as a countermeasure. Scand J Med Sci Sports 20:49–64
Andersen LL, Aagaard P (2006) Influence of maximal muscle strength and intrinsic muscle contractile properties on contractile rate of force development. Eur J Appl Physiol 96:46–52 Behm DG, Sale DG (1993) Intended rather than actual movement
velocity determines velocity-specific training response. J Appl Physiol 74:359–368
Belanger AY, McComas AJ (1981) Extent of motor unit activation during effort. J Appl Physiol 51:1131–1135
Bohannon RW (2007) Muscle strength and muscle training after stroke. J Rehabil Med 39:14–20
Bohannon RW, Walsh S (1992) Nature, reliability, and predictive value of muscle performance measures in patients with hemi-paresis following stroke. Arch Phys Med Rehabil 73:721–725 Canning CG, Ada L, O’Dwyer N (1999) Slowness to develop force
contributes to weakness after stroke. Arch Phys Med Rehabil 80:66–70
Canning CG, Ada L, Adams R, O’Dwyer NJ (2004) Loss of strength contributes more to physical disability after stroke than loss of dexterity. Clin Rehabil 18:300–308
Caserotti P, Aagaard P, Larsen JB, Puggaard L (2008) Explosive heavy-resistance training in old and very old adults: changes in rapid muscle force, strength and power. Scand J Med Sci Sports 18:773–782
Del Balso C, Cafarelli E (2007) Adaptations in the activation of human skeletal muscle induced by short-term isometric resis-tance training. J Appl Physiol 103:402–411
Farina D, Merletti R, Enoka RM (2004) The extraction of neural strategies from the surface EMG. J Appl Physiol 96:1486–1495 Fimland MS, Helgerud J, Gruber M, Leivseth G, Hoff J (2009) Functional maximal strength training induces neural transfer to single-joint tasks. Eur J Appl Physiol 107:21–29
Fleming BE, Wilson DR, Pendergast DR (1991) A portable, easily performed muscle power test and its association with falls by elderly persons. Arch Phys Med Rehabil 72:886–889
Gandevia SC (2001) Spinal supraspinal factors in human muscle fatigue. Physiol Rev 81:1725–1789
Garland SJ, Gray VL, Knorr S (2009) Muscle activation patterns and postural control following stroke. Mot Control 13:387–411 Gondin J, Duclay J, Martin A (2006) Soleus- and
gastrocnemii-evoked V-wave responses increase after neuromuscular electri-cal stimulation training. J Neurophysiol 95:3328–3335 Gracies JM (2005) Pathophysiology of spastic paresis I: paresis and
soft tissue changes. Muscle Nerve 31:535–551
Hachisuka K, Umezu Y, Ogata H (1997) Disuse muscle atrophy of lower limbs in hemiplegic patients. Arch Phys Med Rehabil 78:13–18
Harridge SD, Bottinelli R, Canepari M, Pellegrino MA, Reggiani C, Esbjornsson M, Saltin B (1996) Whole-muscle and single-fibre contractile properties and myosin heavy chain isoforms in humans. Pflugers Arch 432:913–920
Hermens HJ, Freriks B, Disselhorst-Klug C, Rau G (2000) Develop-ment of recommendations for SEMG sensors and sensor placement procedures. J Electromyogr Kinesiol 10:361–374 Horstman AM, Beltman MJ, Gerrits KH, Koppe P, Janssen TW, Elich P,
de Haan A (2008) Intrinsic muscle strength and voluntary activation of both lower limbs and functional performance after stroke. Clin Physiol Funct Imaging 28:251–261
Horstman A, Gerrits K, Beltman M, Janssen T, Konijnenbelt M, de Haan A (2009) Muscle function of knee extensors and flexors after stroke is selectively impaired at shorter muscle lengths. J Rehabil Med 41:317–321
Horstman AM, Gerrits KH, Beltman MJ, Koppe PA, Janssen TW, de Haan A (2010) Intrinsic properties of the knee extensor muscles after subacute stroke. Arch Phys Med Rehabil 91:123–128
Keenan KG, Farina D, Maluf KS, Merletti R, Enoka RM (2005) Influence of amplitude cancellation on the simulated surface electromyogram. J Appl Physiol 98:120–131
Klass M, Baudry S, Duchateau J (2008) Age-related decline in rate of torque development is accompanied by lower maximal motor unit discharge frequency during fast contractions. J Appl Physiol 104:739–746
Klein CS, Brooks D, Richardson D, Mcllroy WE, Bayley MT (2010) Voluntary activation failure contributes more to plantar flexor weakness than antagonist coactivation and muscle atrophy in chronic stroke survivors. J Appl Physiol 109:1337–1346
Maffiuletti NA, Lepers R (2003) Quadriceps femoris torque and EMG activity in seated versus supine position. Med Sci Sports Exerc 35:1511–1516
McCrea PH, Eng JJ, Hodgson AJ (2003) Time and magnitude of torque generation is impaired in both arms following stroke. Muscle Nerve 28:46–53
Nadau S, Gravel D, Arsenault AB, Bourbonnais D (1999) Plantarfl-exor weakness as a limiting factor of gait speed in stroke subjects and the compensating role of hip flexors. Clin Biomech (Bristol, Avon) 14:125–135
Newham DJ, Hsiao SF (2001) Knee muscle isometric strength, voluntary activation and antagonist co-contraction in the first six months after stroke. Disabil Rehabil 23:379–386
Pierrot-Deseilligny E, Burke D (2005) The circuitry of the human spinal cord: its role in motor control and movement disorders. Cambridge University Press, New York
Saunders DH, Greig CA, Mead GE, Young A (2009) Physical fitness training for stroke patients. Cochrane Database Syst Rev 4:CD003316. doi:10.1002/14651858.CD003316.pub3
Slager UT, Hsu JD, Jordan C (1985) Histochemical and morphomet-ric changes in muscles of stroke patients. Clin Orthop Relat Res 199:159–168
Solstad GM, Fimland MS, Helgerud J, Iversen VM, Hoff J (2011) Test-retest reliability of V-wave responses in the soleus and gastrocnemius medialis. J Clin Neurophysiol doi:10.1097/WNP. 0b013e31821215cf
Strong G, Mathers C, Bonita R (2007) Preventing stroke: saving lives around the world. Lancet Neurol 6:182–187
Suetta C, Aagaard P, Rosted A, Jakobsen AK, Duus B, Kjaer M, Magnusson SP (2004) Training-induced changes in muscle CSA, muscle strength, EMG, and rate of force development in elderly subjects after long-term unilateral disuse. J Appl Physiol 97:1954–1961
Suetta C, Aagaard P, Magnusson SP, Andersen LL, Sipila S, Rosted A, Jakobsen AK, Duus B, Kjaer M (2007) Muscle size, neuromus-cular activation, and rapid force characteristics in elderly men and women: effects of unilateral long-term disuse due to hip-osteoar-thritis. J Appl Physiol 102:942–948
Upton AR, McComas AJ, Sica RE (1971) Potentiation of ‘‘late’’ responses evoked in muscles during effort. J Neurol Neurosurg Psychiatry 34:699–711