www.elsevier.com/locate/eja
Management alternatives for improved durum wheat
production under supplemental irrigation in Syria
Theib Oweis *, Mustafa Pala, John Ryan
Natural Resources Management Program, The International Center for Agricultural Research in the Dry Areas (ICARDA), PO Box 5466, Aleppo, Syria
Accepted 30 June 1999
Abstract
In the Mediterranean zone, efforts to optimize combinations of supplemental irrigation (SI ), improved varieties, nitrogen (N ) and sowing dates aim to improve and stabilize cereal yields and maintain quality, especially for durum wheat. Thus, a 4 year field study (1992/1993 to 1995/1996) on a deep clay soil in northern Syria assessed the impact of SI (rain-fed, 1/3, 2/3 and full SI ) combined with variable N application rates (0, 50, 100, 150 kg ha−1) and sowing date (early, normal, late) for four improved durum wheat varieties adapted to rain-fed and irrigated conditions. As rainfall and evapotranspiration varied over the 4 years, the amount of SI water required also varied. Yields varied with the season, and the main factors, except variety, were significant. Delaying sowing from November to January reduced yields and response to both SI and N. With irrigation, crop responses were generally significant up to 100 N ha−1, whereas the optimum response for rain-fed conditions occurred with 50 kg N ha−1. Limited SI (1/3) significantly increased yields, but almost maximum yields were obtained by 2/3 of full SI. Water- and N-use efficiencies were greatly increased by SI, with little variation among varieties. However, irrigation and delayed sowing decreased grain protein levels, which were partially compensated for by added N. A similar effect was observed for kernel vitreousness. Models developed from the response data can facilitate the potential transfer of these findings. Thus, in most growing seasons, minimum irrigation during the winter growing season, combined with appropriate fertilization, can enhance wheat output and yet maintain grain quality. © 1999 Elsevier Science B.V. All rights reserved.
Keywords:Mediterranean climate; Nitrogen; Rain-fed cereals; Sowing date; Supplemental irrigation; Yield sustainability
1. Introduction summers. Winters are milder along the coastal
areas and are colder inland, merging towards a
Agriculture in the West Asia–North Africa continental climate, and with increasing elevation.
( WANA) region is primarily based on dryland The annual rainfall is extremely variable, from
cereals integrated with livestock production, year to year and within seasons, and can range
mainly sheep (Cooper et al., 1987). The climate is from 50 to 1200 mm. However, most cropland is
mainly Mediterranean, with cool to cold winters, in the 200–600 mm range ( Kassam, 1981); indeed,
with rainfall from November to April and hot dry in Syria, it is mainly between 250 and
450 mm year−1. Both rainfall and temperature
dic-tate crop-growth duration and cropping systems,
* Corresponding author. Tel.:+963-21-213433;
which change in response to the variation in both
fax:+963-21-213490.
E-mail address:[email protected] (T. Oweis) elevation and rainfall. Rainfall is inversely related
to seasonal temperatures, which in turn influence improved water-use efficiency. With expansion in irrigation over the last years and water resources evapotranspiration (Harris, 1995). With the first
rain in October–November, evaporation and tem- becoming scarcer, sustainable and improved
pro-duction can only be maintained by improving peratures decrease; the January–February period,
with the lowest mean temperatures (<5°C ) and WUE.
After drought, N is the major constraint in
evaporative demand (<2 mm day−1), coincides
with peak rainfall. Frost is frequent, but snow is dryland cereal farming within the Mediterranean
area (Harmsen, 1984; Anderson, 1985; Ryan et al., rare, especially in lowland areas. In early spring,
evapotranspiration begins to exceed rainfall. The 1991; Mosseddaq and Smith, 1994). As fertilizer
N responses are directly related to rainfall under latter growth period is usually restricted by limited
moisture. dryland conditions in WANA (Ryan et al., 1991;
Campbell et al., 1993b; Pala et al., 1996), N use
Effective technology transfer to the region’s
farmers has to be based on a clear perception of should be correspondingly greater when SI is also
applied. Potential yield increases in any environ-the various constraints to crop production, leading
to integrated cropping system recommendations ment depend not only on water and N (Aggarwal
and Kalra, 1994) but also on cultivars (Anderson, that are consistent with socioeconomic conditions.
As with many countries of the world in economic 1985) and sowing time (O’Leary et al., 1985).
Under Mediterranean climatic conditions, delaying transition, any future production increases in Syria
and WANA in general have to come from sowing after the optimum time, November,
which coincides with the onset of seasonal rains, increased yields, with little opportunities for
expan-sion of cropland. The sparse and precarious consistently reduces yields (Photiades and
Hadjichristodoulou, 1984; Stapper and Harris, resources of the region, particularly water (Oweis,
1997), make this a daunting task. 1989; Harris et al., 1991). In Syria, potential wheat
yields are estimated to decline by 4.2% for each
The foremost concern in arid and semi-arid
areas is water availability and how to optimize its week of delay after early November sowing
(Stapper and Harris, 1989). use. The dominant constraint on wheat production
is limited water, especially where a high evapora- Various studies of winter wheat in
Mediterranean areas have highlighted the indivi-tive demand coincides with low rainfall (Smith
and Harris, 1981; Campbell et al., 1993a). Though dual importance of water, N, sowing dates, and
cultivars. The emerging significance of SI in Syria crop yields under dryland conditions in WANA
are related to seasonal rainfall, water-use efficiency and in the WANA region underlines the need to
integrate these factors. While yield is of prime ( WUE ) can be substantially improved by crop
management practices (Cooper et al., 1987) and concern in the food-deficit WANA region, quality
is also a growing concern ( Wrigley, 1994). In fertilizer use (Harmsen, 1984; Keatinge et al., 1985;
Ryan and Matar, 1992). Whereas, formerly, virtu- Syria, a minimum of 12% protein is required for
export of durum wheat. Similarly, a higher degree ally all cereal production was rain-fed, now up to
40%of the cereal-growing area is irrigated, primar- of grain vitreousness is a quality criterion — the
presence of ‘yellow berry’ is undesirable. Both ily from surface waters, but increasingly from
shallow groundwater. In Syria, irrigation accounts protein and vitreousness are more influenced by
the environment than genetics (Nachit et al.,
for 70% of cereal production. Farmers generally
use small basins (50–100 m2) to apply SI to wheat. 1992). Consequently, management practices such
as fertilization and irrigation can significantly This method, although labor-intensive, requires
little or no capital investment. In areas where influence quality traits, depending on the variety
(Bulman and Smith, 1993; Webster and Jackson, summer crops are irrigated, farmers have begun
investing in sprinkler systems, which they also use 1993; Ryan et al., 1997b).
Since its inception in 1977, ICARDA has oper-for SI of winter crops. The introduction of
supple-mental irrigation (SI ) to winter-grown cereals in ated a number of agricultural research stations
average rainfall gradient of about 200–600 mm then, little effective rainfall occurred until 37 mm rainfall in May made a substantial contribution to
year−1. Wide inter-annual and inter-season rainfall
variation is characteristic of the region. In such crop yield. The rainfall in the second season was
slightly above average, but was poorly distributed, conditions, SI can have a large impact on yield in
normal and dry years, but little or no irrigation is with most of the rainfall in January–February and
little thereafter; a heat wave occurred in April and required in favorable years. Our objective was to
identify, in a 4 year field trial (1992–1996), at May. The rainfall in the third year was about
average, and was well distributed. The fourth year ICARDA’s main station, Tel Hadya, near Aleppo
in northern Syria (mean annual rainfall, 330 mm), was above average and well distributed, but had
higher temperatures during the grain-filling period.
the most effective combinations of SI, N fertilizer,
and sowing dates for enhanced yield and quality
of four improved durum wheat varieties. 2.2. Trial treatments and design
The treatments included:
1. three sowing dates, which varied depending on
2. Materials and methods
the year (early, November; normal, mid-December; and late, mid-January);
2.1. Soil and weather
2. four SI rates; rain-fed (no irrigation), full SI
(irrigation to avoid moisture stress), and 1/3,
The soil at Tel Hadya station (Ryan et al.,
1997a) is generally deep (over 1 m) and has a and 2/3 of full SI.
3. Four N application rates (0, 50, 100, and heavy clay texture (fine clay, montmorillonitic,
thermic Calcixerollic Xerochrept). The relevant 150 kg N ha−1); and
4. Four high-yielding, widely adapted durum
properties are as follows: pH 8.0; CaCO
3,
240 g kg−1; organic matter, 8.4 g kg−1; cation wheat varieties:
Cham1: resistant to yellow rust;
exchange capacity, 52 cmol kg−1at the beginning
of the trial, extractable potassium by 1 N ammo- Lahn: irrigated areas, cold tolerant;
Cham 3: drought and heat tolerant, high grain
nium acetate, pH 7.0 (546 mg kg−1) well above the
critical level, and low extractable phosphorus quality for semolina products;
Omrabi 5: high drought tolerance, diverse values (0.5 M NaHCO
3,<5 mg kg−1) and mineral
N (NO
3MN+NH4MN ) to a depth of 60 cm environments.
A split-split-split plot design, with three repli-(<10 mg kg−1). This clay soil has good structure
and is well drained, with an infiltration rate of cates, was used. Sowing dates were represented by
the main plots, varieties by the sub-plots, water
11 mm h−1. The mean soil moisture in the top
100 cm soil at the field capacity (−33 kPa) and at rates by the sub plots, and the N rates by
sub-sub-sub plots (2.25×6.3 m plot size). The site
the permanent wilting point (−1500 kPa) is about
48 and 24% by volume, respectively. Throughout alternated each year between two adjacent blocks
following the cereal/legume or safflower
the growing season, the profile undergoes recharge
from November to March and discharge from (Carthamus tinctorius) rotation system practised at
Tel Hadya. Thus, in years 1 and 2, the trial then until June (Harris, 1995). Only in
above-normal rainfall years is the profile wetted below followed chickpea (Cicer arietinum L.) and
safflower in years 3 and 4.
1.5 m.
Rainfall was variable during the four growing A trickle-irrigation system was designed and
installed to provide a uniform soil moisture pattern
seasons in total amount, i.e. 281 mm (1992/1993),
358 mm (1993/1994), 330 mm (1994/1995) and within each SI treatment. Pressure-compensating
emitters, with an approximate discharge rate of
395 mm (1995/1996) and in distribution ( Table 1).
The first season showed below-average rainfall (i.e. 2 l h−1, were installed along polyethylene lines of
20 mm diameter. The spacing between laterals was 330 mm). Following the first rain on 15 November,
Table 1
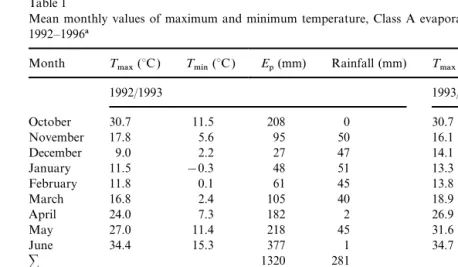
Mean monthly values of maximum and minimum temperature, Class A evaporation, and rainfall at Tel Hadya in northern Syria, 1992–1996a
Month T
max(°C ) Tmin(°C ) Ep(mm) Rainfall (mm) Tmax(°C ) Tmin(°C ) EP(mm) Rainfall (mm)
1992/1993 1993/1994
October 30.7 11.5 208 0 30.7 12.8 214 18
November 17.8 5.6 95 50 16.1 4.1 71 42
December 9.0 2.2 27 47 14.1 4.9 40 16
January 11.5 −0.3 48 51 13.3 3.7 37 109
February 11.8 0.1 61 45 13.8 2.8 64 137
March 16.8 2.4 105 40 18.9 4.0 101 12
April 24.0 7.3 182 2 26.9 8.3 197 11
May 27.0 11.4 218 45 31.6 11.8 298 13
June 34.4 15.3 377 1 34.7 17.7 432 0
∑ 1320 281 1453 358
1994/1995 1995/1996
October 30.3 14.8 187 12 28.3 10.5 193 9
November 17.8 7.5 75 109 17.2 4.6 66 59
December 9.6 1.6 38 45 12.4 2.0 36 31
January 12.2 3.7 35 41 11.2 3.3 39 74
February 16.5 2.7 56 18 14.4 4.3 59 47
March 18.9 3.4 98 33 15.8 6.6 66 143
April 23.1 6.9 158 44 20.6 6.7 117 27
May 31.6 11.5 275 27 32.2 12.3 278 5
June 35.7 18.6 406 1 35.6 17.6 385 0
∑ 1328 330 1239 395
aT
max=maximum temperature;Tmin=minimum temperature;Ep=Class-A pan evapotranspiration.
52.5 cm, corresponding to the irrigated treatments was planted in 17.5 cm rows at a rate of
approxi-mately 300 seeds m−2, with N applied half at
full SI, 2/3 and 1/3 SI, respectively. The system of
irrigation used in this study would not be economi- sowing and half top-dressed at the early tillering
stage. As P was not a variable, a blanket applica-cal for wheat at the farmer’s land, but because of
difficulties in obtaining good data with sprinklers tion of 30 kg P ha−1was applied to all plots prior
to sowing. (the area is windy), this system was used as a
research tool to apply water accurately and evenly. Soil moisture was measured weekly, before and
after each water application, and after each rain, Various emitter and lateral spacing together with
a range of irrigation scheduling options were exam- using neutron probes. Access tubes were inserted
in each of the sub-sub-sub plots of one replicate ined prior to this experiment to select the design
parameters that achieve a uniform distribution of up to 1.8 m depth (depending on soil depth) for
one variety (Omrabi 5). Water was applied to all water similar to that of a sprinkler system
(Oweis, 1992). treatments of the same date of sowing at the same
time, i.e. when the root zone of the full SI treatment The source of the irrigation water was
good-quality groundwater ( EC 0.62 dS m−1,SAR, 1.1). with 100 kg N ha−1 had lost 50% of its available
moisture (1/2 the difference between field capacity
The cation concentrations were Ca++, 3.4;
Mg++, 1.7; Na+, 1.7; and K+, 0.06 meq l−1. The and wilting point). The amount of water, which
was then given, was calculated to restore
root-corresponding anions were: CO−−3 , trace; HCO−3,
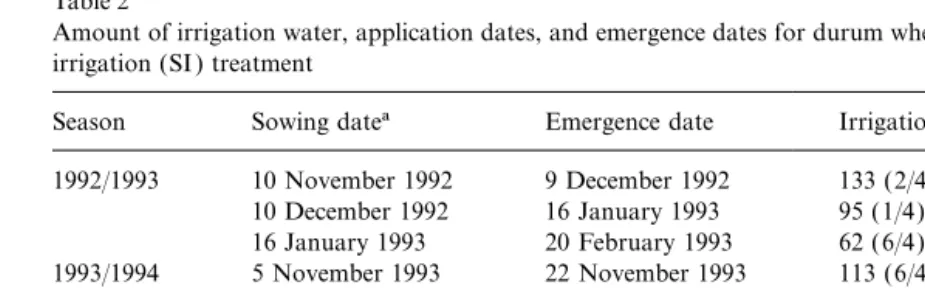
Table 2
Amount of irrigation water, application dates, and emergence dates for durum wheat sown at different times in the full supplemental irrigation (SI ) treatment
Season Sowing datea Emergence date Irrigation amount (mm)band date Total
1992/1993 10 November 1992 9 December 1992 133 (2/4); 146 (15/4); 118 (23/4);151 (21/5) 548 aThe dates represent early, normal, and late sowing times.
bGross amount of SI water (mm) applied to the full SI treatment; the other irrigation rates were 2/3 and 1/3 of the amount applied to full SI (application dates in parentheses).
treatments automatically received fixed propor- 3. Results
tions (1/3 and 2/3) of that amount. The root zone
depth was estimated before each irrigation based 3.1. Grain and straw yields
on the depletion pattern of the soil profile. The
amounts of irrigation water and application dates All major factors, except variety, had significant
effects on grain and straw yields. Overall rain-fed
are given in Table 2.
During the growing season, measurements grain yield varied with the year (2.1–3.6 t ha−1),
with no consistent relationship with seasonal rain-included: date of emergence (Table 2), plant and
head numbers per m2, and green leaf area and fall. Although there were differences between
vari-eties, three of them (Cham 1, Cham 3, and Omrabi biomass at stem elongation, heading and anthesis.
However, only grain and straw yields, grain protein, 5) were similar, giving slightly higher yields than
Lahn. However, the overall effects of SI and N
and vitreousness are reported here. The yield and
harvest index were sampled in 7.9 and 0.3 m2, were dominant. With increasing water availability,
from rain-fed to 1/3, 2/3, and full SI levels, the
respectively. Grain protein was calculated by
multiplying the % N values from the Kjeldahl grain yields were 2.6, 3.8, 4.6 and 4.8 t ha−1,
respectively, whereas the straw yields were 4.9, 5.9, digestion by 5.7 (AACC, 1983), whereas
virtuous-ness was visually assessed based on the presence of 6.7, and 7.2 t ha−1, respectively. Nitrogen also had
a consistent positive effect on yield. With the 0,
opaque blotches or ‘yellow berry’ in the grain.
Analysis of variance was used to assess statistical 50, 100, and 150 kg ha−1rates, the yields were 2.8,
3.9, 4.4, and 4.6 t ha−1, respectively, with
corre-significance using BLOCK STRUCTURE,
TREATMENT STRUCTURE and ANOVA com- sponding straw values of 4.3, 5.9, 6.9, and 7.
5 t ha−1. mands set in GENSTAT 5 program. Production
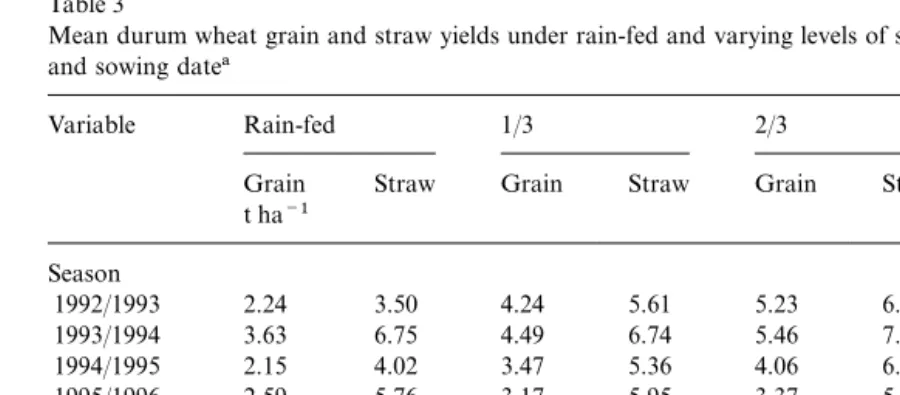
functions and their corresponding predicted The overall interaction between rainfall and
irrigation water level with season, variety and response surfaces were developed using variety, rate
of N, rate of SI, and date of sowing, and their sowing date are shown in Table 3 for grain and
straw yield. Despite differences in rainfall, the
interactions, which were seen to account for the
high variability. Further, the model was kept simple response to SI was similar for the first 2 years;
however, its effect decreased in subsequent years,
Table 3
Mean durum wheat grain and straw yields under rain-fed and varying levels of supplemental irrigation in relation to season, variety and sowing datea
Variable Rain-fed 1/3 2/3 FullSI Mean
Grain Straw Grain Straw Grain Straw Grain Straw Grain Straw t ha−1
Lahn 2.37 4.65 3.66 6.10 4.19 6.76 4.45 7.21 3.67 6.18
Cham 3 2.69 5.13 3.80 5.88 4.53 6.93 5.00 7.55 4.01 6.37
Omrabi 5 2.91 4.85 4.00 5.58 4.60 6.40 4.75 6.84 4.07 5.92
Sowing date
November 2.72 5.32 4.26 6.96 4.76 7.61 4.98 7.86 4.18 6.94
December 2.75 4.98 3.69 5.56 4.34 6.30 4.65 6.86 3.85 5.93
January 2.49 4.35 3.57 5.23 4.27 6.17 4.71 6.92 3.76 5.67
aAll interactions with irrigation are significant (P≤0.001), except for variety. Standard error of means for grain: water×year= 0.52; water×variety=0.071; water×sowing date=0.08.
possibly due to heat stress during the grain-filling response to N was maximum at 100 kg ha−1,
whereas at the two higher SI levels (2/3 and Full
period. Reflecting a significant interaction between
water levels and sowing time, the responses to SI ), responses continued up to 150 kg N ha−1. In
contrast to seasonal and water effects on N
irrigation were highest with early sowing, with
little difference between the later sowing dates. response, there was no effect of variety. Thus, the
four varieties responded in the same way to added However, the pattern of response to SI levels was
generally similar for the four varieties. As the N. A delay in sowing date from November to
December and January consistently reduced
responses for straw yields paralleled these of grain
yield, only the latter data are subsequently responses to N.
The significant parameters and significant inter-presented.
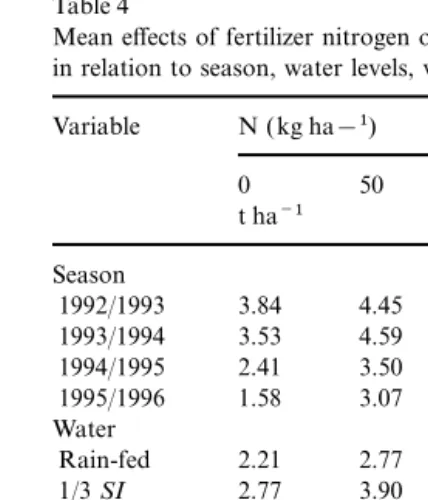
The interactions involving applied N and the actions affecting the yield components of durum
wheat were used in a regression model to develop other management inputs are presented in Table 4.
Again, a strong seasonal effect was evident. The the production functions of grain, total dry matter,
and straw yields. The resulting general production data illustrate that the responses to N are related
to yields of the unfertilized control and the factors function and regression coefficients for all the
varieties and yield components are presented in that influence growth. On average, the addition
of 50 kg N ha−1 increased grain yield by Table 5. The interaction of variety with
precipita-tion and with N was significant and accounted for
1.1 t ha−1 compared to the control (2.8 vs. 3.9).
The responses were positive but relatively lower a high percentage of variation to be included in
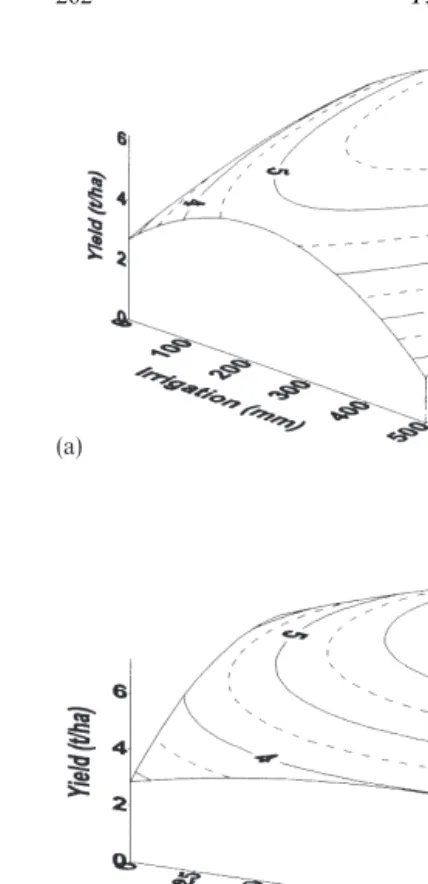
the model. Examples of the resulted response
for each additional 50 kg N, i.e. +0.5 t ha−1 for
100 kg N ha−1 and +0.2 t ha−1 for the surfaces that could be developed are depicted in
Fig. 1 for the Cham 3 variety. These surfaces can
100 kg N ha−1and 150 kg N levels. The responses
to N were strongly modified by irrigation water provide the required information on production
potential under any combination of factors levels. For rain-fed conditions, the response was
Table 4 Table 5
Estimates of regression coefficient for durum wheat production Mean effects of fertilizer nitrogen on durum wheat grain yield
in relation to season, water levels, variety and sowing datea functionsa
Variable N (kg ha−1) Variable Grain Straw Total dry
matter
0 50 100 150 Mean
t ha−1 Intercept (Cham1) −0.995 −1.825 −1.63
Intercept (Lahn) −0.720 −1.796 −2.00
Season Intercept (Cham3) −0.980 −1.594 −1.45
1992/1993 3.84 4.45 4.64 4.73 4.42 Intercept (Omrabi5) 0.818 −2.354 −2.20 1993/1994 3.53 4.59 5.07 5.38 4.64 PR(Cham 1) 0.01123 0.01992 0.02863 1994/1995 2.41 3.50 4.02 4.15 3.52 PR(Lahn) 0.00910 0.01992 0.02863 1995/1996 1.58 3.07 3.83 4.14 3.16 PR(Cham3) 0.01115 0.01992 0.02863
Water PR(Omrabi5) 0.00566 0.01992 0.02863
Rain-fed 2.21 2.77 2.89 2.76 2.64 N(Cham 1) −0.00553 −0.01051 −0.0234 1/3SI 2.77 3.90 4.32 4.36 3.84 N(Lahn) −0.00553 −0.01113 −0.0241 2/3 3.10 4.31 4.96 5.44 4.45 N(Cham 3) −0.00553 −0.01112 −0.0235 FullSI 3.28 4.63 5.37 5.83 4.78 N(Omrabi 5) −0.00553 −0.00765 −0.0194
Variety SI 0.03003 0.03359 0.05715
Cham1 2.90 4.02 4.44 4.62 4.00 D −0.2571 −0.2702 −0.5494
Lahn 2.65 3.58 4.15 4.28 3.67 PR×SI −0.00007 −0.00009 −0.00015
Cham3 3.89 3.97 4.49 4.69 4.01 PR×N 0.000066 0.00011 0.00017
Omrabi 5 2.91 4.04 4.50 4.80 4.06 PR×D 0.00078 0.00076 0.00158
Sowing date SI×N 0.000083 0.00009 0.0002
November 2.88 4.74 4.98 4.12 4.18 N×D −0.000067 −0.00013 0.0000
December 2.72 4.28 4.61 3.82 3.86 SI2 −0.00001 0.00000 0.0000
January 2.92 4.14 4.21 3.77 3.76 N2 −0.00007 −0.00009 −0.00012
D2 0.00372 0.00408 0.00804
aAll interactions with N are significant (P≤0.001), except
for N×variety. Standard error of means N×water=0.051; aPR=total annual precipitation (mm); SI=supplemental N×variety=0.048; N×sowing date=0.065. irrigation amount (mm);N=applied nitrogen (kg ha−1) and D=delay in sowing after 1 November (days). Variance accounted for: grain 81.4%, dry matter 82.2%, and straw 80.1% Y=a
0+a1(PR)+a2(SI)+a3(N)+a4(D)+a5(PR×SI)+a6(PR× 3.2. Grain and straw protein
N)+a
7(PR×D)+a8(SI×N)+a9(N×D)+a10(SI2)+a11(N2)+ a
12(D2), whereYis yield in (t ha−1);a0is the intercept;a1to
The influence of all production and manage- a
12are the regression coefficients of the independent variables
ment factors on quality was just as pronounced as and the significant interactions involved.
for yield. While grain protein levels varied with the season, some overall trends were evident. With
increasing N levels, grain protein concentration As N has a dominant effect on cereal protein
levels, the interaction of N and the other factors
rose from 9.6% with no added N to 11.7% with
150 kg N ha−1. Similarly, delayed sowing, on are presented ( Table 6). The decrease in grain
protein caused by irrigation was modified by the average, increased protein from 9.9 to 11.3%,
whereas the addition of irrigation water decreased N application rate. However, the N required for
maximum yield did not compensate for the
reduc-protein from 11.7% under rain-fed conditions to
10% with 2/3 and fullSI. The four varieties were tion due to irrigation compared to rain-fed
condi-tions, i.e. and 13.6 vs. 10.8% grain protein at the
generally similar in terms of protein content,
rang-ing from 10.4 to 10.7%. The protein content in highest N level. Straw under fertilized rain-fed
conditions contained almost twice the protein straw followed similar trends as in grain. For
example, irrigation reduced straw protein from 2.8 content compared to irrigated conditions with the
same applied N level. While the interaction
to 1.8%, whereas 150 kg N ha−1 increased values
from 1.7 to 2.6%, a substantial enhancement in between N and varieties was significant, differences
sowing date were accentuated by added N. Late sowing, relative to early sowing, increased the
grain protein from 10.9 to 12.8%and straw protein
from 2.4 to 2.9%at the highest N level.
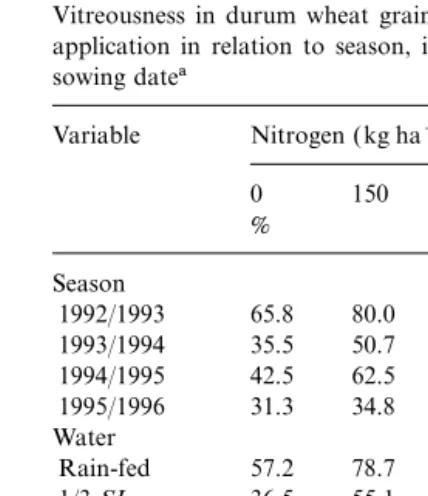
3.3. Grain vitreousness
The variety and the other management factors
(Table 7) significantly affected vitreousness. The
overall mean percentage values were 67 (Cham 1), 72 (Lahn), 63 (Cham 3), and 52 (Omrabi 5).
Rain-fed values were 79%, decreasing to 62% (1/3 SI )
and 57% (2/3 SI ), with no further decrease.
Nitrogen consistently increased vitreousness (or reduced ‘yellow berry’) from 44 to 83%; the delay in sowing also increased vitreousness from 50 to 78%. Given the magnitude of these influences, it was not surprising that the interaction of N and the other factors were also significant.
The positive effect of N on percentage
vitreous-ness varied with irrigation levels ( Table 7). Under rain-fed conditions, N raised values as high as 92%
from 57% under unfertilized conditions, whereas
with irrigation, the maximum effect was 75%.
Under any level of N, vitreousness varied for the
varieties, with differences being most pronounced
under unfertilized conditions; in all cases, Omrabi 5 had the lowest values. The interaction with sowing date and N was similarly variable; the
differences were large (33–58%) under unfertilized
conditions, but diminished as the N application rate increased.
3.4. Thousand-kernel weight
Though of lesser importance than either protein or vitreousness, the 1000-kernel weight ( TKW ) was also influenced by variety and the main factors,
(a)
(b)
(c)
Fig. 1. Response surfaces of durum wheat (Cham 3) grain yield but the effects were less consistent and much
in relation to rainfall, supplemental irrigation, nitrogen and smaller (Table 8). Overall, Cham 1 had the lowest sowing date: (a) 100 kg N ha−1, 350 mm rainfall and varying TKW at 43 and Lahn the highest at 52. There irrigation and sowing date; (b) early sowing, 350 mm rainfall
were large differences between rain-fed (41) and
and varying irrigation and nitrogen rates; (c) early sowing, no
irrigated conditions (47–49), with essentially no
irrigation and varying rainfall and nitrogen rates.
difference between irrigation levels. In marked
contrast to other parameters, N had no effect on
the mean TKW. However, the interactions between rates, Omrabi 5 tended to have a lower grain and
straw protein than the other three varieties. For N and the other factors were significant. Added N
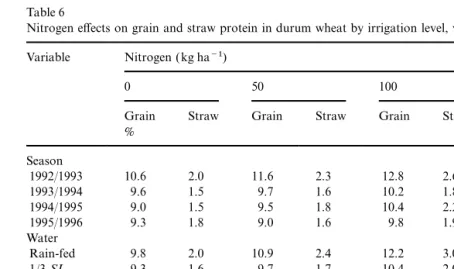
Table 6
Nitrogen effects on grain and straw protein in durum wheat by irrigation level, variety and planting datea
Variable Nitrogen (kg ha−1)
0 50 100 150 Mean
Grain Straw Grain Straw Grain Straw Grain Straw Grain Straw %
Season
1992/1993 10.6 2.0 11.6 2.3 12.8 2.6 13.6 3.2 12.1 2.5
1993/1994 9.6 1.5 9.7 1.6 10.2 1.8 11.0 2.1 10.1 1.8
1994/1995 9.0 1.5 9.5 1.8 10.4 2.2 11.1 2.8 10.0 2.1
1995/1996 9.3 1.8 9.0 1.6 9.8 1.9 11.2 2.3 9.3 1.9
Water
Rain-fed 9.8 2.0 10.9 2.4 12.2 3.0 13.6 3.8 11.7 2.8
1/3SI 9.3 1.6 9.7 1.7 10.4 2.0 11.6 2.5 10.3 1.9
2/3 0.5 1.6 9.6 1.6 10.1 1.8 10.9 2.2 10.0 1.8
FullSI 9.8 1.7 9.5 1.6 10.1 1.8 10.8 2.1 10.1 1.8
Variety
Cham1 9.7 1.7 10.1 1.9 11.0 2.2 12.1 2.6 10.7 2.1
Lahn 9.6 1.8 10.1 1.9 10.8 2.3 11.8 2.9 10.5 2.2
Cham3 9.6 1.7 9.8 1.8 10.7 2.2 11.7 2.9 10.5 2.2
Omrabi 5 9.6 1.6 9.8 1.7 10.6 1.9 11.4 2.2 10.4 1.9
Sowing date
November 9.3 1.6 9.5 1.7 10.1 2.0 10.9 2.4 10.0 1.9
December 9.5 1.7 9.7 1.8 10.5 2.1 11.5 2.5 10.3 2.0
January 10.1 1.8 10.6 2.0 ‘11.7 2.3 12.8 2.9 11.3 2.3
aAll interactions are significant (P≤0.001). Standard error of means, grain: N×water=0.089; N×variety=0.097; N×sowing date=0.086. Standard error of means, straw: N×water=0.051; N×variety=0.052; N×sowing date=0.049.
wheat, but slightly increased the TKW with irri- within 3–15% of that achieved by full SI. Such
yield increases clearly show the potential for water
gated conditions. However, the differences between
varieties were fairly consistent with N application savings with proper conjunctive use of irrigation
and rainfall in rain-fed agricultural systems. The rates, with Lahn being highest in all cases. Added
N had no effect on TKW with varying sowing strategy of applying restricted amounts of water
based on the amount and distribution of rainfall dates.
in addition to the incremental effect of water on
crop yield is the essence of the SI concept. The mean rainfall WUE was about 1.1 kg grain
4. Discussion
and 3.2 kg of total dry matter per m3of rainwater.
Although no significant differences were found
The most important implication from this study
centers on the possible savings in irrigation water between sowing dates, WUE ranged for N levels
from 0.89, 1.06, 1.16 and 1.08 for 0, 50, 100, and without causing any significant loss in potential
yield. On average, applying 1/3 of full crop SI 150 kg N ha−1, respectively. The combined mean
WUE of rainfall and SI water in producing grain requirements (about 100 mm of irrigation water in
an average year) achieved over 60%of the potential yield was 1.15, 1.06 and 0.96 kg m−3 at the 1/3,
2/3 and full SI levels, respectively. However, when
increase in yield with full SI. By applying 2/3
(about 200 mm) of the irrigation requirements, separating the contribution of irrigation water to
increased crop yield, the mean WUE of SI water
about 90% of the increase may be achieved. The
Table 7 Table 8
Thousand-kernel-weight of durum wheat grain as influenced by Vitreousness in durum wheat grain as influenced by nitrogen
application in relation to season, irrigation level, variety and nitrogen application in relation to season, irrigation level, vari-ety and sowing datea
sowing datea
Variable Nitrogen (kg ha−1) Variable Nitrogen (kg ha−1)
0 150 100 150 Mean 0 50 100 150 Mean
Rain-fed 57.2 78.7 87.9 92.1 79.0 Rain-fed 42.7 42.4 41.1 39.6 41.5 1/3SI 46.8 48.3 48.1 46.5 47.4 1/3SI 36.5 55.1 72.1 85.2 62.2
2/3SI 38.9 47.5 62.8 77.9 56.8 2/3SI 48.7 50.3 49.8 48.9 49.4 FullSI 47.8 50.1 49.9 49.7 49.4 FullSI 43.5 46.6 60.1 74.9 56.5
Variety Variety
Cham1 43.7 44.3 43.4 42.4 43.5 Cham1 49.6 59.3 74.7 85.3 67.3
Lahn 51.4 67.6 80.5 87.6 71.8 Lahn 51.2 53.2 52.7 51.9 52.3
Cham3 46.7 47.6 47.1 45.6 46.8 Cham3 45.6 56.4 58.9 81.2 63.1
Omrabi 5 29.5 44.6 59.5 76.1 52.4 Omrabi 5 44.4 45.9 45.6 44.9 45.2 Sowing date
Sowing dates
November 32.8 39.6 56.1 72.2 50.2 November 46.8 48.5 47.8 46.2 47.3 December 48.1 49.6 49.3 48.6 48.9 December 41.8 56.7 69.7 82.5 62.7
January 57.5 74.6 86.9 92.9 78.0 January 44.7 45.3 44.6 43.8 44.6
aAll interactions with N are significant (P≤0.001), except aAll interactions with N are significant (P≤0.001), except for N×water. Standard error of means N×water=1.41; for N×water. Standard error of means N×water=1.41;
N×variety=1.65; N×sowing date=1.47. N×variety=1.65; N×sowing date=1.47.
increasing the area under supplemental irrigation and full SI levels, respectively. A substantially
higher WUE (up to 2.72 kg m−3) was obtained at and/or to the sustainability of the limited water
resources in the area. optimal SI, N and date of sowing. Thus, based on
water availability, a relatively small amount of The other factors described here are significant
for crop production when seen in the context of water could be applied at a few strategic times and
achieve substantial increases in yield and in WUE. SI. The crop-yield increases with applied N are
expected given the long-established relationship In contrast to a companion study of bread wheat
varieties under SI (Oweis et al., 1998), there were between N and soil moisture (Ramig and Rhoades,
1962). The data from this study suggest that under
no marked varietal differences for these durum
wheat varieties. Thus, whether in fact the farmer such deficit-irrigation conditions, the maximum
N efficiency would be achieved by using
would opt for 2/3 or more of the water given with
full SI depends on water availability, irrigation 50–100 kg N ha−1combined with 1/3 to 2/3 of full
irrigation. The models in Fig. 1 show that, given costs, and grain price. In a 5 year farmer-managed
SI demonstration in northern Syria, farmers any variables, the influence on yield can be
pre-dicted. Clearly, the maximum expression of these
obtained on average 75–85%(depending on annual
rainfall amount and distribution) of the maximum parameters is only possible when high-yield
poten-tial cultivars are used; the cultivars used here have
yield by applying only 50%of the amount of water
required for full SI (unpublished work by such traits and also incorporate disease resistance
The final management parameter considered, found that an increase in N application, from 0
to 90 kg ha−1 reduced the incidence of ‘yellow
sowing date, is more difficult to control under
rain-fed conditions, as it is dependent upon the berry’ from 31.9 to 9.5%, thus increasing grain
vitreousness. Mahdi et al. (1996) has recently onset of the precarious early-season rainfall. Where
rainfall is poor, farmers have little option but to shown how environmentally sensitive this quality
trait is, being dominant in one year and completely delay sowing until as late as January (Photiades
and Hadjichristodoulou, 1984). However, where absent in the next. The genetics×environment
interaction analysis of durum wheat of Nachit irrigation water is available, adequate germination
and emergence can be ensured with a small, i.e. et al. (1992), which indicated that TKW was more
genetically controlled, was borne out in this study. 30 mm, irrigation after sowing. In order to obtain
the maximum return from irrigation water and Allowing for the fact that the optimum date of
sowing is well known to farmers, and whether they fertilizer, the earliest possible sowing should be
sought. However, there are scheduling and logistic adhere to it is dependent on their circumstances,
the only feasible strategy for improving durum considerations. In large fields, spreading the
sowing time between November to January would wheat yields of acceptable quality is the judicial
use of SI and N, the latter being able to counteract
allow different portions of the field to have the
peak water requirements at different times, the protein-diluting effects of the former. This
study highlights the incompatibility that may exist although at a much narrower interval, it would
reduce the size and the discharge of the irrigation between quantity and quality and the need for a
greater collaboration between breeders, agrono-system and, consequently, the overall costs of SI.
The possible reduction in yield that may be caused mists and cereal technologists.
by delaying sowing may be easily overcome by better economics.
Of the many quality traits commonly measured Acknowledgements
on durum wheat grain, protein content and
vitre-ousness (or the absence of ‘yellow berry’), are We thank Dr M. Nachit, durum wheat breeder
mainly influenced by management (Nachit et al., for varietal selection and assistance, and Dr M.
1992). Thus, grain protein can be enhanced by the Singh for statistical assistance. Financial support
amount and manner in which N is applied (Bulman from BMZ through the ICARDA restricted core
and Smith, 1993; Webster and Jackson, 1993) and, program on ‘Water Management in WANA’ is
although irrigation decreases protein (Nachit et al., acknowledged.
1992), it can be increased by delayed sowing
(Anderson, 1985) — all reflecting a dilution effect
of N in the grain yield. These trends were shown References
in this study, the most significant being that
irriga-tion alone decreased protein content while increas- AACC, 1983. Approved Methods of the AACC Method 46-12.
ing yield, and the depression was compensated for The American Association of Cereal Chemists, St Paul, MN.
Aggarwal, P.K., Kalra, N., 1994. Analyzing the limitations set
by additional N over yield requirements. Thus,
by climatic factors genotype and water and nitrogen
avail-adequate N fertilization was needed to ensure
ability on productivity of wheat. II. Climatically potential
durum wheat grain of an acceptable protein
yields and management strategies. Field Crops Res. 38,
content, i.e. above 12%. While not perceived as 93–103.
being as important as grain protein, the enhance- Anderson, W.K., 1985. Differences in response of winter cereal
varieties to applied nitrogen in the field. I. Some factors
ment of straw protein is of special significance in
affecting the variability of responses between sites and
sea-Syria, and the WANA region in general, as animals
sons. Field Crops Res. 11, 363–367.
depend largely on stubble grazing.
Bulman, P., Smith, D.L., 1993. Grain protein response of spring
For grain vitreousness, increasing N levels had barley to high rates and post anthesis application of fertilizer
a major effect in combating against the negative nitrogen. Agron. J. 85, 1109–1113.
Campbell, C.A., Zentner, R.P., Selles, F., McConkey, B.G.,
Dyck, F.B., 1993a. Nitrogen management for spring wheat Oweis, T., 1997. Supplemental Irrigation: a Highly Efficient Water Use Practice. International Center for Agricultural grown annually on zero-tillage yields and nitrogen use effi
-ciency. Agron. J. 85, 107–114. Research in the Dry Areas, Aleppo, Syria. 16 pp
Oweis, T., Pala, M., Ryan, J., 1998. Stabilizing rainfed bread Campbell, C.A., Selles, F., Zentner, R.P., McConkey, B.G.,
1993b. Available water and nitrogen effects on yield compo- wheat yields with supplemental irrigation and nitrogen in a Mediterranean type climate. Agron. J. 90, 672–681. nents and grain nitrogen of zero-till spring wheat. Agron.
J. 85, 114–120. Pala, M., Matar, A., Mazid, A., 1996. Assessment of the effects of environmental factors on the response of wheat to fertil-Cooper, P.J.M., Gregory, P., Tully, D., Harris, H., 1987.
Improving water-use efficiency in the rainfed farming sys- izer in on-farm trials in a Mediterranean-type environment. Exp. Agric. 32, 339–349.
tems of West Asia and North Africa. Exp. Agric. 23,
113–158. Photiades, I., Hadjichristodoulou, A., 1984. Sowing date sowing depth seed rate and row spacing on wheat and barley under Harmsen, K., 1984. Nitrogen fertilizer use in rainfed
agricul-ture. Fert. Res. 5, 371–382. dryland conditions. Field Crops Res. 9, 151–162. Ramig, R.E., Rhoades, H.F., 1962. Inter-relationships of soil Harris, H.C., Cooper, P.J.M., Pala, M., 1991. Soil and crop
management for improved water-use efficiency in rainfed moisture level and nitrogen fertilization on winter wheat production. Agron. J. 54, 123–127.
areas. Proc. Int. Workshop Soil and Crop Management for
Water Use Efficiency in Rainfed Areas 15–19 May 1989, Ryan, J., Abdel Monem, M., Mergoum, M., El Gharous, M., 1991. Comparative triticale and barley responses to nitrogen Ankara, Turkey. International Center for Agricultural
Research in the Dry Areas, Aleppo, Syria. 352 pp under varying rainfall locations in Morocco’s dryland zone. Rachis 10 (2), 3–7.
Harris, H.C., 1995. Long-term trials on soil and crop
manage-ment at ICARDA. Adv. Soil Sci. 19, 447–469. Ryan, J., Matar, A., 1992. Fertilizer use efficiency under rainfed agriculture in West Asia and North Africa. International Kassam, A.H., 1981. Climate soil and land resources in West
Asia and North Africa. Plant Soil 58, 1–28. Center for Agricultural Research in the Dry Areas, Aleppo, Syria. 288 pp
Keatinge, J.D.H., Neate, P.J.H., Shepherd, K.D., 1985. The
role of fertilizer management in the development and expres- Ryan, J., Masri, S., Garabet, S., Habib, H., Diekmann, J., 1997a. Soils of ICARDA’s agricultural experimental sta-sion of crop drought stress in cereals under Mediterranean
environmental conditions. Exp. Agric. 21, 204–222. tions and sites climate classification physical-chemical prop-erties and land use Tech. Bull.. International Center for Mahdi, L., Bell, C.J., Ryan, J., 1996. Non-vitreousness or
‘yellow berry’ in durum wheat as affected by both depth and Agricultural Research in the Dry Areas, Aleppo, Syria. 119 pp
date of planting. Cereal Res. Commun. 24, 347–352.
Mosseddaq, F., Smith, D.H., 1994. Timing nitrogen application Ryan, J., Nsarellah, N., Mergoum, M., 1997b. Nitrogen fertil-ization of durum wheat cultivars in the rainfed area of to enhance spring wheat yields in a Mediterranean climate.
Agron. J. 86, 221–226. Morocco: biomass yield and quality considerations. Cereal Res. Commun. 25, 85–90.
Nachit, M.M., Sorrells, M.E., Zobel, R.W., Gauch, H.G.,
Fischer, R.A., Coffman, W.R., 1992. Association of envi- Smith, R.C.G., Harris, H., 1981. Environmental resources and restraints to agricultural production in a Mediterranean type ronmental variables with sites mean grain yield and
compo-nents of genotype-environment interaction in durum wheat environment. Plant Soil 58, 31–57.
Stapper, M., Harris, H.C., 1989. Assessing the productivity of II. J. Genet. Breed. 46, 369–372.
O’Leary, G.J., Connor, D.J., White, D.H., 1985. Effect of wheat genotypes in a Mediterranean climate using a crop simulation model. Field Crops Res. 20, 129–152.
sowing time on growth yield and water-use of rainfed wheat
in the Winmera. Vic. Aust. J. Agric. Res. 36, 187–196. Webster, J.R., Jackson, L.F., 1993. Management practices to reduce lodging and maximize grain yield and protein content Oweis, T., 1992. in: Evaluation of a drip system for
supplemen-tal irrigation trials of field crops Farm Resource Manage- of fall-sown irrigated hard spring. Field Crops Res. 33, 249–259.
ment Program ( FRMP) Annual Report. International