A PRELIMINARY STUDY OF WEB-BASED SPATIAL DATA ANALYSIS FEASIBILITY -
ONE OF POSSIBLE SOLUTIONS FOR DISASTER RESPONSE AND MANAGEMENT
Chang Cheak Lim a, *and Kuo-Chen Chang b a
Department of Geography, National Taiwan Normal University, 162, HePing East Road Section 1, Taipei, Taiwan -
698230281@ntnu.edu.tw
b
Department of Geography, National Taiwan Normal University,
162, HePing East Road Section 1, Taipei, Taiwan -
kcchang@ntnu.edu.tw
Youth Forum
KEY WORDS: Disaster Response and Management, Information Dissemination, Web-based Spatial Data Analysis, GIService, Knowledge Regularization, Land Cover Change Detection, Service Oriented Architecture
ABSTRACT:
As the massive tsunami that struck northeast Japan in 11 March 2011 after a magnitude 9.0 earthquake, it reveals that people are living in a critical environment. Although great improvement has been achieved in disaster prevention technologies, many natural disasters are still unpredictable. In addition to the prevention, rapid and effective responses to such disasters are also crucial. One of the key elements to success is the information dissemination of disaster, including both area and people living within that region. In the past decade, web-based spatial information system has become the major platform for both data sharing and displaying. What is coming next is the development of web-based spatial data analysis. A web-based service allows people to implement spatial analysis immediately as long as the internet connection among database and application servers is available. This useful and helpful spatial information is able to be accessed by all users around the world almost simultaneously. The main goal of this paper is to implement a spatial data analysis module based on service oriented architecture (SOA) concept. The main interest and focus of our study is based on the knowledge regularization processes of spatial data analysis to achieve the automated land cover change detection (LCCD) over internet. The proposed automated model is tested and verified by FORMOSAT-2 imageries taken in 2005 and in 2008. It will be published online for users around the world to maximize the add-on value and minimize the cost of the spatial data, moreover, to reveal the situations of disaster rapidly.
* Corresponding author. email: 698230281@ntnu.edu.tw
1. INTRODUCTION
1.1 The Uncertaincy of Natural Disasters
Since the beginning of the 21st century, human suffered numerous massive natural disasters at an increasing frequency. As we have seen in 2004, the South Asian tsunami that struck 11 countries and killing over 225,000 lives, in 2008, the Great Sichuan Earthquake that killing about 70,000 people and 18,000 are still left missing. In 2011, the massive tsunami that struck northeast Japan after a magnitude 9.0 earthquake took more than 15,000 lives. Although great improvement and technology has been invented in preventing and predicting such natural disaster, many natural disasters are still unpredictable. It is revealed that people are living in a critical environment and facing a more and more severe risk of natural disasters that may occur in the upcoming years. In addition to the prevention, rapid and effective responses to such disasters are also crucial. One of the key elements to success is providing the information dissemination of disaster, including both area and people living within that region.
From the past experiences, we know that people living away from their home and families are more likely to lose contact with the individual family when the disaster struck. The information provided at the time of the disaster at certain area is either limited or uncertain. The rescue teams itself has limited
information of the actual situation before their arrival at the scene. On the other hand, the scholars are always looking for available channels to get the real-time data, such as satellite imageries, of affected area. The lack of information available at such situation becomes a challenge for any concrete decision making and in problem solving efficiently.
1.2 The Development of Spatial Information Techniques
In the past decade, web-based spatial information system has become the major platform for both data sharing and displaying of information(Longley et al., 1999). Depending on the development of the related protocols standard, various web-based application of spatial information such as map navigation, etc. has been published over the internet through integrated with an interactive web-based platform. Thus, users are able to access the simple web-based spatial information. Actually, the development of web-based spatial information was introduced into three levels of web-based GIServices in the beginning of this century (Tsou, 2004), including data archive and search, information display and query, and spatial analysis functionality. However, the main focus of web-based spatial analysis study, at that time were based on vector-based spatial data.
The coming next of the web-based spatial information techniques is the development of web-based spatial data
analysis that integrate with both vector-based feature data and raster-based image data. A web-based service allows people to implement spatial analysis immediately as long as the internet connection among database and application servers is available. This useful and helpful spatial information is able to be accessed by all users around the world almost simultaneously.This trend of development conceptually brings the new interaction between end users and spatial information. People are able to access the useful spatial analysis service through the web-based GIService under a real-time interaction over internet. Such online mechanisms greatly improve the dissemination of disaster information and become one of possible solutions for disaster response and management.
1.3 ImplementationOverview
With the lack of information about the situation within the disaster area when such natural calamities occur, the information provided by optical remote sensing such as satellite images play a key role in responding disaster and managing the situation at the given time. However, how to rapidly and effectively disseminate those useful and helpful information to the public is the key focus in responding to the disaster successfully.
One of the possible solutions is through the internet. With the reasons given above, the goal of this study is trying to achieve the web-based spatial data analysis purpose by using problem solving approach. In order to understand the mechanisms that how the web-based GIService works in providing a possible solution in responding and managing the disaster. There are various ways to access web-based spatial data analysis service. However, in order to conform with the requirement of disaster response and management, those web-based system need to be more scalable that able to integrate with other resources. The main goal of this paper is to implements a spatial data analysis module based on service oriented architecture (SOA) concept. We focused our study scope on the knowledge regularization process of spatial data analysis to perform automated land cover change detection (LCCD) over internet. Imageries of FORMOSAT-2 from 2005 and 2008 were used to verify the change detection module. Finally, the automated analysis module will be published to the users connected to internet.
2. METHODOLOGY
There are various approaches in performing the spatial data analysis over internet. However, some are relatively unsuitable for disaster information dissemination. For most of the people without related knowledge of spatial information, the best way to make them understand the condition of the affected area rapidly is through an automated analysis service. It is unnecessary to publish the whole functions of the software to people relating to the disaster. Therefore, we deconstructed the whole implementation into two part, an automated analysis module and the deployment of web-based system. This is to simplify the operation of client side and make the spatial data analysis as a automated processing service.
The key factors to the success the spatial data analysis is through the use of internet, with both vector and raster type data based on service oriented architecture (SOA) concept in the regularization of related concept knowledge. The implementation of automated analysis module and the deployment of web-based system architecture. By the problem
solving approach, we trying to solve those implementation with a series of knowledge regularization processes. Figure 1. shows a brief implementation flowchart of web-based spatial data analysis study, the whole solution is deconstructed into spatial data analysis modularization and the web deployment. Both tasks are implemented relatively independently.
In this study, an automated land cover change detection (LCCD) module had been developed to provide as a web-based geographic information service. Various change detection techniques had been tested to compare the analysis results and in developing an ideal process. The complete analysis process is actually a manual operation procedure, unable to work as an automated module unless a series of generalization and normalization process is further implemented. The main function of the generalization of analysis procedure is actually to reduce the operation procedures which are unnecessary. Further normalization processing of analysis procedure is to multiply the imageries data by parameters setting that make the integral whole equal to a desired result standard. Modularization process by using the customize module builder to complete the analysis module once the normalized analysis procedure had been developed.
A system deployment based on service oriented architecture (SOA) concept will be implemented to be complete in this research. There are several approaches to test and verify the deployment is ideal for web-based GIService. System architecture and user interface design are the main part of the web-based deployment before we publish the analysis service. Those can largely affect the performance and scalability of the web-based system. Finally, the automated analysis module will be published to users who are connected to the internet to access the GIService through the standards of related protocol and programming language.
Figure 1. Implementation Flowchart of Knowledge Regularization Process
3. KNOWLEDGE REGULARIZATION
To be a web-based spatial analysis service that publish to public users, considerations for users operation convenience are necessary. It was because of the most public users are lack of related GIS knowledge. The spatial analysis tools such as those functions of the specialized software are actually too complexity. The way to make them easy to understand and willing to use is an automated analysis approach. Thus users can get the analysis results without the complexity operations. Besides, for the purpose of disaster response and management, a web-based system architecture is wish to be more scalable to collecting the resources and efficient to disseminate the information of disaster. Thus, this study is trying to deploy the web-based GIService based SOA concept.
3.1 Automated LCCD Module
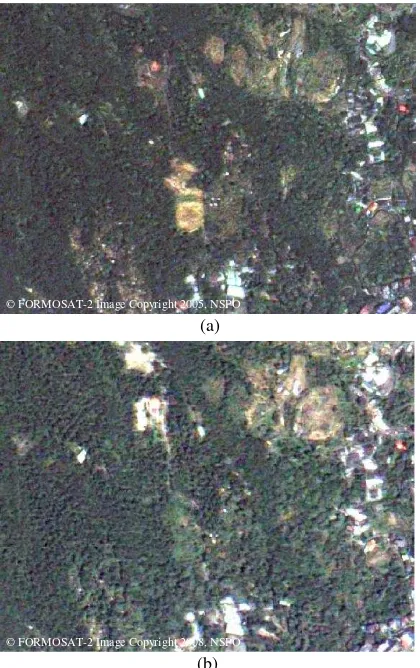
To complete the modularization process of land cover change detection, several image processing techniques had been tested to find out the optimum detection method for land cover change, such as spectrum enhancement techniques, image classification techniques and change detection techniques. This is aims to find out the analysis process with certain accuracy. After the change detection procedure was determined, further work of generalization, normalization, and modularization of the analysis procedure were proceed sequentially to complete the automated analysis module. Imageries of FORMOSAT-2 from 2005 and 2008 (Figure 2.) were used to verify the module. Those were the suburban areas of Taipei where the land cover change was frequently occurred. The operation procedure of automated land cover change detection module is showed in figure 3.
(a)
(b)
Figure 2. FORMOSAT-2 imageries of the suburban area of Taipei from 2005(a) and 2008(b)
3.1.1 Spectrum Enhancement: Most of the optical satellites
were able to measuring surface in two modes, including panchromatic and multispectral. In order to identify surface features accurately, those panchromatic band and multispectral bands are often need to be process by specific algorithms before further analysis. Spectrum enhancement is mainly to enhance the spectral characteristics of the input imageries, and improve the spectral separability between surface features of the image. There are a lot of typical spectrum enhancement approaches that effective in enhancing certain of features spectral characteristic. Such as Normalized Difference Vegetation Index (NDVI) (J. W. Rouse et al., 1973), it enhancing the
vegetation spectral characteristic of input image effectively. Through the vegetation spectral characteristics of high reflectivity to solar radiation in the near-infrared band and low reflectivity to red band, Rouse et al. exploit the strong differences in vegetation reflectance to determine their spatial distribution in satellite images. Besides, there are several spectrum transformation techniques to transform the input RS image into a new raster dataset, such as Principle Component Analysis (PCA) (Lillesand et al., 2004; Lu et al., 2003). It is to transform a multivariate inter-correlated raster data set into a new uncorrelated raster dataset. This algorithm is mainly to simplify the multispectral imageries. Others algorithms included Spectral Mixture Analysis (SMA), Independent Component Analysis (ICA), etc.
In this study, we tested those spectrum enhancement and transformation algorithms above as a part of the land cover change detection module. Many combinations had been tested and finally the enhancement technique of NDVI, PCA and the post PCA which we developed to enhance the result of PCA are used in the module.
Figure 3. Operation Procedure of Land Cover Change Detection Module
3.1.2 Image Classification: As features with their unique reflectance to spectral, image classification is perhaps the most important part of image analysis. The product of classification is largely affects the result of further analysis. The intent of image classification is to determining the surface features of each pixel in an image through those quantitative techniques which involves the analysis of multispectral image data and the application of statistically based decision rules (Lillesand et al., 2004; Lu & Weng, 2003; Liu et al., 2002; Manandhar et al., 2009). Typical classification algorithms included
Minimum-Automated Analysis Module
Spectrum Enhancement
NDVI PCA Post PCA Enhancement
Spectrum Enhancement
NDVI PCA Post PCA Enhancement
Change Detection Post Classification Calculation
Image Classification
ISODATA Classifier
Image Classification
ISODATA Classifier
Input
Image Before Image AfterOutput
Change Polygon
© FORMOSAT-2 Image Copyright 2005, NSPO
© FORMOSAT-2 Image Copyright 2008, NSPO
distance-to-means Classifier, Parallelepiped Classifier, Maximum Likelihood Classifier, ISODATA Classifier (Iterative Self-Organizing Data Analysis), Neural Network Classifier, Object-oriented Classifier, etc. However, there was no answer which algorithm for image classification is the best. To succeed the automation of module, an unsupervised classification method is preferred. This is to make the manual operations and parameters setting of end users as fewer as possible.
After several tests, we finally composite all the bands that output from the spectrum enhancement process with the input image to continue the unsupervised classification works. We tested both the algorithms of Minimum-distance-to-means Classifier, Parallelepiped Classifier, Maximum Likelihood Classifier, and ISODATA Classifier (Iterative Self-Organizing Data Analysis) to get the best result. ISODATA Classifier is finally proposed and used for the classification method of this module.
3.1.3 Change Detection: This technique refer to the process of identify the changes of an object or phenomena through temporal information comparison. It is particularly important to environmental monitoring and management (Lu et al.,2003; Singh, 1989). Lu et al. reviewed various techniques of land cover change detection in 2003, and discussed both advantages and disadvantages between the techniques in detail. It finally showed no single method is suitable for all research cases. Thus, the products of several detection techniques are often used to compare to each other for a specific study area. In this research, we detect the change of land cover from the results of image classification, and convert the result from raster to vector-based data for further change detection by using post classification calculation method.
After determined the optimum analysis technique, the whole operation procedure seem messy and complicated. It is actually unsuitable for module building and need to be further standardize. We then continue to generalize the operation procedure and eliminated procedure that affect the performance of detection. In the standardization process, the setting of parameters and operation threshold need to be considered before further modularization of the land cover change detection. Each setting of the procedure will affect the performance of automated analysis module. Besides, the problem of ill-condition should be considered of the analysis module. The ill-condition will affect the accuracy of analysis result, therefore it need to be regularized and make it well-posed to minimize its effect.
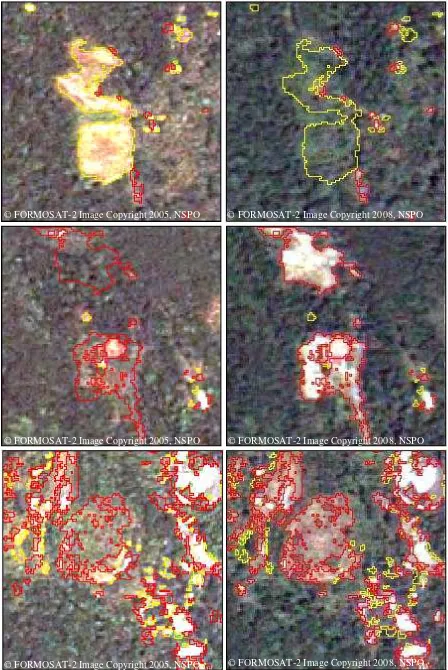
3.1.4 Module Verification: Results of the automated land cover change detection analysis module implementation (figure 4.) showed the output of the module as a vector polygon which mark out the change areas between the two date input images. In this study, we converted the change area which detected by automated land cover change detection module from raster data type to vector data polygon for display visually in the end of a series of raster imageries processing. This is to make the result which display over internet more understandable by end users. The result showed that the module could detect the change area of land cover efficiency, it could also separate the different type of change. In figure 4., the yellow polygons showed the areas of vegetation restoration from 2005 to 2008. Those were areas of landslide, bare land, or even buildings in 2005 (left image) had been restored to vegetation in 2008 (right image). That means those new restorations areas where the vegetation cover is relatively weak. It means there were still potential landslide
areas in the coming next disaster such as earthquake or typhoon. Beside, the red polygon showed in figure 4. were the deforestation areas from 2005 to 2008. Those were vegetation areas in 2005, and had be deforested by disaster or developed into buildings in 2008.
Figure 4. Different type of change detected by automated Land Cover Change Detection module in 2005 (left image) & 2008 (right image)
3.2 Service Oriented Architecture (SOA)
This paper is to implements a spatial data analysis module based on service oriented architecture (SOA) concept. Actually, there are ways to realize web-based spatial data analysis. But the different deployment of the system architecture over the web will largely affects the web-based system operation performance. In order to responding the situation of disaster rapidly and disseminate information, we need to have an advance planning in detail to make sure the scalability of the web-based system. Our study here preferred a service oriented architecture (SOA) to complete our implementation after several related reviews.
Service oriented architecture (SOA) is a structure pattern of computer system for building business applications that utilize common services to bridge the communication gaps between consumers and providers (ESRI, 2007). It guides business solutions to create, organize and reuse its computing components to support business functions (Tsai W., 2010). In other words , the computing components need to be in a loose coupled computing environment to make the web-based
© FORMOSAT-2 Image Copyright 2005, NSPO © FORMOSAT-2 Image Copyright 2008, NSPO © FORMOSAT-2 Image Copyright 2005, NSPO © FORMOSAT-2 Image Copyright 2008, NSPO © FORMOSAT-2 Image Copyright 2005, NSPO © FORMOSAT-2 Image Copyright 2008, NSPO
functions more flexible. SOA separates functions into distinct services, and foster the reusability and consolidation opportunities of such computing components (Erl, 2005). Although there was no fixed structure pattern for system deployment, however some architecture patterns are not enough for the demand of system flexibility in this case. We need a more flexible system architecture to dissemination the information of disaster area. SOA possesses the higher collocation flexibility with its distributed properties, it provide a great flexible expansion environment to coupling the computing components for rapidly disaster response.
Web service refers to a software system design which support interoperable machine-to-machine interaction over a network (Haas & Brown, 2004). It has an interface described in a machine-processable format such as WSDL. Other systems interact with the Web service in a manner prescribed by its description using SOAP-messages, typically conveyed using HTTP with an XML serialization in conjunction with other Web-related standards. According to those conceptual principles, web service can be used to implement a service oriented architecture which can successfully provide the spatial data analysis over the web-based structure.
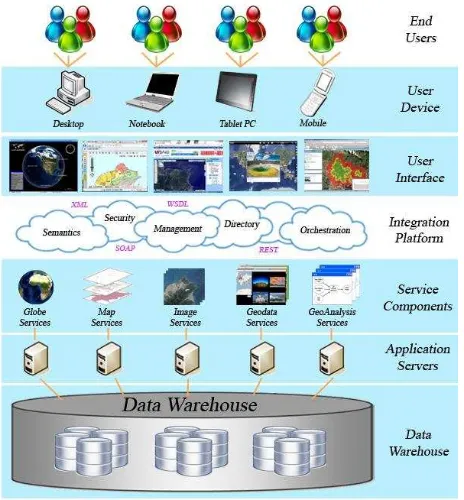
Figure 5. A Conceptual SOA Based on Web GIService Figure 5. shows the conceptual framework of the service oriented architecture based on Web GIServices. It represented a complete architecture that supports Web GIServices. With its distributed characteristic, each application server provides specific service that was once only available through direct access to the spatial analysis software. The framework of this study is a fully web-based analysis service. No direct connection to raw satellite imagery or GIS database is required. With a portal of data warehouse based on ESRI softwares and SOA services developed by the authors, users can successfully complete the tasks through internet. Of course, there are decisions to be made about trade-off between security and easy accessibility. The last challenge is the design of GUI that integrates service components into an end users interface to meet the spatial data analysis service purposes. The creation of
services that are highly standardized and reusable in SOA, that it can be orchestrated to support various devices over related protocol standards and programming languages such as SOAP and WSDL. Through those ideal concepts of web deployment, the preliminary interface of web-based GIServices of this was shown as figure 6.
Figure 6. A Conceptual application interface of web-based GIService
4. CONCLUSIONS
For the preliminary study of web-based GIServices, web-based spatial data analysis is feasible. However, how to made people easy access to the GIServices with higher efficiency in disaster dissemination is the main purpose of this research.
The key to the success of our research is the regularization of problem solving knowledge, using both the modularization of spatial data analysis and the deployment of web-based system architecture. The fundamental of SOA is purpose-oriented, as studied no single module can serve all purposes. Nevertheless, the great collocation flexibility of SOA possessed was the key factor to disseminate information rapidly when disaster struck. It can even bridge database servers and application servers in a short time in sharing information and in responding to the calamity situation. However, SOA can be implemented only with the existence of an SOP for spatial data analysis procedure, therefore the regularization of analysis knowledge will be the key to achieve web-based GIServices purpose.
Web-based GIServices are expected to maximize the add-on value and minimize the cost of the spatial data. Moreover, in the case of disaster response and management, it play an important role of information dissemination. However, we are aware with the fact that this is too expensive a method in setting up the whole system alone. Therefore, the main purpose of this paper is also to promote an idea of resources sharing and multi-sector cooperation in responding and management at a time of a disaster. It can be operated powerfully by bridging the web-based platform and the database servers along with the GIService servers together in responding and management of a disaster at a given time.
5. FUTURE WORKS
For further researches, there are still areas to be studied in optimizing the web-based spatial data analysis platform. Researches of cross-platform/cross-resolution image analysis in integrating the multi-sensor satellite imagery resources for analysis in maximizing the value of those limited imageries provided at the time of affected area.
Further study of automated analysis module development will be focused on modules to serve various analysis purpose, in making the web-based platform more powerful in responding and management of a disaster more efficiently.
Development of spatial information standards for the World Wide Web will be the most important task that affect the accessibility of web-based GIService. Another emphasis on the future research will also be made on the application interface and accessibility mechanisms for different devices that optimizes the dissemination performance.
REFERENCES
References from Journals:
Anselin, L., Kim, Y. W., and Syabri, I., 2004. Web-based analytical tools for the exploration of spatial data. Journal of Geographical Systems, 6(2), pp. 197-218.
Liu, X.H., Skidmore, A.K., and Oosten, H.V., 2002. Integration of classification methods for improvement of land-cover map accuracy. Journal of Photogrammetry & Remote Sensing, 56(4), pp. 257-268.
Lu, D., et al., 2003. Change Detection Techniques. International Journal of Remote Sensing, 25(12), pp. 2365-2407.
Lu, D., and Weng, Q., 2007. A survey of image classification methods and techniques for improving classification performance. International Journal of Remote Sensing, 28(5), pp. 823-870.
Manandhar, R., Odeh, I.O.A., and Ancev, T., 2009. Improving the Accuracy of Land Use and Land Cover Classification of Landsat Data Using Post-Classification Enhancement. Remote Sensing, 1(3), pp. 330-344.
Singh, A., 1989. Digital Change Detection Techniques Using Remotely-sensed Data. International Journal of Remote Sensing, 10(6), pp. 989-1003.
Tsou, M. H., 2004. Integrating web-based GIS and image processing tools for environmental monitoring and natural resource management. Journal of Geographical Systems, 6(2), pp. 155-174.
References from Books:
Erl, T., 2005. Service-Oriented Architecture: Concepts, Technology, and Design. Prentice Hall, Crawfordsville. Lillesand, T. M., Kiefer, R. W., and Chipman, J. W., 2004. Remote Sensing and Image Interpretation, 5th ed. Wiley, New York, pp. 509-592.
Longley, P.A., et al., 1999. Geographical Information Systems, 2nd ed. Wiley, New York.
References from Other Literature:
ESRI, 2007. Geospatial Service-Oriented Architecture (SOA). ESRI, California.
Rouse, J. W., et al., 1973. Monitoring the Vernal Advancement and Retrogradation (Green Wave Effect) of Natural Vegetation. NASA/GSFC Type Ⅱ Progress Report RSC 1978-2, Remote Sensing Center College Station, Texas A&M Univ., USA, pp. 43-44.
Tsai, W., 2010. Service-Oriented Cloud Computing Architecture. In: Proceedings of Seventh International Conference on Information Technology, Las Vegas, pp. 684-689.
References from websites:
Haas, H., and Brown, A., 2004. Web Services Glossary, World Wide Web Consortium. http://www.w3.org/TR/2004/NOTE-ws-gloss-20040211/#webservice (accessed 16 July 2011).