________________________
USING REMOTE SENSING AND GIS TECHNIQUES TO DETECT CHANGES TO THE
PRINCE ALFRED HAMLET CONSERVATION AREA IN THE WESTERN CAPE,
SOUTH AFRICA
P. Duncan a *, M. Lewarne b
a Dept. Rural Development and Land Reform, National Geospatial Information, Cape Town, South Africa – [email protected], [email protected]
b WWF-SA, Cape Town, South Africa – [email protected]
Commission VII, WG VII/5
KEY WORDS: Change Detection, Remote Sensing, Biodiversity, Wetland, Conservation
ABSTRACT:
Understanding and identifying the spatial-temporal changes in the natural environment is crucial for monitoring and evaluating conservation efforts, as well as understanding the impact of human activities on natural resources, informing responsible land management, and promoting better decision-making. Conservation areas are often under pressure from expanding farming and related industry, invasive alien vegetation, and an ever-increasing human settlement footprint. This study focuses on detecting changes to the Prince Alfred Hamlet commonage, near Ceres in the Cape Floral Kingdom. It was chosen for its high conservation value and significance as a critical water source area. The study area includes a fast-growing human settlement footprint in a highly productive farming landscape. There are conflicting development needs as well as risks to agricultural production, and both of these threaten the integrity of the ecosystems which supply underlying services to both demands on the land. Using a multi-disciplinary approach and high-resolution satellite imagery, land use and land cover changes can be detected and classified, and the results used to support the conservation of biodiversity and wildlife, and protect our natural resources. The aim of this research is to study the efficacy of using remote sensing and GIS techniques to detect changes to critical conservation areas where disturbances can be understood, and therefore better managed and mitigated before these areas are degraded beyond repair.
1. INTRODUCTION
1.1 Background
This paper is the result of a joint pilot study between the non-government conservation organisation the World Wide Fund for Nature in South Africa (WWF-SA) and the government Department of Rural Development and Land Reform of South Africa, office of the Chief Directorate: National Geospatial Information (CD: NGI). It is a partnership initiated to explore remote sensing as a way of addressing some of South Africa’s greatest natural resource protection and planning conundrums. A small site with high biodiversity value and many complex socio-political pressures threatening its natural infrastructure was chosen to test the methodology. This pilot study is focused on the commonage area of the Prince Alfred Hamlet village, approximately 1500 hectares in the Breede Valley of the Western Cape Province of South Africa.
South Africa has many challenges safeguarding natural resources in the short term planning agenda as social reform and poverty alleviation are the main focus of the South African government since the new democracy was born in 1994. One of the goals cited by the Department of Rural Development and Land Reform is sustainable land and agrarian transformation, seeking to increase agricultural production through the optimal and sustainable use of natural resources and appropriate technologies to ensure food security, dignity and improved rural livelihoods. The idea is that this would lead to vibrant local economic development (DRDLR, n.d.). For proper management of these resources, in order to preserve them for the wellbeing of all into the future, it’s important to understand how they function and what they provide as ecological services which
also underpin sustainable economic development. They are seldom taken into account in the pressured environment of municipal land use planning and management where the responsibility of sustainable decision-making rests. We would like to explore how remote sensing can inform and support long term planning for natural resources through change detection over time in the study area.
The Western Cape Province has a highly variable climate in which droughts and floods are common risks. The South African Weather Service indicated that South Africa is currently in the grips of the worst drought in 23 years, causing fears of food insecurity for the country’s staple food and livestock production industries (DAFF, 2016). The Western Cape experiences seasonal winter rainfall, peaking in June to August. In February the mean daily maximum is 29.9 degrees Celsius, while in July it is 4.8 degrees Celsius (Mucina and Rutherford, 2006). Between April and September approximately 80% of precipitation falls, brought by mid-latitude cyclones, which are dominant over the region in these months. As is the case with many mountainous areas, there is a considerable spatial variation in rainfall. In the Western mountain areas rainfall can be as high as 2300 mm per annum, whereas in the middle reaches rainfall decreases to as low as 400 mm per annum (DWAF, 2002a).
Ceres valley is an important export fruit production area. WWF and two retailers, Marks & Spencer and Woolworths, identified it as a high water risk region in terms of their supply chains. Stone fruit production was targeted to apply water stewardship, a best agricultural practice standard for efficient water management (WWF, 2014).
The town of Ceres and the smaller Prince Alfred Hamlet are situated in the headwaters of the Breede River, the largest river in the Western Cape and the key resource for many economic activities in the region. Originating in the Ceres Valley, it drains in a south-easterly direction meeting the Indian Ocean at Witsand/Cape Infanta (Sebastian Bay) and flows through a key agricultural region in the Western Cape (DWAF, 2002b). It is one of the national Water Source Areas identified and mapped (Colvin et al., 2013) by WWF South Africa and the Council for Scientific and Industrial Research (CSIR). The research found that a mere 8% of the land area of South Africa generates more than half of the national river flow. This highlights how vitally important it is to secure healthy water sources so that we build our future economic growth, taking into account the complexities of social inequality, in a water stressed climate. Commonages fall under local government management, and can be described as common pasture lands that adjoin a town or village over which the inhabitants of the village either have a servitude of grazing for their stock, and, more rarely, the right to cultivate a certain portion of these lands (Anderson and Pienaar, 2003; Atkinson, 2012; Dönges and Van Winsen, 1953). A planning conundrum arises when short term pressures take precedence over long term planning, jeopardising the continued supply of ecosystem services which are needed to support human development into the future. The South African government, devolving responsibility to the local municipal authority, is under tremendous pressure to accommodate an ever expanding population in rural expansion nodes like Ceres and Prince Alfred Hamlet. Seasonal agricultural work draws migrant labour to the area for harvesting and processing of agricultural produce. Once contracts have ended, migrant workers often remain in the town, as there are even fewer economic prospects in the rural areas from where they come.
1.2 The importance of the Prince Alfred Hamlet commonage
The study area falls within one of the richest and most diverse species tapestries of the world, the Fynbos Biome, which is also one of five global Mediterranean Biomes (Mucina and Rutherford, 2006). The plant and animal communities are full of rare and endemic species that create a symphony of natural processes enabling and supporting life within itself and support the human beings that live in and around them. This site is a biodiversity hotspot in terms of floral species diversity, and the network of wetlands and water drainage lines, which directly influence water quantity and quality. Less than 50% of South Africa’s wetlands remain intact. An enormous challenge exists for government and NGOs to maintain and restore what is left of wetlands in a way that keeps pace with a developing population and its growing demands on the resource base, yet still provide the per capita ecosystem service levels provided by healthy wetlands (WWF, 2015).
The Prince Alfred Hamlet commonage wetlands have been classified as Sandstone seep wetlands. They are located along the base of the mountain filtering through sandy soils. There are both permanent and seasonal wetlands which receive water via fractured sandstone. The wetlands are important for habitat, water supply, downstream flow regulation, and slowing of fast-flowing overland runoff from steep mountainsides (Job, 2015). Wetlands also perform two important functions in relation to climate change through their ability to sink carbon, and secondly their adaptation effects through their ability to store and regulate water. This becomes a crucial service in times of
drought as is being experienced in the current El Niño weather pattern.
Expert initial review of this location has identified the vegetation type most likely to be the species Kouebokkeveld Alluvium Fynbos (Koopman, 2015). Mucina and Rutherford (2006) define Kouebokkeveld Alluvium Fynbos as “slightly undulating plains in mountain valleys where alluvium has accumulated alongside rivers and as alluvial fans. Vegetation is emergent proteoids in a low medium dense grassy shrubland, structurally primarily asteraceous and proteoid Fynbos with prominent ericacesou Fynbos in numerous seeps. This vegetation type is classified as Endangered, with a target of 29% of the original area to be conserved to maintain a representative sample (75%) of the species found in this unit. Almost half of this vegetation type extent has been cleared for orchards and pastures.” Kouebokkeveld Alluvium Fynbos is therefore under serious threat of losing functional representation.
Prince Alfred Hamlet is managed by the Witzenberg Local Municipality in the Cape Winelands District. It is a small town just north of Ceres, housing mostly seasonal agricultural workers attracted to work opportunities in the harvest season. Over the years, many people have remained in the town leading to rapid urban growth and many challenges for the management of the municipality.
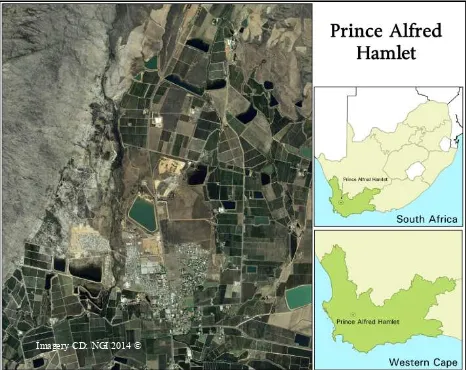
Figure 1. Study area
In the case of the Prince Alfred Hamlet commonage, stock grazing, wood cutting, sand mining, as well as the expansion of formal and informal residential developments are the main threats to the integrity of the natural infrastructure. It is uniquely ecologically sensitive, and demonstrates the complexity local government departments are faced with when planning for the expanding human development needs typical of South Africa. Many local authorities lack the financial and specialist resources to take the ecological infrastructure into account when creating municipal plans.
1.3 Objective
The objective of this study is to detect changes that have occurred in the Prince Alfred Hamlet commonage between 2010 and 2014. The most recent map and spatial data available from the CD: NGI is dated at 2010. Features that are of particular interest in the study area include the expanding built-up area,
Imagery CD: NGI 2014 ©
degraded or eroded land, wetlands, cultivated lands, waterbodies, fynbos scrubland, and alien vegetation.
2. DATA
2.1 Imagery
WorldView-2 Ortho Ready Standard Level-2A bundle imagery (PAN and MS), acquired on 14 October 2014 was used in this study. WorldView-2 is a commercial high-resolution satellite providing 0.46m resolution panchromatic imagery, and eight-band multispectral imagery at 1.84m resolution. The multispectral imagery is comprised of the following image bands: Coastal Blue, Blue, Green, Yellow, Red, Red Edge, NIR1 and NIR2. The high spatial resolution of the imagery allows for the differentiation of fine details, such as vehicles, and individual trees, while the high spectral resolution may provide detailed information on the quality of road surfaces, and plant health (DigitalGlobe, 2010). Studies have shown that the new spectral bands (Coastal Blue, Yellow, Red Edge and NIR2) of WorldView-2 can improve the classification accuracy for land cover classes such as man-made materials, selected vegetation, and soil (Marchisio et al., 2010).
The panchromatic and multispectral bands of the imagery were fused to combine the rich spectral information of the eight multispectral bands with the high spatial resolution of the panchromatic band, resulting in 0.46m resolution pan-sharpened multispectral satellite imagery. The imagery was orthorectified using DEM data from CD: NGI to correct for image distortions.
Figure 2. From left to right: multispectral, panchromatic, and pan-sharpened WorldView-2 Image Copyright 2014,
DigitalGlobe ©
2.2 Topographic data
Existing vector data representing topographical features, acquired by the CD: NGI, is the basis for measuring and comparing changes that are detected. Topographic data for the Prince Alfred Hamlet commonage is dated at 2010, and this also represents the most up-to-date national map for the area of interest.
3. METHODOLOGY
There were two main steps in this study, after the satellite imagery was pan-sharpened and orthorectified. Firstly, the imagery was classified using an object-based approach; secondly, the results of the classification were compared with the CD: NGI’s existing topographical map data to identify changes.
Figure 3. Methodology
3.1 Change detection
Change detection is defined as the process of identifying differences in the state of an object or phenomenon by observing it at different times (Singh, 1989). There are many different methods of change detection, but broadly speaking they can be divided into two categories: those detecting binary change or non-change information, and those detecting a ‘from-to’ change trajectory. The first group includes methods such as image differencing, image ratioing, vegetation index differencing, and principal component analysis (PCA), while the second group is comprised of methods that use post-classification comparison, multi-date post-classification and hybrid change detection methods (Breytenbach et al., 2013; Lu et al., 2010, 2004).
In a study conducted by Mas (1999), whereby six methods of change detection were compared, the post-classification change detection was found to be the most accurate procedure. Other methods tested included image-to-image differencing, selective principal component analysis, vegetative image differencing, direct multi-date unsupervised classification, and a combination of image enhancement and post-classification comparison. The method of post classification change detection has the added advantage of specifying the type of change (Mas, 1999). In this study we used the method of post-classification change detection, with the CD: NGI topographic data being the basis for detecting changes to the Prince Alfred Hamlet commonage. The topographic data represents the state of the commonage at the first epoch, i.e. 2010, while the satellite imagery and derived classification represents the second epoch, i.e. 2014.
3.2 Image classification
When using high-resolution imagery, pixel-based classifiers often result in the salt and pepper effect (Blaschke et al. 2000), and as such, WorldView-2 imagery can introduce significant noise at a pixel-based classification level (Breytenbach et al.
2013). This salt and pepper effect may be overcome by using an object-based classification approach (Blaschke et al. 2000; Yu et al. 2006; Blaschke 2010).
In this study we used an object-based classification approach using the software eCognition Developer. Image segmentation is the first step in an object-based image classification. The multiresolution segmentation technique was used in this study, as it produces highly homogenous image objects (Baatz and Schäpe, 2000). All eight image bands were used in the segmentation process with equal weighting.
The eight spectral sensors of WorldView-2 are each narrowly focussed on a particular range of the electromagnetic spectrum that is sensitive to certain ground features or atmospheric properties. Together they are designed to improve the segmentation and classification of land and water features (DigitalGlobe 2010).
There are various methods of classifying segments within the object-based classification environment. In this study, we used the Nearest Neighbor classification algorithm. The classifier is based on user defined samples, and a Nearest Neighbor algorithm combined with predefined feature sets which are used to assign objects to classes (Trimble, 2012). These feature sets included spectral statistics such as mean values for image reflectance bands (Coastal Blue, Blue, Green, Yellow, Red, Red Edge, NIR1 and NIR2), mean brightness, maximum difference, NDVI, and texture measures GLCM homogeneity and GLCM contrast.
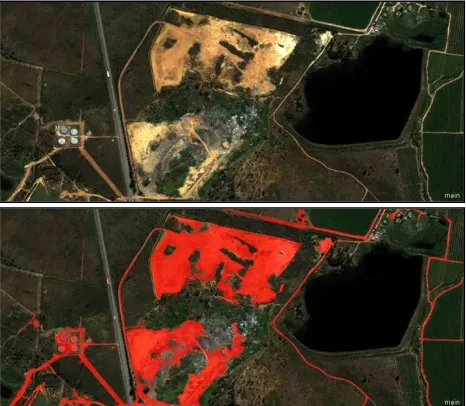
The yellow band was found to be effective in the identification of bare soils (see Figure 4), which concurs with the findings of Souza & Kux (2012).
Figure 4. Bare ground identified using a threshold value of the yellow image band. WorldView-2 Image Copyright 2014,
DigitalGlobe ©
The inclusion of image texture (Haralick et al. 1973; Blaschke et al. 2014) can assist with the classification process and has been found to increase classification accuracies (Aguilar et al., 2013; Franklin and Peddle, 1990). The texture measure GLCM (grey level co-occurrence matrix) contrast is effective in differentiating built-up areas from non-built-up areas (Duncan,
2013) and GLCM homogeneity is useful for wetland class discrimination (Lane et al., 2014).
Figure 5. NDVI using density slicing
WorldView-2 Image Copyright 2014, DigitalGlobe ©
The Normalized Difference Vegetation Index (NDVI) is a simple, yet effective technique, to identify areas that are vegetated. NDVI is calculated using the equation (1), with positive results indicating the presence of vegetation.
NDVI
=
NIR
1
−
Re
d
NIR
1
+
Re
d
(1)Normalized Difference Vegetation Index and image texture are valuable for improving classification accuracy and for discriminating among certain habitat classes (Lane et al., 2014). The density-slicing tool was used to identify object feature threshold values for NDVI, as seen in Figure 5, where segments are shaded from blue to green. The brighter green objects have higher NDVI values, while the blue segments have lower values.
3.3 Land cover classes
The CD: NGI has proposed a set of land cover classes which has been published for public comment (DRDLR, 2016), as it was found that previous land cover classes that were used in South Africa were not suitable for national land cover mapping. The CD: NGI proposed national land cover classes at level-1 classification were used in this study, but amended slightly where needed to accommodate for the classes of interest. Classes present in the scene included the following: bare, built-up, wetlands, waterbodies, cultivated, grassland and fynbos scrubland, which were grouped together to align with the
grassland class proposed by CD: NGI, as well as alien vegetation which was labelled thicket/dense bush, which is not a first level land cover class, but was included in the study due to its significance in the study area.
Land Cover Classes (Level 1) CD: NGI
Forest land Shrubland Grassland Waterbodies Wetlands Barren land Cultivated Built-up
Mines and quarries
Table 1. Land cover classes (CD: NGI)
4. RESULTS
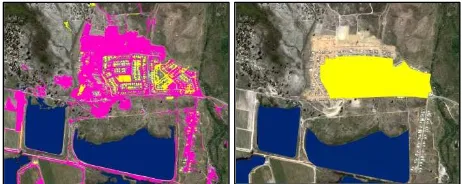
Results indicate the importance of the yellow image band in discriminating bare ground from other classes present in the study area. The classification results in Figure 6 show that even bare ground and built-up areas, classes which can easily be misclassified, were well differentiated using WorldView-2 imagery and an object-based classification approach. The detection of bare ground is an important indicator of urban expansion, and degraded or eroded land. It is clear from the results in Figure 6 that there has been a significant increase in bare ground since the topographic data was captured in 2010. The increase in bare ground is adjacent to an existing built-up area, indicating the likely potential for urban expansion. The built-up area to the right of the large dam in Figure 6 is also a post 2010 development and was detected in the classification along with bare ground surrounding it.
Figure 6. Left: Classification, right: topographic data (2010). Bare (pink), built-up (yellow), water (blue)
©WorldView-2 Image Copyright 2014, DigitalGlobe.
The NDVI proved to be useful in identifying vegetation and waterbodies in the scene. The classification results also showed that cultivated land was well detected within the object-based classification approach. Waterbodies were accurately detected in the classification, as can be seen in Figure 6, Figure 7 and Figure 8.
Figure 7. Classification of waterbodies (blue segments)
©WorldView-2 Image Copyright 2014, DigitalGlobe.
In Figure 8, we can see how the water level in the dam has changed since it was captured in 2010. The classification result and older topographic data were differenced and used to obtain the resulting change layer.
Figure 8. Left: Topographic data (2010), Middle: Classified waterbodies, Right: Changes highlighted (light blue)
WorldView-2 Image Copyright 2014, DigitalGlobe ©
Wetlands are one of the most difficult ecosystems to classify due to their high spatial heterogeneity and temporal variability, varying sizes and shapes, diversity of plants species, vegetation structures and types and water levels (Lane et al., 2014). There was no available data for wetlands within the CD: NGI topographic dataset, even though the topographic structure makes provision for this class. It was therefore not possible to conduct change detection for wetlands. The classification results correctly identified many wetlands, but over-classification of this feature occurred in the study area. The classes grasslands and fynbos scrubland, as well as thicket or dense bush, were not present in the topographic dataset, and were therefore also not included in the change detection process.
Features representing cultivated lands were classified as either
cultivated or orchards and vineyards in the CD: NGI topographic database. These two feature classes had to be merged to compare with the single cultivated class present in the classification.
Figure 9. Left: Topographic data (2010), Right: Topographic data with changes (light green)
WorldView-2 Image Copyright 2014, DigitalGlobe ©
The combination of spectral reflectance values of image bands, image texture, and NDVI from WorldView-2 imagery, combined with an object-based classification approach, resulted in a satisfactory classification of the Prince Alfred Hamlet commonage for this pilot study. At this stage, accuracy was only assessed visually, as more work is required in refining the classification for wetlands, alien vegetation, grasslands, fynbos and other classes with a high spatial heterogeneity and temporal variability.
We were not able to do a complete comparison between classified data and topographic data, as some classes, such as
wetlands, grasslands and fynbos scrubland are not present in the topographic dataset.
5. DISCUSSION AND CONCLUSION
The results indicate that there is significant potential in using WorldView-2 imagery for land cover classification, even though more work is needed refining the classification in this study. Future work will include testing additional feature sets such as more spectral statistics, more texture, contextual information, new vegetation indices, etc.
Although wetlands were difficult to classify, and further analysis is needed, the general pattern of wetland locations was however identified with some level of certainty. There was however some confusion between wetlands and certain vegetation types, which can be expected due to the characteristics of these classes.
The yellow band of WorldView-2 imagery was found to be very useful in detecting bare ground. Waterbodies were classified very successfully using World-View-2 imagery and an object- based classification approach. Cultivated land was reasonably well detected with most areas being correctly classified. The built-up class was quite successfully identified, although there were some misclassifications present.
The land cover class schema used also had an impact on the results achieved, as some classes had to be merged, and may have been more accurately classified as individual classes. For future studies additional classes will be incorporated into the study, such as riparian vegetation, specific fynbos vegetation, shrubland, etc.
Changes in the Prince Alfred Hamlet commonage were identified in this study. Changes of particular interest are the increase in bare ground indicating preparation for new settlements, as well as other bare areas indicating degradation. Waterbodies remained mostly constant and were easily
detected, along with the changes which occurred in water levels, such as in Figure 8. The classification and change detection process was able to highlight new built-up areas in the Prince Alfred Hamlet commonage.
Future work for this study will include refining the image classification, as well as performing an accuracy assessment and field verification, particularly for wetland areas.
ACKNOWLEDGEMENTS
The authors wish to acknowledge DigitalGlobe for making the imagery available for this study. The pilot study is a collaboration between the Department of Rural Development and Land Reform, office of the Chief Directorate: National Geospatial Information and the World Wide Fund for Nature in South Africa.
REFERENCES
Aguilar, M., Saldaña, M., Aguilar, F., 2013. GeoEye-1 and WorldView-2 pan-sharpened imagery for object-based classification in urban environments. Int. J. Remote Sens. 34, 2583–2606.
Anderson, M., Pienaar, K., 2003. Municipal Commonage, No.5 in the series on Evaluating Land and Agrarian Reform, Programme for Land and Agrarian Studies (PLAAS). Atkinson, D., 2012. Revitalising municipal commonages as a
key approach to land reform and pro-poor agricultural development Corresponding, in: Strategies to Overcome
Poverty & Inequality.
doi:10.1017/CBO9781107415324.004
Baatz, M., Schäpe, A., 2000. Multiresolution Segmentation: an optimization approach for high quality multi-scale image segmentation, in: Strobl, J., Blaschke, T., Griesebner, G. (Eds.), Angewandte Geographische Informations-Verarbeitung XII. Wichmann Verlag, Karlsruhe, pp. 12– 23.
Breytenbach, A., Eloff, C., Pretorius, E., 2013. Comparing Three Spaceborne Optical Sensors via Fine Scale Pixel-based Urban Land Cover Classification Products. South African J. Geomatics 2, 309–324.
Colvin, C., Haines, I., Nobula, S., 2013. An introduction to South Africa’s Water Source Areas.
DAFF, 2016. DROUGHT RELIEF UPDATE AND COUNTRY’S READINESS TO IMPORT GRAINS. doi:10.1017/CBO9781107415324.004
DigitalGlobe, 2010. The Benefits of the Eight Spectral Bands of WorldView-2.
Dönges, T., Van Winsen, L. de V, 1953. Municipal Law, 2nd ed. Juta, Cape Town.
DRDLR, 2016. Invitation to comment on the draft National Standard on Land Cover Classes and Definitions [WWW
Document]. URL
http://www.ruraldevelopment.gov.za/component/content/ article/77-news/1205-invitation-to-comment-on-the- draft-national-standard-on-land-cover-classes-and-definitions#.VxJRhccbBE4 (accessed 4.16.16).
DRDLR, n.d. About The Department [WWW Document]. URL http://www.ruraldevelopment.gov.za/about-us/the-department (accessed 4.4.16).
Duncan, P., 2013. The development of a method for semi-automatic classification of built-up areas from aerial imagery. University of Cape Town.
Lane, C., Liu, H., Autrey, B., Anenkhonov, O., Chepinoga, V., Wu, Q., 2014. Improved wetland classification using eight-band high resolution satellite imagery and a hybrid approach. Remote Sens. 6, 12187–12216. doi:10.3390/rs61212187
Lu, D., Hetrick, S., Moran, E., Li, G., 2010. Detection of urban expansion in an urban-rural landscape with multitemporal
QuickBird images. J. Appl. Remote Sens. 4, 041880. WorldWiew-2 sensor. Geosci. Remote Sens. Symp.
(IGARSS), 2010 IEEE Int. Africa, Lesotho and Swaziland. Strelitzia 19, South African National Biodiversity Institute, Pretoria.
Singh, A., 1989. Digital change detection techniques using remotely sensed data. Int. J. Remote Sens. 10, 989–1003. Souza, U., Kux, H., 2012. Contribution of the New Worldview-2 Spectral Bands for Urban Mapping in Coastal Areas: Case Study São Luís (Maranhão State, Brazil). ISPRS - Int. Arch. Photogramm. Remote Sens. Spat. Inf. Sci. XXXIX-B4, 171–176. doi:10.5194/isprsarchives-XXXIX-B4-171-2012
Trimble, 2012. eCognition Developer User Guide 8.7.2. WWF, 2015. WWF Mondi Wetlands Programme [WWW