PROCEDURES AND METHODS OF DIGITAL MODELING IN REPRESENTATION
DIDACTICS
M. La Mantia a
a
Dipartimento di Storia, Disegno e Reastauro dell’Architettura, Sapienza Università di Roma, Italia -
archmariella@gmail.com
KEY WORDS: 3D modelling, Survey, Design, Representation
ABSTRACT:
At the Bachelor degree course in Engineering/Architecture of the University “La Sapienza” of Rome, the courses of Design and Survey, in addition to considering the learning of methods of representation, the application of descriptive geometry and survey, in order to expand the vision and spatial conception of the student, pay particular attention to the use of information technology for the preparation of design and survey drawings, achieving their goals through an educational path of "learning techniques, procedures and methods of modeling architectural structures "
The fields of application involved two different educational areas: the analysis and that of survey, both from the acquisition of the given metric (design or survey) to the development of three-dimensional virtual model.
1. INTRODUCTION
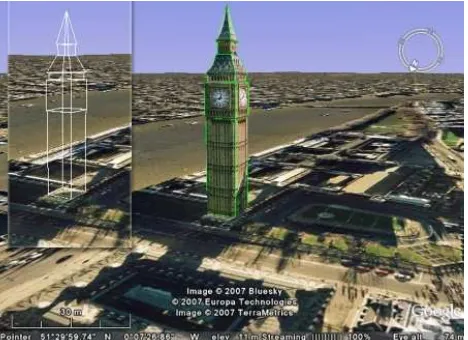
In the last thirty years, informatic revolution has deeply influenced and modify the area of graphic representation, both in procedures and in techniques. This fact determined a deep evolution of the project process, not only limiting to the substitution of the traditional graphic methods with the newest digital automatized techniques. In particular, 3D modelling gave rise to a very high interest both for prfessionals and accademics for the notable benifts that can offer. The use of 3d modelling involves nowadays many different productive sectors, such as industry, robotics, surfing, body-scanning, etc. figg.1,2,3,4,5,6,7).
Figure 1. Google Earth Shot Showing data created by PhotoModeler 6 and the new Google Earth exports (wireframe
or textured). Big Ben model was created from a single photograph using the new Shapes feature in PhotoModeler 6
In particular, for architecture, 3D modelling is used with many goals, such as documentation, representation, material diagnostics, determination of degrade status, asset enhancement, etc. 3D Modelling is characterized by high precision, low cost and high level of automation. It is a
powerful tool for creating documentation and design that allows you to manage even the most complex geometric surfaces (translated into mathematical formulas) and represents an evolution of the traditional static methods of representation as it offers the possibility to introduce an important variable, impossible to consider in the traditional graphic methods of representation on paper: the movement.
Figure 2. Screen shot of PhotoModeler Scanner's 3D. View showing a wire frame, shaded surface and textured surface of a full body scan done with two synced digital cameras and DSM.
This parameter is translated into complex interactive simulations (virtual visits, etc. ..) that reproduce real and virtual situations at different scales simultaneously.
Hence the need to broaden the knowledge of the software and procedures and methods of modeling in the teaching of Design and Survey. At the Bachelor degree course in Engineering / Architecture of the University “La Sapienza” of Rome, the courses of Design and Survey1, in addition to considering the
1
These are courses in "Architectural Drawing I and II, planned for the Degree Course in Engineering / Architecture of the University
learning of methods of representation, the application of descriptive geometry and survey, in order to expand the vision and spatial conception of the student, pay particular attention to the use of information technology for the preparation of design and survey drawings, achieving their goals through an educational path of "learning techniques, procedures and methods of modeling architectural structures ".
The fields of application involved two different educational areas: the analysis and that of survey, both from the acquisition of the given metric (design or survey) to the development of three-dimensional virtual model. The research activity in education has been driven by scientific criteria in the choice of methodologies, technologies and procedures to be used for three-dimensional digital representation of an architectural structure analyzed and/or surveyed.
Figure 3. An example of application of robotics in surgery of transplantation (the robot provides a high precision in surgical procedures and allows a significant reduction of time cost).
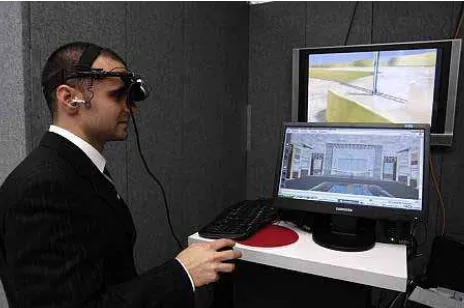
Figure 4. Proposal for a three-dimensional interactive and navigable, accessible technology through active 3D stereo HMD. without a mouse and joystick. Just wearing a helmet and moving the head you can pass through the rooms and visit the house, which was rebuilt in its entirety.
Sapienza of Rome, are supplemented by laboratory project for a total annual commitment of 180 hours.
Figure 5. The interactive virtual museum of the Medical School.
Figure 6. Three-dimensional graphics processing taken from the Videogame Spider-Man 3 "Live".
Figure 7. An example of three-dimensional processing by Tele Atlas. These calculations are designed to allow motorists and pedestrians to orient themselves more easily showing the representation of the destination. Due to the potential of three-dimensional representation, the images shown on navigation systems better reflect what users actually see around them. According to a recent survey, 81% of current and potential users of navigation systems has expressed a preference for the 3D representation
.
2. THE ANALYSIS OF ARCHITECTURE
Normally only Laboratory work for the School of Architectural Drawing I, is devoted to reading and understanding of modern and contemporary architectures in its spatial aspects: geometric, structural, and functional.
This analysis is divided into different stages ranging from the material model to the realization of the virtual model useful for understanding and communicating architecture. The aim is both to accustom the student to the process of abstraction of the geometric model, which is relevant for the architectural space, and to enable the student to develop - in terms of an overall "project" of knowledge - the ability to critically understand the multiplicity of components (formal, historical, structural, functional, etc..) that characterizes the architecture.
The analysis of the architecture allows an easy process of habituation to see, read, record and identify the components of the architecture, the organizational and aggregational principles even in a broader project objective. In short, to analize an architectural organism means "break it down into parts or elements. "
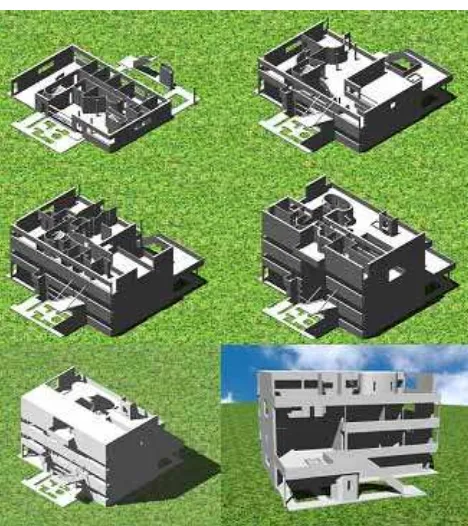
Figure 8. Villa Stein by Le Corbusier. The images show the processing steps of the render.
The drawing offers the opportunity to represent not only what we see with our eyes but also what we don’t see, but we think or imagine it to be. If the 3D representation effectively fulfills this function since it combines different aspects together, articulating and disarticulating even the more complex realities, making them easy to read, digital modeling goes further in that it allows to dynamically reconstruct the process of realization of the work to highlight rules of operation (figg.8,9).
Figure 9. Villa Stein by Le Corbusier. Two-dimensional representations obtained from the three-dimensional model.
Do not forget the possibility to virtually reproduce the local contextualization of the architecture that is the relationship between buildings and surroundings. Knowledge of architecture cannot be considered comprehensive if it does not include the control of some key parameters such road system, the analysis of visual perspective and elevation profiles, etc. .. The design of an architectural structure also includes the context in which it is made, a context that naturally undergoes changes and alterations over the years.
Simulating assumptions and alternative scenarios to the existing, planned or evolved over time once, however, is a necessary tool to control the process of reading and pre-figuration space.
Figure 10. Ostia Lido. 3D Model of the detached house by A. Libera in Piazza Magellano.
The modeling path is divided into the following phases: metric data acquisition, realization of the geometric model, element for the study and analysis of the spatial and volumetric distribution, mapping and texturing (photorealistic visualization).
Figure 11. 3D Model of Single-family house in Massagno, Switzerland.
3. THE SURVEY OF ARCHITECTURE
The survey can be defined as a set of activities that follow a reverse process to the design, in which starting from the existent are reconstructed through a complex action of investigation, the design criteria with which the artifact was designed, built and turned throughout the years, trying to reach its best and most reliable possible interpretation.
The representation, even in the survey, plays an important role in the aim to communicate effectively to the reader the knowledge deemed necessary for the understanding and documentation of the building. Modeling represents the most significant development for this purpose. From the prior knowledge given by the inspection and by infographic existing documentation, we go on collecting measures and then we obtain the graphic rendering of the architecture with artifacts that constitute a system of representation, which shows, in analytic and synthetic terms, all the results derived from previously carried out activities. So from the direct and indirect acquisition of metric data (with the integrated use of different measurement techniques) we can obtain are two-dimensional and three-dimensional graphics, that represent the most reliable morphological record of the product.
Figure 12. Eidotipo (the Basilica of San Pietro in Vincoli in Rome).
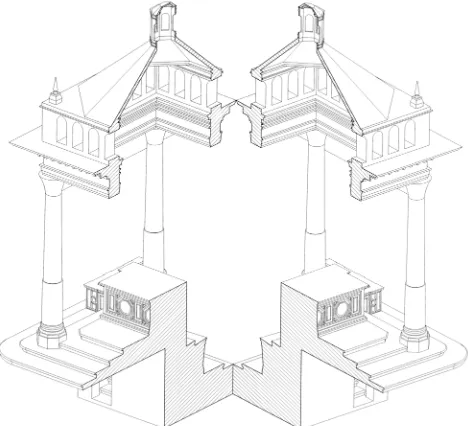
Figure 13. Views of the digital model regarding the baldachin (Basilica of San Pietro in Vincoli in Rome).
Figure 14. Axonometric View of the baldachin (Basilica of San Pietro in Vincoli in Rome).
Figure 15. View of the model in wireframe (Basilica of San Pietro in Vincoli in Rome).
Figure 16. Axonometric view of the access ramp to the crypt (the Basilica of San Pietro in Vincoli in Rome).
Figure 17. Axonometric view of the carpentry.
The discretization of physical reality, continuous and objective, is reached through the creation of a numerical model derived from the survey operations. This model is translated into a reliable, measurable and verifiable mathematical model of geometric shapes. This representation model is the most reliable and truthful interpretation of reality.
At present, digital technologies allow us to measure the three-dimensional coordinates of points belonging to the areas identified through the development of point clouds, from which it is possible to obtain polyhedral models with triangular faces called mesh. Given these polyhedral models, we can derive mathematical models that describe the object continuously by means of equations, rather than as a repository of coordinates of points. The first three-dimensional scans of the surveyed architecture originated with the stereo-detection operations that could generate a virtual three-dimensional model called
"stereomodello". The three-dimensional mathematical models, properly developed, aim to the testing and integration of different detection, processing and drawback techniques, since they are the product of a complex process of harmonization of all the measurements made.
After generating the surface, the model can be displayed in wireframe, shaded or textured model. The different representations derived from it are merely different aspects of the same model that is the same form that the detector had to know. Once the digital model of the entire building structure, or of its part under survey, is built, it is also possible to realize split perspectives that recreate realistic views. From the three-dimensional model is of course possible to easily obtain two-dimensional views with simple projections (prospects) or cuttings (for plans and sections).
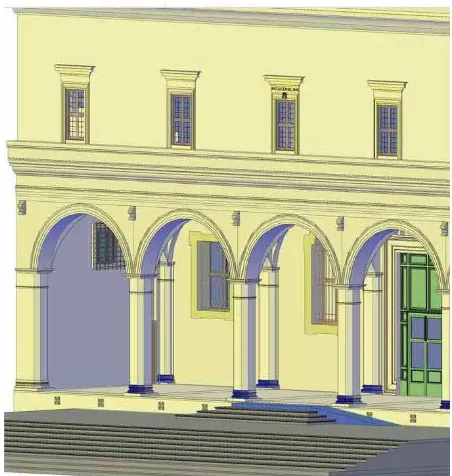
Figure 18. Axonometric view of the façade of the faculty of Engineering.
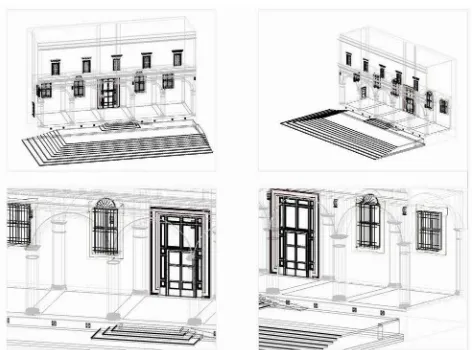
Figure 19. View of the model in wireframe of the entrance of Basilica of San Pietro in Vincoli in Rome.
Figure 20. Axonometric view of the virtual model of the entrance of Basilica of San Pietro in Vincoli in Rome
Figure 21. Axonometric view of the virtual model of the entrance of Basilica of San Pietro in Vincoli in Rome
Figure 22. Detail view of the virtual model of the entrance of Basilica of San Pietro in Vincoli in Rome
Figure 23. Detail view of the virtual model of the entrance of Basilica of San Pietro in Vincoli in Rome
Figure 24. Detail view of the virtual model of the entrance of Basilica of San Pietro in Vincoli in Rome
The images reported are taken from the examination scripts made by students with computer techniques (fig.12,13,14,15,16,17,18,19,20,21,22,23,24). The students, divided into working groups, operated inside the Basilica of San Pietro in Vincoli in Rome and in the former convent. The examination scripts report partial three-dimensional models which can be assembled together and are characterized by different levels of synthesis appropriately tailored to the scale chosen.
4. CONCLUSIONS
Major headings The increasing popularity of three-dimensional restitution software is a confirmation of the need to use these graphic processing as they offer a range of services to create three-dimensional graphic life for ideas, projects, and information acquired. 3D applications provide the ability to work directly with the volume of solid objects in the three-dimensional geometric space, as a metaphor of reality. This makes the idea of how complex, but also of how graphically exhaustive, a three-dimensional representation can be. The benefits which derive from these calculations can easily be imagined. They can be observed both in the field of analysis and in the field of survey, demonstrating if necessary, their fundamental and irreplaceable value. It is therefore clear that the realization of a digital model helps also to check the consistency of conventional representations (plan, section, elevation) and of the dimensional values provided (in case of design) or registered (in case of survey).
The purposes of three-dimensional representation, established during these courses, allow to define better the style and manner of use of the representation of 3D models that can be mounted in movies or shown through a collection of pictures and submitted on paper (brochures, posters, prints) or on optical devices (CD-Rom, DVD, etc.).
References
Cundari, C., Carnevali L., (a cura di) Il disegno per l’analisi dell’architettura, in: Quaderni didattici della 1° Cattedra di Disegno dell’Architettura della facoltà di Ingegneria dell’Università degli Studi “La Sapienza” di Roma ed. Kappa, Roma 1998;
Cundari, C., Carnevali L., (a cura di), Il Laboratorio di Disegno dell’Architettura, Università di Roma “La Sapienza” Dipartimento di Rappresentazione e Rilievo, in: Quaderni didattici della 1° Cattedra di Disegno dell’Architettura, n.2, ed. Kappa, Roma 1997.
Quaestio. Studi e Ricerche per il Disegno e la Documentazione dei Beni Culturali. nn. 0, 1 ed. Kappa.
Quaestio. Studi e Ricerche per il Disegno e la Documentazione dei Beni Culturali. nn. 3-4 Anno III- Dicembre 2000 Edizioni Kappa.
Cundari, C., Carnevali L., Il Disegno nel Corso di Laurea in Ingegneria Edile/Architettura. Documenti dall’attività didattica e dai laboratori progettuali, (CD-Rom a cura di), Edizioni Kappa, Roma 2003.
Cundari C., Disegno. Ragioni, fondamenti, applicazioni, Edizioni Kappa, Roma, 2006