TIME SERIES ANALYSIS OF PRIMARY PRODUCTIVITY ALONG THE EAST COAST
OF INDIA USING OCEANSAT-2 OCEAN COLOUR MONITOR (OCM)
E. Lakshmia, Deva Pratapa, P. V. Nagamanib, K. H. Raob, T. Preethi Lathab, S. B. Choudhuryb
KEY WORDS: Primary Productivity, VGPM model, OCM-2, MODIS-a Comparison
ABSTRACT:
Primary Productivity is the ultimate source of energy for all organisms in an ecosystem. It is associated with the food production and the global carbon cycle. Sensors on remote platforms (satellites) are capable of estimating the Chlorophyll-a concentration in surface waters by measurement of spectral changes of the upwelling light. From these data, which connected with other remotely sensed data, it is possible to use algorithms to estimate the primary production. In this paper, an initial attempt is made to estimate the Primary Productivity along the east coast of India. Vertically Generalized Productivity Model (VGPM) which is a depth (euphotic depth) integrated model is used for the estimation. The common input variables or geophysical parameters used for the model are chlorophyll-a concentration (chl-a), vertically diffuse attenuation coefficient (Kd-490), Photosynthetically Available Radiation (PAR), and Sea Surface Temperature (SST). The chlorophyll-a and Kd-490 parameters were estimated using Oceansat-2 OCM data whereas PAR and SST were taken from MODIS-aqua data. Oceansat-2 Ocean Colour Monitor (OCM) data for the year 2013 is used in the analysis to compute the primary productivity using the weekly (8-day) data products of all the parameters as mentioned above. These products were inter compared with the MODIS Weekly (8-day) Primary Productivity products which were estimated at a global scale using the modified Vertically Generalized Productivity Model (VGPM) with which uses the exponential function of Sea surface temperature (SST).
1. INTRODUCTION
Phytoplankton is at the bottom of the food chain: they create fresh organic matter from dissolved nutrients, carbon dioxide and energy from sunlight (by the processes of photosynthesis or chemosynthesis). When either system is employed, it creates organic matter from inorganic compounds and carbon dioxide. The creation of organic matter from inorganic compounds is called primary production. Sunlight is rapidly absorbed in seawater so primary production is confined to the upper 200m of the water column. This region where photosynthesis is viable is called the euphotic layer. The primary producers in the ocean are phytoplankton, single cells or colonies of cells living freely in the water column. The production of organic carbon, referred to as primary production, depends upon several factors: the abundance of chlorophyll-a and irradiance, the availability of essential nutrients and temperature. Primary production varies strongly varies with the abundance of chlorophyll-a. More chlorophyll-a means more light energy harvested and more organic molecules produced.
One of the main applications of ocean-colour data has been in the computation of primary production at large scales, using remotely-sensed fields of phytoplankton biomass (Platt et al.,1988, Longhurts et al.,1995, Antonie et al., 1996, Beherenfeld et al., 1997). An estimation of primary production (PP) from ocean colour remote sensing is relevant for the study of the carbon cycle and its sensitivity to global change. (Beherenfeld et. al., 2006). A productivity model using remotely sensed chlorophyll-a and temperature suggests that primary productivity is largest in the coastal seas, over parts of tropics and the high latitudes, while primary productivity is lower in the subtropical gyres and parts of the southern ocean. (Beherenfeld et.al., 1997). The present study aims at variation of the spatial and temporal variability of primary
productivity in the East Coast of India during 2013 using available OCM-2 and MODIS-aqua data. Various range of modelling approaches are exist to estimate the primary productivity over regional or global scale (Behrenfeld et.al 1997a, Antoine and Morel 1996, Platt and Sathyendranath 1993, Megard 1972, Balch et al. 1992, Ryther and Yentsch 1957). These models can be distinguished by the degree of explicit resolution in depth and irradiance (Behrenfeld et.al 1997b).
The main objectives of the study are (i) to estimate the Primary Productivity (PP) (hereafter it is mentioned as PP in the entire manuscript) using depth integrated algorithm with OCM-2 data over East Coast of India during 2013 (ii) to study the variability of PP over the study region in the year 2013 and (iii) regional based inter comparison of PP of OCM-2 and MODIS.
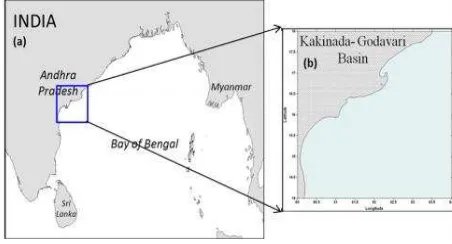
2. STUDY AREA
reversing monsoons, depression and severe cyclonic storms. It is region of positive water balance as enormous amounts of fresh water both from precipitation and river run off from major rivers, such as the Ganges, Brahmaputra, Godavari, Mahanadi, Cauvery, Irrawaddy and Krishna are added. The fluvial inputs are major sources of nutrients to the Bay of Bengal. Nutrients which may be brought in by the river are thought to be lost to deep waters of the Bay because of its narrow shelf. However, it is a cyclone-prone region and these episodic events are likely to churn-up large areas, facilitating nutrients injection to the shallow euphotic zone and thereby enhancing primary production, at least sporadically. Prasanna Kumar et al. 2002 suggested that the primary production in the Bay of Bengal is strongly controlled by the availability of nutrients. The Bay of Bengal is traditionally considered to be a region of low biological productivity because of light inhibition resulting from turbidity and cloud cover (Madhupratap et al., 2003).
Figure 1. (a) Map showing the study area Bay of Bengal, East coast of India and (b) Kakinada coast (Godavari Basin)
2. MATERIALS AND METHODS
2.1 Data
The 8-day composites of Chlorophyll-a-a, Vertically diffuse attenuation coefficient Kd-490 from OCM-2 and Sea Surface Temperature (SST), Photosynthetically Available Radiation (PAR) from MODIS-aqua of 4Km resolution for the period of 2013 were taken to estimate the primary productivity over East Coast of India. MODIS data sea surface temperature and photosynthetically available radiation are archived from oceancolor.gsfc.nasa.gov. In the regional based comparison of PP from OCM-2 in the Kakinada coast the estimated PP data from OCM-2 for the region was gridded to 1x1 degree resolution along with MODIS data.
2.1.2 Data processing of OCM-2 data product: OCM-2 being a global sensor provides high resolution chlorophyll-a products for global ocean colour applications. Hence, there is a need to generate the ocean colour products compatible with the other contemporary global ocean colour sensor's data in terms of processing platforms, atmospheric correction strategies, thresholds, flags and other stringent components like sun glint correction. SeaWiFS Data Analysis System (SeaDAS), which is a comprehensive image analysis package for the processing, display, analysis and quality control of ocean color data developed and supported by NASA (http://seadas.gsfc.nasa.gov). SeaDAS supports the previous, current and upcoming ocean colour sensors like SeaWiFS, MODIS, OCTS, CZCS, MERIS, VIIRS and OCM-2 as well. Hence a level-1B data product of OCM-2 contains spectral radiance for each band which is radiometrically corrected of 360m resolution and the present processing sequence of OCM-2 in SeaDAS involves the conversion of level1b (L1B) data to level2
(L2) format and also from level2 (L2) to level3 (L3) format. The process of generating the L2 products involved with different processing methods along with atmospheric correction, flagging and masking with appropriate thresholds for cloud, land and glint affected areas / pixels, a correction of suitable algorithm will be applied to the raw radiances from the L1B datasets for the scene/area. The derived water leaving radiances data are then used as input for the different bio-optical algorithms for the retrieval of chlorophyll-a concentration (OC4-V4) (O’ Reilly et al., 1998) and Kd-490. The Chlorophyll-a and Kd_490 are retrieved from L2 files which are used as an input for the Vertically Generalized Production Model (VGPM). After generating the level-2 Geophysical data products, this package can be used to generate the level-2 spatially binned products for 500m to a coarse resolution of 4km and then level-3 binned products for weekly to yearly depending on the necessity of the products that needs to be evaluated. Here, the MODIS-aqua SST and PAR considered as 4km resolution, OCM-2 data such as Chlorophyll-a and Kd_490 are binned into 4km to estimate PP using the VGPM model. In this paper, the PP estimated from OCM-2 for the year 2013 was compared with MODIS and also inter comparison for a small region of Kakinada coast in the Bay of Bengal, the estimated PP from OCM-2 is compared with MODIS PP.
2.2 Primary Productivity Model
2.2.1 Vertically Generalized Production Model (VGPM): Vertically Generalized Production Model (VGPM) is proposed by Behrenfeld and Falkowski (1997) which is widely used to estimate primary production as it can be determined by the all possible parameters retrieved from satellite data. VGPM describes about the relationship between the depth integrated primary productivity and maximum carbon fixation rate within the water column, sea surface PAR, surface chlorophyll-a concentration, euphotic depth and photoperiod. The primary productivity is calculated as,
PPeu= 0.66125. PBopt. . Zeu. Copt. Dirr. (1)
Where, PPeuis the Daily C fixed primary production integrated
from the surface to Zeu(mg C m -2
), PBoptis Maximum C fixation
rate within a water column (mg C (mg CHL)-1h-1), E0Daily Photosynthetically Active Radiance (PAR) (mol quanta m-2), Zeu is the Euphotic depth (m) , C is the Chlorophyll-a
concentration at PBopt(mg Chl m-3) , Dirr is the Daylength or
Photoperiod (decimal h).
Using the VGPM model, and by implementing various PBopt
methods considering the different parameters such as temperature and chlorophyll-a which plays an important role in the process of photosynthesis were used for the estimation of PP. Behrenfeld and Falkowski (1997) defined PBoptas a function
of temperature. The PP in VGPM model is estimated which depends on the empirical relationship of SST and PBopt,
represented as seventh-order polynomial function. The other PBoptmethod of Ryther et.al 1957, Megard 1972 described it as
a function of chlorophyll-a-a concentration and SST.
3. RESULTS AND DISCUSSION
3.1 Comparison of PP from OCM-2 with MODIS
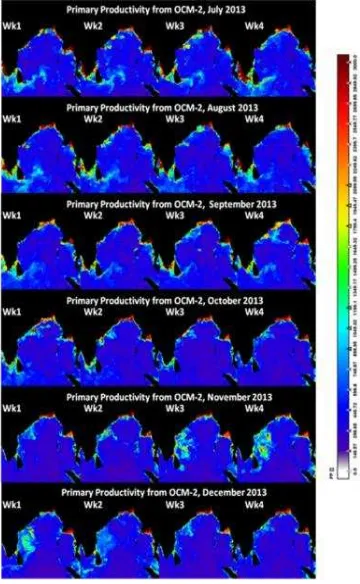
from MODIS Chlorophyll-a as an input for the period of 48 weeks is shown in figure 4 (a) & (b). The 8-day (weekly) Primary Productivity products(Figure 3 (a), (b)) were derived from OCM-2 data using the two PBoptmethods of Megard 1972 Ryther et.al 1957
using temperature and chlorophyll-a as the basic parameter in the VGPM model. Using Megard 1972 method, the PP ranges from 845 to 1088 mg C/m2/day and by using the Ryther et.al 1957 method the PP range from 650-857 mg C/m2/day. The minimum PP is observed in the month of April with an increasing trend from May to July with a maximum value of 757 mg C/m2/day. From July onwards the PP has decreased up to November. The monthly averaged PP values from OCM-2 for all the months in the year 2013 were compared with MODIS monthly averaged PP is showing a similar trend (Figure 2) with low PP during the pre-monsoon and very high during the pre-monsoon and again low values of PP in the post-monsoon period. Though the PP estimated from OCM-2 is following the trend of MODIS but the magnitude of PP from OCM-2 is showing high values compared to the MODIS may due to the processing methodologies adopted.
Figure 2. Comparison of monthly averaged PP of OCM-2 and MODIS for the year 2013
Figure 3 (a). OCM-2 PP 2013 weekly data (January- June)
Figure 4 (a). MODIS PP, 2013 weekly data (January–June)
Figure 4 (b). MODIS PP 2013 weekly data (July-December) 3.2 Inter-comparison of PP at regional scale
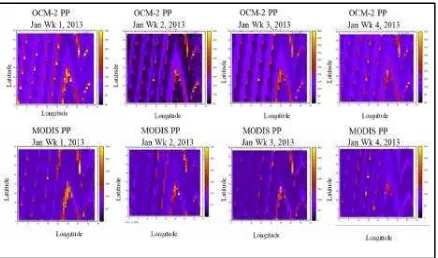
Primary productivity of OCM-2 is evaluated for Kakinada region in the month of January 2013 using VGPM model is shown in Figure 5. In order to raise the performance of the model, it is
necessary to gather more primary production data (Kameda et.al 2005). However, the application of any of the VGPM algorithm leads to higher estimates of PP because the calculation is based on standard global Chlorophyll-a ocean colour product scales (Malgorzata et.al 2013).
Gridding has been done for the study region of Kakinada in order to take the collocated points from two different datasets. As the MODIS data is taken at a resolution of 9km, the gridding is done same as 9km for OCM-2 data. The graph in Figure 6 shows that the correlation coefficient for each week in the month of January 2013 with 0.5-0.6 correlation (r) and a grid plot for MODIS PP and OCM-2 PP in the pixel range are plotted as shown in Figure 7 representing similar features in each week of January 2013.
The result of OCM-2 PP shows that there is consistent variation over the four weeks of January 2013 which is shown in Figure 5. Along the coastal region, the value of primary productivity is seems to be high in the range of 1000-1500 mg C/m2/ day and in open ocean is in the range of 300-800 mg C/m2/day whereas in MODIS, the value of primary productivity varies highly from 1200-2200 mg C/m2/day in coastal region and 500-1100 mg C/m2/day along the open ocean.
Figure 5. Primary productivity of OCM-2 from VGPM model
Figure 7. Gridded collocated points from OCM-2 PP and MODIS PP
4. CONCLUSIONS
The Primary Productivity of OCM-2 using VGPM has been estimated and compared with MODIS PP along the East coast of India for the year of 2013. PP of OCM-2 is evaluated in the VGPM model by considering the temperature and the chlorophyll-a parameter which is the main function of photosynthesis process. The results show that there is a similar trend followed among OCM-2 PP and MODIS PP. Comparison based on regional scale for the Kakinada region in the month of January (weekly) also showed a correlation of 0.6 between these two datasets of OCM-2 and MODIS. The high values in the OCM-2 estimated PP can be attributed to the variations in the algorithms used for estimating the chlorophyll-a concentration which goes as an input for the PP model and also depends on the processing methodology.
ACKNOWLEDGEMENTS
The authors are also thankful to Ocean colour site for providing the climatology data and SeaDAS software package developed by NASA OBPG.
REFERENCES
Antoine, D., Andre, J. M., and Morel, A., 1996. Oceanic primary production 2. Estimation at global scale from satellite (coastal zone color scanner) chlorophyll-a. Global Biogeochemical Cycles, Vol. 10, pp. 57–69.
Behrenfeld, M. J. and P. G. Falkowski., 1997a: Photosynthetic rates derived from satellite-based chlorophyll-a concentration. Limnol. Oceanogr., Vol.42, pp.1–20
Behrenfeld, M.J., O’Malley, R.T., Siegel, D.A., McClain, C.R, Sarmiento, J.L., Feldman, G.C., Milligan, A.J., Falkowski, P.G., Letelier R.M., & Boss, E.S., 2006. Climate driven trends in contemporary ocean productivity. Nature ., Vol 444, pp. 725-755.
Behrenfeld, M.J and Paul G. Falkowski 1997b., A consumer’s guide to phytoplankton primary productivity models. Limnol. Oceanogr., Vol 42, pp.1479-1491.
Cullen, J. J., 1990. On models of growth and photosynthesis in phytoplankton. Deep-Sea Res., Vol. 37, pp. 667-683 .
Eppley, R. W. 1972., Temperature and phytoplankton growth in the sea. Fish. Bull., Vol 70, pp. 1063–1085.
Kameda, T., Ishizaka, J., 2005. Size-Fractionated Primary Production Estimated by a Two-Phytoplankton Community Model
Applicable to Ocean Color Remote Sensing. Journal of Oceanography, Vol. 61, pp. 663–672.
Longhurst, A., Sathyendranath, S., Platt, T., and Caverhill, C., 1995. An estimate of global primary production in the ocean from satellite radiometer data. Journal of Plankton Research, Vol. 17, no. 6, pp. 1245–1271.
Małgorzata, S., Agata, Z., 2013. Comparison of primary productivity estimates in the Baltic Sea based on the DESAMBEM algorithm with estimates based on other similar algorithms. Oceanologia, Vol 55, pp. 77-100.
Megard, R. O., 1972. Phytoplankton, photosynthesis and phosphorus in Lake Minnetonka, Minnesota. Limnol. Oceanogr., Vol. 17,pp. 68-87.
oceancolor.gsfc.nasa.gov.in
Platt, T., and Sathyendranath, S., 1988. Oceanic primary production: Estimation by remote sensing at local and regional scales. Science, Vol. 241, pp. 1613–1620.
Platt, T., Sathyendranath, S., 1993. Estimatiors of primary productivity for interpretation of remotely sensed data on ocean color. Journal of Geophysical Research, Vol. 98, pp.14561-14567.