QUALITY ASSESSMENT IN RIVER NETWORK GENERALISATION BY
PRESERVING THE DRAINAGE PATTERN
L. Zhang*, E. Guilbert
Dept. of Land Surveying and Geo-Informatics, the Hong Kong Polytechnic University,
Hung Hom, Kowloon, Hong KongKEY WORDS: river network, generalisation, quality assessment, drainage pattern, fuzzy logic
ABSTRACT:
The drainage pattern of a river network is the arrangement in which a stream erodes the channels of its network of tributaries. It can reflect the geographical characteristics of a river network to a certain extent, because it depends on the topography and geology of the land. Whether in cartography or GIS, hydrography is one of the most important feature classes to generalise in order to produce representations at various levels of detail. Cartographic generalisation is an intricate process whereby information is selected and represented on a map at a certain scale, not necessarily preserving all geographical or other cartographic details. There are many methods for river network generalisation, but the generalized results are always inspected by expert cartographers visually. This paper proposes a method that evaluates the quality of a river network generalisation by assessing if drainage patterns are preserved. This method provides a quantitative value that estimates the membership of a river network in different drainage patterns. A set of geometric indicators describing each pattern are presented and the membership of a network is defined based on fuzzy logic. For each pattern, the fuzzy set membership is given by a defined IF-THEN rule composed of several indicators and logical operators. Assessing the quality of a generalisation is done by comparing and analysing the value before and after the network generalisation. This assessment method is tested with several river network generalisation methods on different sets of networks and results are analysed and discussed.
* Corresponding author.
E-mail addresses:[email protected] (L. Zhang), [email protected] (E. Guilbert). 1. INTRODUCTION
Automated map generalisation is always an important issue and major challenge in the research of cartography and GIS. Regarded as the skeleton of the terrain, the drainage system should be considered in research on automated map generalisation in the first place. Further, as the most important component of the drainage system, generalisation of rivers properly becomes a focal point. There are several reasons: (1) rivers are an important part of the land, and needs to be represented in maps of any kind; (2) rivers are fundamental concepts used for various analyses in geo-science. For instance, geologists can get original slope and original structure from drainage patterns. As a set of line features, river networks are generalized from a large scale to a small scale in two main steps: selective omission and selected tributaries simplification (Li, 2007). There are many methods for selective omission and simplification of tributaries for rivers selected as individual line features, but while most research focuses on river networks during the generalisation, generalized results are always inspected by expert cartographers visually. Considering map generalisation from geographic level first (Ai et al., 2006; Poorten and Jones, 2002), drainage patterns can be applied in river network generalisation as patterns are important in generalisation and should be explicitly measured and evaluated (Mackaness and Edwards, 2002).
At present, many researchers have started to pay attention to geographical features of river networks during the process of generalisation (Ai et al., 2006; Buttenfield et al., 2010;
Stanislawski, 2009), which follows the idea of “generalization is not a mere reduction of information – the challenge is one of preserving the geographic meaning” (Bard and Ruas, 2005). Considering drainage pattern as a geographical factor in river network generalisation helps to retain geographical features of the networks. There are several types of drainage patterns. They are commonly classified as dendritic, parallel, trellis, rectangular, radial, centripetal and reticulate patterns (Ritter, 2006). Dendritic patterns, also named tree-like patterns, can usually be found where there is no strong geological control (Charlton, 2008). Parallel, trellis and rectangular drainage patterns develop in areas with strong regional slopes but have their own specific characteristics. Streams radiating from a high central area form a pattern of radial drainage while streams forming a centripetal one gather in low-lying land. Reticulate drainage patterns are usually found on floodplains and deltas where rivers often interlace with each other (Fagan and Nanson, 2004). The first three drainage patterns are illustrated in Figure 1.
From the literature, little research drew attention in the aspect of the assessment of generalisation (Bard, 2004; Joao, 1998; Muller et al., 1995; Weibel and Dutton, 1999). Traditionally, generalisation is evaluated by visual assessment by the cartographic experts to grade the quality by questionnaires (Weibel, 1995). This method is based on knowledge and experience, and it is rather subjective (Joao, 1998; Mackaness and Ruas, 2007). For quality assessment of river network generalisation, especially in selective omission, little work is International Archives of the Photogrammetry, Remote Sensing and Spatial Information Sciences, Volume XL-2/W1, 2013
available. The most relative one is the Coefficient of Line Correspondence (CLC) is calculated to evaluate the generalised data by comparing with existing data (Buttenfield et al., 2010; Stanislawski, 2009). CLC is given based on length only, which cannot assess the generalised river network comprehensively. Overall, the methods evaluating river network generalisation quality are not well developed, and visual assessment is still often used.
a. dendritic b. parallel c. trellis
Figure 1 Drainage network patterns (diagrams modified from Ritter, 2006)
In this paper, drainage patterns are applied to evaluate a generalised river network. Fuzzy logic is adopted in the method, where several indicators are used to quantify the features of drainage patterns. In this work, the dendritic, parallel, and trellis, patterns are addressed. In addition, this research focuses on the selective omission in river network generalisation as feature selection is the first step in any generalisation. In the section 2, the fundament of fuzzy logic is introduced. Section 3 provides the details of the evaluation method. Finally, the method is implemented and tested.
2. FUNDAMENTALS OF FUZZY LOGIC
Zadeh (1965) introduced the fuzzy logic in the proposal of fuzzy set theory. Fuzzy logic is composed of fuzzy sets, fuzzy operators and fuzzy rules.
2.1 Fuzzy set
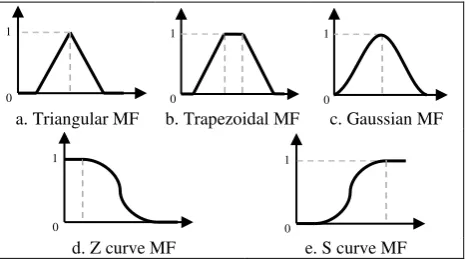
A fuzzy set is a set whose membership is not defined by a binary value (an element belongs or not to a set) but by a value between 0 and 1 corresponding to different grades of membership. A membership function (MF) associated with a given fuzzy set maps an input value to its appropriate membership value. There are five common membership functions in use as shown in Figure 2. Fuzzy set theory allows approximated reasoning on values which are imprecise or incomplete.
a. Triangular MF b. Trapezoidal MF c. Gaussian MF
d. Z curve MF e. S curve MF
Figure 2 Five common MFs
In this work, three of above MFs are used: Gaussian, Z and S curve MFs. They can be described mathematically as follows.
The Gaussian function is given as
2
The S curve MF is a mirror-image function of the Z curve,
2 operators respectively. For two fuzzy set values A and B within the range (0, 1), fuzzy logic operations are (Figure 3):
A AND B = min(A, B)
Figure 3 AND, OR and NOT operations 1 International Archives of the Photogrammetry, Remote Sensing and Spatial Information Sciences, Volume XL-2/W1, 2013
2.3 Fuzzy rule
Fuzzy rules, also called IF-THEN rules, are used to represent the conditional statements with fuzzy sets and fuzzy operators. A single fuzzy IF-THEN rule is like:
IF (a is X) THEN (b is Z)
where a is input variable, b is output, and X and Z are defined by fuzzy sets. Here, it should be noted that there is no ELSE part in a fuzzy rule.
Usually, there are several fuzzy rules for a fuzzy logic application. In the process, all rules should be evaluated, and the outputs must be combined in some way in order to get a final result, which is called aggregation. Especially for a fuzzy control system, defuzzification is typically needed, which is a process of producing a quantifiable result (Leekwijck and Kerre, 1999).
3. EVALUATION METHODS
3.1 Predicates and fuzzy rules
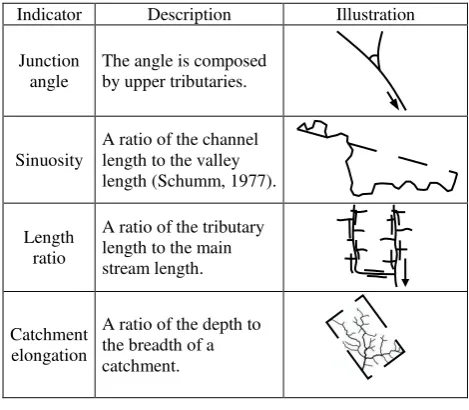
In the research, several indicators listed in Table 1 are used to perform the evaluation. The proposed indicators are the same in the drainage pattern recognition: average junction angle (α), bended tributaries percentage ( ), average length ratio ( ) and catchment elongation (δ) (Zhang and Guilbert, 2012). All these values are calculated from a river network.
Indicator Description Illustration
Junction angle
The angle is composed by upper tributaries.
Sinuosity
A ratio of the channel length to the valley length (Schumm, 1977).
Length ratio
A ratio of the tributary length to the main
Table 1 List of geometric indicators
Here, for each drainage pattern, a rule is defined to predict the pattern of a river network.
(1) IF (α IS acute) AND (δ IS broad) THEN pattern IS dendritic (2) IF (α IS very acute) AND NOT ( IS bended) AND ( IS long) AND ( IS elongated) THEN pattern IS parallel
(3) IF (α IS right) AND NOT ( IS bended) AND ( IS short) AND ( IS elongated) THEN pattern IS trellis
Therefore, eight predicates are formulated into membership functions. They are list Table 2.
Predicates MFs Examples
α IS acute
Table 2 Predicates in fuzzy rules 3.2 Evaluation method for each pattern
From the fuzzy rule and MFs introduced in last section, the evaluation method for each pattern can be given by integrating fuzzy operators. The detailed formulas for evaluating each pattern can be described as follows.
3.2.1 Dendritic pattern for an acute angle and a broad catchment respectively.
3.2.2 Parallel pattern
The degree of a parallel network is given as ( , , , ) min( ( ; , ), s(δ;a''',b''') are MFs for a very acute angle, a bended tributary, a long tributary and an elongated catchment, respectively. 3.2.3 Trellis pattern
For the trellis pattern, the degree can be calculated as ( , , , ) min( ( ; , ), short tributary and an elongated catchment, respectively. International Archives of the Photogrammetry, Remote Sensing and Spatial Information Sciences, Volume XL-2/W1, 2013
4. EXPERIMENTS AND RESULTS
4.1 Experiment design
4.1.1 Strategies to be tested
In the tributary selection problem, there are two key issues involved: (1) how many river tributaries are selected? (2) Which ones are selected?
For the first issue, a classical principle of selection (Topfer and Pillewizer, 1966), which is so-called “Radical Law”, was enunciated by F. Topfer in 1961. The method is described as follows:
a
f a
f
M n n
M
(8)
where nf is the number of objects shown at the smaller scale Mf, and na is the number of objects shown at the larger scale Ma. For the second issue, in the experiment, in order to assess a river network whether keeping the same drainage pattern after generalising from a large scale to a small one, four generalisation strategies are tested (Table 3). First two are based on hierarchy, and the last one is the manual generalised data.
No. Strategies
1 Horton-Strahler order + Length (Rusak Mazur and Castner, 1990)
2 Watershed partitioning (Ai et al., 2006) 3 Generalised manually
Table 3 Testing on three strategies
The first strategy is to select river tributaries based on order first, and then the shorter tributaries will be eliminated first if they are in the same order. It is illustrated in Figure 4.
Figure 4 Lower order streams not preserved
The second strategy is proposed by Ai et al. (2006). This method focuses on the decision of channel importance during the river network generalisation applying the integrated hydro-graphic concept, namely watershed area to replace several geometric parameters of river feature. An example of the hierarchical watershed partitioning is shown in Figure 5.
Figure 5 Hierarchical partitioning of river catchment 4.1.2 Testing data
Russian river datasets are tested in the experiment. Two different scales are used in experiments: 1:24,000-scale (24K) and 1:100,000-scale (100K). For the small scale data, it is provided by the National Hydrography Dataset (NHD) of USA. From the history of the establishment of the NHD, the medium resolution data is built first, and then a conflation tool is used to help generate the 24K hydrological data from the medium resolution data. The medium resolution in the NHD data is at 100K. Therefore, the 100K data is not generalised from 24K, it is built manually. The Horton-Strahler order scheme was then computed.
4.2 Case studies in Russian river
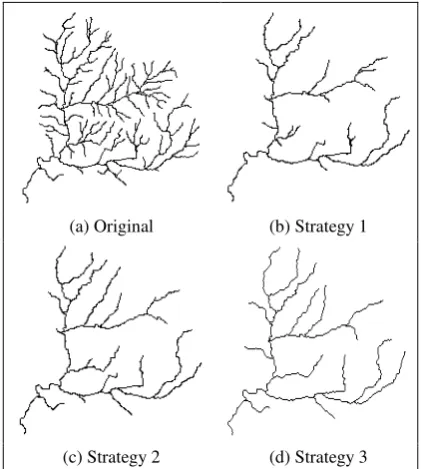
(1) Case 1: The first tested river network is illustrated in Figure 6(a), which is dendritic network with membership value of 0.933. Figure 6(b), (c) and (d) show the result of the generalisation strategy 1, 2 and 3 respectively.
(a) Original (b) Strategy 1
(c) Strategy 2 (d) Strategy 3 Figure 6 Generalised river network for dendritic case In Figure 6, all generalised results are good, but (d) is better than (b) and (c) by visual checking because (d) looks more balance. River network (b) has more short tributaries due to the shortage of the method.
Number
Order
No. Indicator Membership Value
α δ D P T R
53.24° 3.68% 0.69 1.14 0.933 0.010 0.001 0.001 1 61.56° 2.70% 0.71 1.16 0.729 0 0.013 0.002 2 61.52° 8.57% 0.59 1.16 0.730 0 0.013 0.015 3 59.47° 8.11% 0.64 0.99 0.793 0 0 0.010
Table 4 Assessment result of dendritic case
Table 4 provides the assessment result of the first case study, and it shows the same findings with the visual assessment. All generalised river networks preserves the dendritic pattern, and the membership values are 0.729, 0.730 and 0.793 of strategies 1, 2 and 3, respectively. The membership value (0.793) of the river network generalised manually is greater than other results. Strategy 3 brings a better result in this case study.
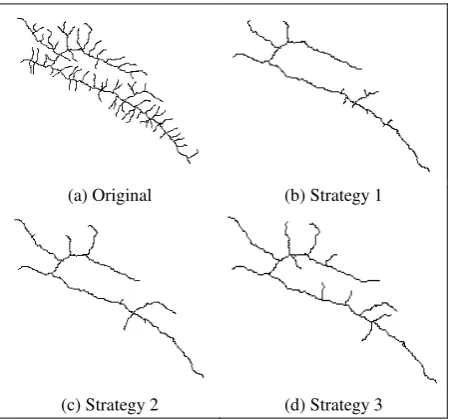
(2) Case 2: The second case study is in Figure 7(a). This river network is also a portion of the Russian river, which is arranged as the trellis pattern.
(a) Original (b) Strategy 1
(c) Strategy 2 (d) Strategy 3 Figure 7 Generalised river network for trellis case From the generalised river network in Figure 7(b), although it is not a satisfied result, it has more features of the trellis pattern due to the short preserved tributaries. The generalised network (c) in Figure 7 has more long tributaries left because they have lager catchment. The manual generalised network (d) is good by visual assessment.
No. Indicator Membership Value
α δ D P T R
81.14° 1.49% 0.20 3.17 0 0 0.675 0 1 100.68° 3.33% 0.18 3.29 0 0 0.565 0 2 98.83° 3.85% 0.25 3.09 0 0 0.677 0.003 3 86.38° 4.35% 0.28 3.65 0 0 0.842 0.004
Table 5 Assessment result of trellis case
In Table 5, from the assessment result, all results are preserved the trellis pattern. Strategy 2 gets the greater membership (0.677) of the trellis pattern than strategy 1 (0.565). The manual generalised river network is better than others, because its membership value is 0.842 that is the greatest of all generalised networks.
(3) Case 3: The river network tested in this experiment is a parallel river network. It is shown in Figure 8(a).
(a) Original (b) Strategy 1
(c) Strategy 2 (d) Strategy 3
Figure 8 Generalised river network for parallel case In Figure 8, visually, the shape of network (b) is more similar to a parallel network, because the tributaries in the dashed box of network (b) provide a better general representation than network (c). Network (b) and (d) are almost the same, and all generalised results are acceptable.
No. Indicator Membership Value
α δ D P T R
39.67° 10.53% 0.69 3.14 0 0.792 0 0 1 34.02° 15.38% 0.81 3.86 0 0.929 0 0 2 41.15° 15.38% 0.57 3.43 0 0.632 0 0 3 27.63° 0% 0.81 4.84 0 0.926 0 0
Table 6 Assessment result of parallel case
From Table 6, memberships of each strategy are 0.929, 0.632 and 0.926 respectively. Strategy 1 provides a better result because the membership value (0.929) is greater than others, but it is nearly same as 0.926 from strategy 3. The possible reason is the data from the NHD are smoother, such as the tributary in the dashed circle in Figure 8(d). This result is confirmed by visual assessment.
5. CONCLUSIONS
In this paper, a quality assessment method based on fuzzy logic is provided to evaluate a generalised river network by the tributary selection operation. The method was applied on case studies from the Russian river basin, and results were discussed. From the experiments, the membership value is greater, the generalised river network is better. This method is appropriate for evaluating a generalised river network from the aspect of the drainage patterns. The advantage of this research is that evaluating a generalised river network based on fuzzy logic is easy to understand and implement. The limitation is that the validation is based on cased studies, and more tests should be done in the future. For the future work, the first one is to test the membership value during the generalisation process; the second one is to develop the method to cover more drainage patterns, such as reticulate, radial, and centripetal patterns, in the quality assessment.
6. REFERENCES
Ai, T., Liu, Y., Chen, J., 2006. The Hierarchical Watershed Partitioning and Data Simplification of River Network. In: Riedl, A., Kainz, W., Elmes, G.A. (Eds.), Progress in Spatial Data Handling. Springer Berlin Heidelberg, pp. 617–632.
Bard, S., 2004. Quality Assessment of Cartographic Generalisation. Transactions in GIS, 8, pp. 63–81.
Bard, S., Ruas, A., 2005. Why and how evaluating generalised data? In: Developments in Spatial Data Handling. Springer, Berlin Heidelberg.
Buttenfield, B.P., Stanislawski, L. V, Brewer, C.A., 2010. Multiscale representations of water: Tailoring generalization sequences to specific physiographic regimes. Proceedings of GIScience 2010, pp. 14–17.
Charlton, R., 2008. Fundamentals of fluvial geomorphology. Psychology Press.
Fagan, S.D., Nanson, G.C., 2004. The morphology and formation of floodplain-surface channels, Cooper Creek, Australia. Geomorphology, 60, pp. 107–126.
Joao, E., 1998. Causes and consequences of map generalisation. Taylor & Francis, London.
Leekwijck, W. Van, Kerre, E.E., 1999. Defuzzification: criteria and classification. Fuzzy Sets and Systems, 108, pp. 159–178.
Li, Z., 2007. Algorithmic foundation of multi-scale spatial representation. CRC.
Mackaness, W., Edwards, G., 2002. The importance of modelling pattern and structure in automated map generalisation. In: Joint Workshop on Multi-Scale Representations of Spatial Data. Ottawa.
Mackaness, W., Ruas, A., 2007. Evaluation in the map generalisation process. In: Generalisation of Geographic
Information : Cartographic Modelling and Applications. Elsevier, Amsterdam, pp. 89–111.
Muller, J., Weibel, R., Lagrange, J., Salge, F., 1995. Generalization: State of the art and issues. In: GIS and Generalization: Methodology and Practice. Taylor & Francis, London, pp. 3–17.
Poorten, P.M. Van Der, Jones, C.B., 2002. Characterisation and generalisation of cartographic lines using Delaunay triangulation. International Journal of Geographical Information Science, 16, pp. 773–794.
Ritter, M.E., 2006. The physical environment: An introduction to physical geography.
Rusak Mazur, E., Castner, H.W., 1990. Horton’s ordering scheme and the generalisation of river networks. Cartographic Journal, 27, pp. 104–112.
Schumm, S.A., 1977. The fluvial system. Publ. by: Wiley-Interscience.
Stanislawski, L. V, 2009. Feature pruning by upstream drainage area to support automated generalization of the United States National Hydrography Dataset. Computers, Environment and Urban Systems, 33, pp. 325–333.
Topfer, F., Pillewizer, W., 1966. The Principles of Selection.
Cartographic Journal, 3, pp. 10–16.
Weibel, R., 1995. Three essential building blocks for automated generalization. In: GIS and Generalization: Methodology and Practice. Taylor & Francis, London, pp. 56–69.
Weibel, R., Dutton, G., 1999. Generalising spatial data and dealing with multiple representations. In: Longley, P., Goodchild, M., Maguire, D., Rhind, D. (Eds.), Geographical Information Systems: Principles, Techniques, Management and Applications. pp. 125–155.
Zadeh, L.A., 1965. Fuzzy sets. Information and control, 8, pp. 338–353.
Zhang, L., Guilbert, E., 2013. Automatic draiange pattern recognition in river networks. International Journal of Geographical Information Science. (accepted)