2
2012
PAKEJ SOALAN
RAMALAN MC 2012
MATHS SPM
MATHEMATICS
KANDUNGAN
BAHAGIAN A
A. Sinopsis Pakej Soalan Ramalan Matematik SPM Maths Catch.
3
B. Analisis Soalan Peperiksaan Matematik Sebenar SPMKertas 1
4
C. Analisis Soalan Peperiksaan Matematik Sebenar SPM Kertas 2
5
BAHAGIAN B
EDISI MID TERM
1. Pakej Soalan Ramalan Edisi „Mid Term‟ Khas – Pilihan 1
6
2. Pakej Soalan Ramalan Edisi „Mid Term‟ – Pilihan 2
23
3. Pakej Soalan Ramalan Edisi „Mid Term‟ – Pilihan 3
34
EDISI GEMPUR
4. Pakej Soalan Ramalan Edisi Gempur Khas – Pilihan 1
45
5. Pakej Soalan Ramalan Edisi Gempur – Pilihan 2
62
EDISI NEGERI
6. Pakej Soalan Ramalan Edisi Negeri Khas – Pilihan 1
72
7. Pakej Soalan Ramalan Edisi Negeri – Pilihan 2
88
EDISI AKHIR
8. Pakej Soalan Ramalan Edisi Akhir Khas – Pilihan 1
98
9. Pakej Soalan Ramalan Edisi Akhir – Pilihan 2
115
EDISI KHAS
10. Pakej Soalan Ramalan Edisi Khas – PILIHAN 1
126
2012
1. PAKEJ SOALAN RAMALAN EDISI “MIDTERM”
KHAS UNTUK PERSIAPAN --> PEPERIKSAAN PERTENGAHAN TAHUN 2012
Edisi “Mid Term” ini merupakan satu bentuk cadangan set soalan supaya pelajar dapat membuat PERSEDIAAN KHUSUS bagi menjawab dengan baik ketika Peperiksaan Pertengahan Tahun nanti.
Mengandungi 3 set soalan Ramalan Utama iaitu :
Set Soalan Ramalan Edisi “Mid Term” KHAS PILIHAN 1 , PILIHAN 2 dan PILIHAN 3
Set Soalan ini Mengandungi Gabungan dari semua bab Tingkatan 1-3 ,Tingkatan 4 dan 7 bab pertama Tingkatan 5.
Soalan yang dipilih merupakan Soalan dari analisis Peperiksaan Sebenar SPM 2005-2010 terdahulu,analisis Soalan percubaan negeri seluruh Negara serta contoh-contoh Soalan Peperiksaan pertengahan tahun dari pelbagai sekolah Selangor dan Kuala Lumpur.
2. PAKEJ SOALAN RAMALAN EDISI “GEMPUR”
KHAS UNTUK PERSIAPAN --> PEPERIKSAAN GERAK GEMPUR TAHUN 2012
Edisi “Gempur” ini merupakan satu bentuk cadangan set soalan supaya pelajar dapat membuat PERSEDIAAN KHUSUS bagi menjawab dengan baik ketika Peperiksaan Gerak Gempur 2012 nanti.Biasanya pada bulan Jun atau Julai
Mengandungi 3 set soalan Ramalan Utama iaitu :
Set Soalan Ramalan Edisi “Gempur” KHAS PILIHAN 1 , PILIHAN 2
Set Soalan ini Mengandungi Gabungan dari semua bab Tingkatan 1-3 ,Tingkatan 4 dan semua bab Tingkatan 5.
Soalan yang dipilih merupakan Soalan dari analisis Peperiksaan Sebenar SPM 2005-2010 terdahulu serta analisis Peperiksaan Gerak Gempur Dari pelbagai negeri dan sekolah.
3. PAKEJ SOALAN RAMALAN EDISI “NEGERI”
KHAS UNTUK PERSIAPAN --> PEPERIKSAAN PERCUBAAN NEGERI 2012
Edisi “NEGERI” ini merupakan satu bentuk cadangan set soalan supaya pelajar dapat membuat PERSEDIAAN KHUSUS bagi menjawab dengan baik ketika Peperiksaan Percubaan Negeri 2012 nanti. Biasanya pada bulan Ogos
Mengandungi 3 set soalan Ramalan Utama iaitu :
Set Soalan Ramalan Edisi “Negeri” KHAS PILIHAN 1 , PILIHAN 2
Set Soalan ini Mengandungi Gabungan dari semua bab Tingkatan 1-3 ,Tingkatan 4 dan semua bab Tingkatan 5.
Soalan yang dipilih merupakan Soalan dari analisis Peperiksaan Sebenar SPM 2005-2010 terdahulu,analisis Soalan percubaan negeri seluruh Negara serta contoh-contoh Soalan Peperiksaan pertengahan tahun dari pelbagai sekolah Selangor dan Kuala Lumpur.
4. PAKEJ SOALAN RAMALAN EDISI “AKHIR”
KHAS UNTUK PERSIAPAN --> PEPERIKSAAN SEBENAR PMR 2012
Edisi “AKHIR” ini merupakan satu bentuk cadangan set soalan supaya pelajar dapat membuat PERSEDIAAN KHUSUS bagi menjawab dengan baik ketika Peperiksaan Sebenar SPM 2012 nanti. Biasanya pada bulan September
Mengandungi 3 set soalan Ramalan Utama iaitu :
Set Soalan Ramalan Edisi “Akhir” KHAS PILIHAN 1 , PILIHAN 2
Set Soalan ini Mengandungi Gabungan dari semua bab Tingkatan 1-3 ,Tingkatan 4 dan semua bab Tingkatan 5.
Soalan yang dipilih merupakan Soalan dari analisis Peperiksaan Sebenar SPM 2005-2010 terdahulu,analisis Soalan percubaan negeri seluruh Negara serta contoh-contoh Soalan Peperiksaan pertengahan tahun dari pelbagai sekolah Selangor dan Kuala Lumpur.
5. PAKEJ SOALAN RAMALAN EDISI “KHAS”
KHAS UNTUK PERSIAPAN --> PEPERIKSAAN SEBENAR PMR 2012
Edisi “KHAS” ini merupakan satu bentuk lanjutan cadangan set soalan supaya pelajar dapat membuat PERSEDIAAN KHUSUS bagi menjawab dengan baik ketika Peperiksaan Sebenar SPM2012 nanti.Soalan ini merupakan lanjutan kepada Edisi akhir.
Mengandungi 2 set soalan Ramalan Utama iaitu :
Set Soalan Ramalan Edisi KHAS PILIHAN 1 dan PILIHAN 2
Set Soalan ini Mengandungi Gabungan dari semua bab Tingkatan 1-3 ,Tingkatan 4 dan semua bab Tingkatan 5.
Soalan yang dipilih merupakan Soalan dari analisis Peperiksaan Sebenar SPM 2005-2010 terdahulu,analisis Soalan percubaan negeri seluruh Negara serta contoh-contoh Soalan Peperiksaan pertengahan tahun dari pelbagai sekolah Selangor dan Kuala Lumpur.
BAHAGIAN A
4
2012
FORMAT KERTAS 1 MATHS SPM 2012
Mempunyai 40 soalan dan wajib jawab semua
Jika dilihat kepada statistic dibawah jumlah soalan bagi sesuatu tajuk adalah lebih kurang sama saja.
BIL
TAJUK
TING
PEPERIKSAAN SEBENAR
SPM’06 SPM’07
SPM’08 SPM’09 SPM’10 SPM’11
1
Standard Form
4
1,2,3,4
1,2,3
1,2,3,4
1,2,3,4
1,2,3,4
1,2,3,4
2
Number Bases
5
5,6
4,5
5,6
5,6
5,6
5,6
3
Polygon II
3
7
6,7
7
7,8
7,8
7,8
4
Circles III
4
8
8
8
9
9
9
5
Transformation I
3
9,10
9,10
9,10
10,11
10,11
10,11
6
Trigonometry I
3
11
-
-
12
-
-
7
Trigonometry II
4
12,13
11,12,
13
11,12,1
3
13
12,13
12,13
8
Lines and Planes in 3
Dimension
4
14
14
14
14
14
14
Angles of Elevation and
Depression
4
15,16
15
15
15,16
15,16
15,16
10
Bearing
5
17
16
16,17
17
17
17
11
Earth as a Sphere
5
18
17,18
18
18
18
18
12
Algebraic Expression II
2
19,20
19
119
19
19
19
13
Algebraic Expression III
3
-
21
20
20
20
20
14
Algebraic Formulae
3
21
20
21
21
21
21
15
Linear Equation I
2
22
22
22
22
22
22
16
Indices
3
23
23,24
23,24
23,24
23,24
23,24
17
Linear Inequalities
3
24
25
-
25,26
25,26
25,26
18
Statistic I
2
26,27
26
25
27
27
27
19
Statistic II
3
25
27
26,27
28
28,29
28,29
20
Statistic III
4
-
-
-
29
-
-
21
Graph of Function II
5
28
28
-
30
30
30
22
Sets
4
29,30,31
29,30,
31
29,30,3
1
31,32
31,32
31,32
23
The Straight Line
4
32,33
32,33
32,33
33,34
33,34
33,34
24
Probability I
4
34,35
34,35
34,35
35,36
35,36
35,36
25
Variations
5
36,37,38
36,37,
38
36,37,3
8
37,38
37,38
37,38
26
Matrices
5
39,40
39,40
39,40
39,40
39,40
39,40
2012
ANALISIS SOALAN PEPERIKSAAN SEBENAR MATEMATIK SPM 2012 KERTAS 2
Analisis Kertas 2 Soalan Matematik SPM 2005-2011
Topic
SPM’06 SPM’07 SPM’08 SPM’09 SPM’10 SPM’11SECTION A (Question 1-11)
1
Simultaneous Equation
/
/
/
/
/
/
2
Quadratic Equation
/
/
/
/
/
/
3
Sets (Shade Venn Diagrams)
/
-
/
-
/
/
Region for Inequalities
-
/
-
/
-
-
4
Mathematical Reasoning
/
/
/
/
/
/
5
The straight Line
/
/
/
/
/
/
6
Probability II
/
/
/
/
/
/
7
Arc Length & Area of Sector
/
/
/
/
/
/
8
Volume of Solids
Pyramids + Half Cylinder
Cuboids + Half Cylinders
Cones + Cuboids
Pyramid + Prism
Cones + Hemisphere
-
-
-
/
-
-
-
-
/
-
/
-
-
-
-
-
-
-
-
/
-
-
-
-
/
/
-
-
-
-
9
Matrices
/
/
/
/
/
/
10
Gradient and Area Under a Graphs
Speed-Time Graphs
Distance-Time Graphs
/
-
/
/
/
-
/
-
/
-
/
-
11
Lines & Planes in 3-D
/
/
/
/
/
SECTION B (Question 1-11)
Answer Four Only
12
Graphs of Function II
Quadratic
Cubic
Reciprocal
/
-
-
-
/
-
-
-
/
-
/
-
/
-
-
-
/
-
13
Transformation III
/
/
/
/
/
/
14
Statistics III
Ogive
Histogram
Frequency Polygon
-
/
-
/
-
-
-
-
/
-
/
-
/
-
-
-
/
-
15
Plans and Elevations
Prism + Cuboids
Cuboids +Half Cylinder, Prism
Prism + Prism
-
-
/
-
/
-
-
-
/
-
/
-
/
-
-
-
-
/
16
Earth as a Sphere
/
/
/
/
/
/
6
2012
Soalan Ramalan Edisi MID TERM Pilihan 1 (Utama) KERTAS 1
Exam Year: Mathematics
FORM 5 / TINGKATAN 5 2012
Focus : Persediaan Peperiksaan Pertengahan Tahun
Reference: The analysis is base on last 6 year National SPM exam paper 2005-2011 and State trial Exam 2011
Disclaimer/Penafian:
The exam tips provided are base on pure forecast and assumptions. Maths Catch Network and
www.maths-catch.com
will not be liable for any inaccuracy of the information. Students are not encouraged to rely 100% on
the tips to score in SPM exams. Students are advised to study hard for their exam. Students can use the tips as a
guide. All the materials have not gone for been proof reading or editing process.
Format SPM Mathematics Exam
PAPER
TIME
TYPE OF
QUESTION
TYPE OF
ANSWER
NUMBER OF
QUESTION
MARKS
1
1 Hour 15 minutes
Objective
Option A,B,C,D
40
40%
2
2 hour 30 minutes
Subjective
Working Steps
16
100%
ANALISIS KERTAS 1 SOALAN MATEMATIK SPM 2005-2011
Jika dilihat kepada statistic dibawah jumlah soalan bagi sesuatu tajuk adalah lebih kurang sama saja.
BIL
TAJUK
TING
PEPERIKSAAN SEBENAR
SPM’06 SPM’07 SPM’08 SPM’09 SPM’10 SPM’11
1
Standard Form
4
1,2,3,4
1,2,3
1,2,3,4
1,2,3,4
1,2,3,4
1,2,3,4
2
Number Bases
5
5,6
4,5
5,6
5,6
5,6
5,6
3
Polygon II
3
7
6,7
7
7,8
7,8
7,8
4
Circles III
4
8
8
8
9
9
9
5
Transformation I
3
9,10
9,10
9,10
10,11
10,11
10,11
6
Trigonometry I
3
11
-
-
12
-
-
7
Trigonometry II
4
12,13
11,12,13 11,12,13
13
12,13
12,13
8
Lines and Planes in 3
Dimension
4
14
14
14
14
14
14
9
Angles of Elevation and
Depression
4
15,16
15
15
15,16
15,16
15,16
10
Bearing
5
17
16
16,17
17
17
17
11
Earth as a Sphere
5
18
17,18
18
18
18
18
12
Algebraic Expression II
2
19,20
19
119
19
19
19
13
Algebraic Expression III
3
-
21
20
20
20
20
14
Algebraic Formulae
3
21
20
21
21
21
21
15
Linear Equation I
2
22
22
22
22
22
22
16
Indices
3
23
23,24
23,24
23,24
23,24
23,24
17
Linear Inequalities
3
24
25
-
25,26
25,26
25,26
18
Statistic I
2
26,27
26
25
27
27
27
19
Statistic II
3
25
27
26,27
28
28,29
28,29
20
Statistic III
4
-
-
-
29
-
-
21
Graph of Function II
5
28
28
-
30
30
30
22
Sets
4
29,30,31 29,30,31 29,30,31
31,32
31,32
31,32
23
The Straight Line
4
32,33
32,33
32,33
33,34
33,34
33,34
24
Probability I
4
34,35
34,35
34,35
35,36
35,36
35,36
25
Variations
5
36,37,38 36,37,38 36,37,38
37,38
37,38
37,38
26
Matrices
5
39,40
39,40
39,40
39,40
39,40
39,40
2012
Disebab kan modul ini dikhaskan untuk pelajar tingkatan 5 ,maka berikut merupakan cadangan tajuk dan Ramalan
Soalan yang akan Keluar pada Peperiksaan Pertengahan Tahun (Mid Term Exam ) 2012 nanti.
Tajuk-tajuk ini berdasarkan analisis soalan-soalan tahun lalu.Kebiasaanya Peperiksaan Pertengahan Tahun soalan
yang akan keluar adalah semua bab tingkatan1-3 ,semua bab tingkatan 4 dan sebahagian bab Tingkatan 5
Oleh itu modul ini dirangka khas menggunakan asas taburan soalan-soalan tahun lalu
SENARAI TAJUK TUMPUAN SEBAGAI PERSEDIAAN MENGHADAPI
PPERIKSAAN PERTENGAHAN TAHUN 2012
BIL
FORECAST CHAPTER (MID TERM EXAM)
FORM
1.
Standard Form
4
2.Standard Form
4
3.Standard Form
4
4.Number Bases
5
5.Number Bases
5
6.Polygon I &II
1-3
7.Polygon I & II
1-3
8.Circles III
1-3
9.Transformation I & II
1-3
10.Transformation I & II
1-3
11.Trigonometry II
4
12.Trigonometry II
4
13.Trigonometry II
4
14.
Lines and Planes in 3 D
4
15.
Angles of Elevation and Depression
4
16.
Algebraic Expression
1-3
17.Linear Equation
1-3
18.Algebraic Formulae
1-3
19.Algebraic Expression
1-3
20.Algebraic Formulae
1-3
21.Algebraic Expression
1-3
22.Linear Equation
1-3
23.Indices
1-3
24.Indices
1-3
25.Linear Inequalities
1-3
26.Statistic I
1-3
27.Statistic II
1-3
28.Graph of Function II
5
29.Sets
4
30.Sets
4
31.Sets
4
32.
The Straight Line
4
33.
The Straight Line
4
34.
Probability I
4
35.Probability I
4
36.Variations
5
37.Variations
5
38.Variations
5
39.Matrices
5
40.Matrices
5
8
2012
1 Round off 0.0048499 correct to one significant figure.
Bundarkan 0.0048499 betul kepada satu angka bererti.
A 0.0005 C 0.005
B 0.004 D 0.0050
2 Express 8.584 × 10¹⁰ as a single number.
Nyatakan 8.584 × 10¹⁰ sebagai satu nombor tunggal.
A 0.00000000008584 C 0.000000008584
B 0.0000000008584 D 0.00000008584
3 Express 8 200 in standard form.
Nyatakan 8 200 dalam bentuk piawai.
A 8.2 × 10³ C 8.2 × 10³
B 8.2 × 10⁴ D 8.2 × 10⁴
4 Convert 60710 to a number in base two.
Tukar 60710 kepada nombor dalam asas dua.
A 11010111112 C 10010111112
B 10110111112 D 10010011112
5 100002 + 110102 − 110102 =
A 110002 C 100102
B 101002 D 100002
6 In Diagram 1, ABCDE is a polygon and DEF is a straight line.
Dalam Rajah 1, ABCDE ialah sebuah poligon dan DEF adalah garis lurus.
Diagram 1 Rajah 1 The value of m is Nilai m ialah A 70 C 90 B 80 D 100
7 In Diagram 2, MNPQRSTUV is a regular polygon.
PNW and RMW are straight lines.
Dalam Rajah 2, MNPQRSTUV ialah sebuah poligon sekata. PNW dan RMW ialah garis lurus.
Diagram 2 Rajah 2 The value of k is Nilai k ialah A 10 C 20 B 15 D 25
8 In Diagram 3, PQR is a tangent to the circle with centre O. QT and OSR are straight lines.
Dalam Rajah 3, PQR ialah tangen kepada bulatan dengan pusat O. QT dan OSR ialah garis lurus.
Diagram 3
Rajah 3
Find the value of x.
Cari nilai x.
A 26 C 58
B 32 D 64
9 In Diagram 4, figure Q is the image of figure P under a certain translation.
Dalam Rajah 4, bentuk Q ialah imej bagi bentuk P di bawah suatu translasi.
Diagram 4
Rajah 4
Paper 1
Time: 1 Hour 15 Minutes
Kertas 1
Arahan : Bahagian ini mengandungi 40 soalan. Jawab semua soalan. Tiap-tiap soalan diikuti oleh empat
pilihan jawapan iaitu A, B, C, dan D. Bagi setiap soalan, pilih satu jawapan sahaja. Hitamkan jawapan
kamu pada kertas jawapan objektif yang disediakan. Jika kamu hendak menukar jawapan, padamkan tanda
yang telah dibuat. Kemudian hitamkan jawapan yang baru.
2012
Which of the figures A, B, C and D is the image of Runder the same translation?
Antara bentuk-bentuk A, B, C dan D, yang manakah imej bagi R di bawah translasi yang sama?
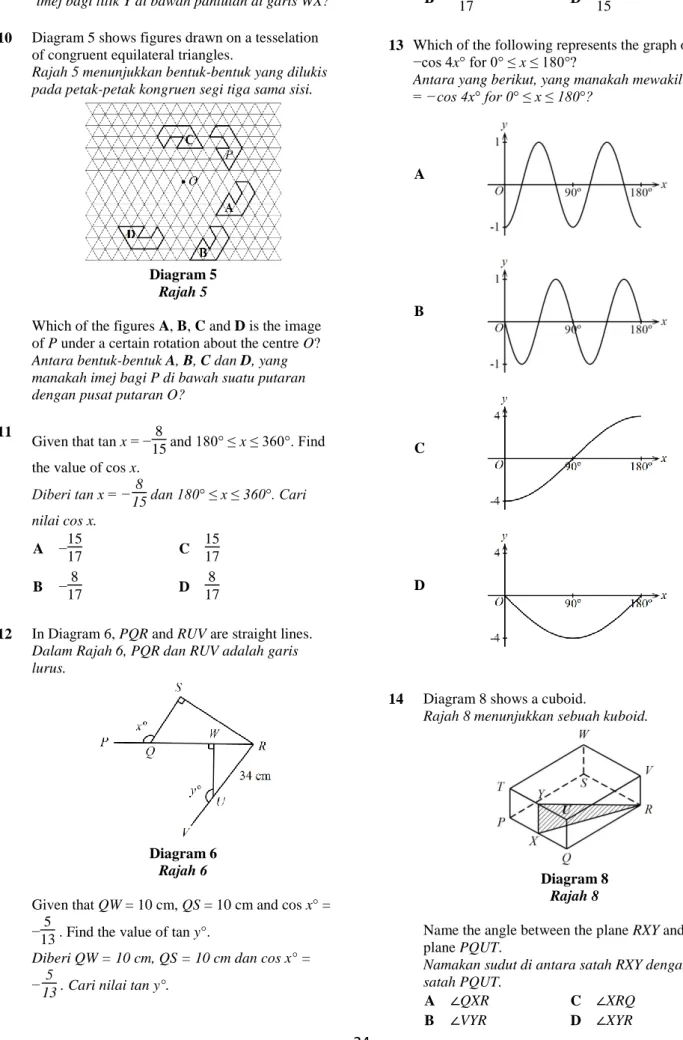
10 Diagram 5 shows figures drawn on a tesselation of congruent equilateral triangles.
Rajah 5 menunjukkan bentuk-bentuk yang dilukis pada petak-petak kongruen segi tiga sama sisi.
Diagram 5
Rajah 5
Which of the figures A, B, C and D is the image of P under a certain rotation about the centre O?
Antara bentuk-bentuk A, B, C dan D, yang manakah imej bagi P di bawah suatu putaran dengan pusat putaran O?
11
Given that tan x = 247 and 180° ≤ x ≤ 360°. Find the value of cos x.
Diberi tan x = 247 dan 180° ≤ x ≤ 360°. Cari nilai cos x. A −24 25 C 24 25 B −257 D 257
12 In Diagram 6, ABC is a straight line.
Dalam Rajah 6, ABC adalah garis lurus.
Diagram 6
Rajah 6
Given that AC = 54 cm. Find the value of cos x°.
Diberi AC = 54 cm. Cari nilai cos x°.
A −257 C 247
B 257 D 257
13 Which of the following represents the graph of y =
−cos 4x° for 0° ≤ x ≤ 360°?
Antara yang berikut, yang manakah mewakili graf y = −cos 4x° for 0° ≤ x ≤ 360°?
A
B
C
D
14 Diagram 8 shows a right prism with uniform cross-section in the shape of a trapezium.
Rajah 8 menunjukkan sebuah prisma tegak dengan keratan rentas seragam dalam bentuk trapezium.
Diagram 8
Rajah 8
Given that WX = 4 cm, calculate the angle between the plane PQX and the plane PQUT.
Diberi WX = 4 cm, kira sudut di antara satah PQX dengan satah PQUT.
A 45° C 60° 15'
B 56° 19' D 63° 26'
15 In Diagram 9, CD is a vertical tower. ABD is horizontal.
Dalam Rajah 9, CD ialah menara mencancang. ABD adalah mengufuk.
10
2012
Diagram 9
Rajah 9
The angle of depression of A from C is 45°. Calculate the angle of elevation of C from B.
Sudut tunduk A dari C ialah 45°. Kira sudut dongakan C dari B. A 13° 24' C 52° 42' B 37° 18' D 76° 36' 16 (7y + 6)2 = A 49y2 84y + 36 B 49y2 84y 36 C 49y2 + 84y 36 D 49y2 + 84y + 36
17 Given that 2(3y 2) 8 = 7y, then y =
Diberi 2(3y 2) 8 = 7y, maka y =
A 12
13 C 10
B 2 D 12
18
Given that 4s 4t9 = 2, then s =
Diberi 4s 4t 9 = 2, maka s = A 2 + t4 C 1 + t18 B 18 + t4 D 9 + 2t18 19 Simplify 2p 2 q 2pq2 p q . Permudahkan 2p 2 q 2pq2 p q . A p + q C p q B 2pq D 2p2q2 20
Given that 2p + 2q1 = 3, then p =
Diberi 1 2p + 2q = 3, maka p = A 1 6q 2 C 1 2q 2 B 1 6q 6 D 1 2q 6 21 5x 3y + 7z (6x + y + 6z) = A x 4y + z C 11x 2y + 13z B x 2y + z D 11x 4y + z
22 Given that 5q 4 = 4 7q, then q =
Diberi 5q 4 = 4 7q, maka q = A 3 C 3 B 1 12 D 1 12 23
(
515)
1 3 × 125 1 3 625 1 4 = A 55 C 55 B 53 D 53 24(
8p12q6)
1 3(
p2q)
3 = A p22 q C 2q p2 B 2p2q D 2p 2 q25 Which of the following represents the solution for the
linear inequality 8 < 1 p < 1?
Antara berikut, yang manakah mewakili penyelesaian bagi ketaksamaan linear 8 < 1 p < 1?
A
B
C
D
26 Diagram 10 is a bar chart showing the number of students in a school who obtained grade A in Mathematics in the final school examination for three consecutive years.
Rajah 10 ialah satu carta palang yang menunjukkan bilangan pelajar di sebuah sekolah yang mendapat gred A dalam Matematik dalam ujian akhir tahun sekolah selama tiga tahun berturutan.
2012
What is the difference between the number of boys and girls who obtained grade A over the three years?
Apakah perbezaan antara bilangan pelajar lelaki dan pelajar perempuan yang mendapat gred A selama tiga tahun?
A 2 C 6
B 4 D 7
27 Diagram 11 is a bar chart showing the number of shirts sold in three months..
Which of the following statements is true about the sale of shirts?
Antara pernyataan berikut, yang manakah benar mengenai jualan baju itu?
A The sale of long-sleeved shirts in February is
5 less than the sale in March
Jualan baju berlengan panjang pada bulan Februari adalah 5 helai kurang daripada jualan pada bulan Mac
B The sale of long-sleeved shirts in March is 15 more than the sale in April
Jualan baju berlengan panjang pada bulan Mac adalah 15 helai lebih daripada jualan pada bulan April
C The total number of short sleeved shirts sold
in three months are 28
Jumlah bilangan baju berlengan pendek yang dijual dalam tiga bulan ialah 28 helai.
D The largest quantity of short-sleeved shirts
Kuantiti baju berlengan pendek yang dijual dalam tiga bulan adalah paling banyak pada bulan April
28
Which of the following graphs represents y = 3x ?
Antara graf yang berikut, yang manakah mewakili y = 3x ?
A C
B D
29 Given that the universal set ξ = P ∩ Q, set P = {j, k,
l} and set Q = {l, m}. Find the value of n(ξ). Diberi set semesta ξ = P ∩ Q, set P = {j, k, l} dan set Q = {l, m}. Cari nilai bagi n(ξ).
A 4 C 2
B 3 D 1
30 Table 1 shows the result of a survey of 135 magazine readers.
Jadual 1 menunjukkan keputusan suatu tinjauan pendapat bagi 135 orang pembaca majalah.
Magazine Majalah Number of readers Bilangan pembaca Fashion Fesyen 77 Entertainment Hiburan 78
Fashion and Entertainment only
Fesyen dan Hiburan sahaja
14 Fashion and Sports only
Fesyen dan Sukan sahaja 23
Fashion only
Fesyen sahaja 27
Entertainment only
Hiburan sahaja 22
The Venn diagram in Diagram 12 represents part of the information.
12
2012
Find the number of magazine readers who like to read fashion magazine or sports magazine and also entertainment magazine.
A 56 C 79
B 78 D 101
31 Diagram 13 is a Venn diagram which shows the elements of the universal set ξ, set X and set Y.
List all the elements of set X'.
A {f, h, i, k} B {f, g, h, i, k, o}
C {f, g, h, i, k, o, r} D {f, g, h, i, k, m, n, o, r}
32 Find the y-intercept of the straight line 20y = 19x + 19.
A −1920 C 19
20
B −2019 D 2019
33 Find the gradient of the straight line 9y = 5x + 2.
A −29 C 5
9
B −59 D 95
34 A box contains 50 green pins and a number of black pins. A pin is picked at random from the box. The probability of picking a green pin is 1019 . Find the number of black pins in the box.
Sebuah kotak mengandungi 50 biji peniti hijau dan beberapa biji peniti hitam. Sebiji peniti dipilih secara rawak daripada kotak itu. Kebarangkalian mendapat peniti hijau ialah 1019 . Cari bilangan peniti
hitam di dalam kotak itu.
A 5 C 45
B 35 D 95
35 In an exhibition, as many as 40 out of 75 visitors are male. 10 female visitors entered the exhibition. A visitor is selected at random from the exhibition. Find the probability that a female visitor is selected.
orang pelawat adalah lelaki. 10 orang pelawat perempuan masuk ke pameran itu. Seorang pelawat dipilih secara rawak daripada pameran itu. Cari kebarangkalian bahawa seorang pelawat perempuan dipilih. A 2 17 C 7 17 B 35 D 179
36 It is given that B varies directly as A2 and B = 32 when A = 4. If C = 9
A, calculate the value of BC
when A = 5.
Diberi bahawa B berubah secara langsung dengan A2 dan B = 32 apabila A = 4. Jika C = 9
A, hitung nilai BC apabila A = 5.
A 360 C 72
B 90 D 50
37 It is given that y varies inversely as x3, and y = 5 when x = 12 . Calculate the value of x when y = 40.
Diberi bahawa y berubah secara songsang dengan x3 dan y = 5 apabila x = 12 . Hitung nilai x apabila y = 40.
A 4 C 14
B 16 D 161
38 Table 2 shows some values of the variables d, h and
p.
d h p
x 3 4
5 1 16
It is given that d varies directly as the cube of h and inversely as the square root of p. Calculate the value of x.
Diberi bahawa d berubah secara langsung dengan kuasa tiga h dan secara songsang dengan punca kuasa dua p. Hitung nilai x.
A 45 C 135 B 90 D 270 39 Given that
3
4 1 y
8 7 =
3124 , find the value of
y.
A 52 C 8
B 8 D 52
40
Given the matrix equation 2
0
2 10 9 − 6
1 2x 7 9 =
1126
2272 , find the value of x.
A 108 C 6
2012
SPM’08 SPM’09 SPM’10 SPM’11
Tiada 1 Soalan Pernah Keluar Tiada Tiada
1
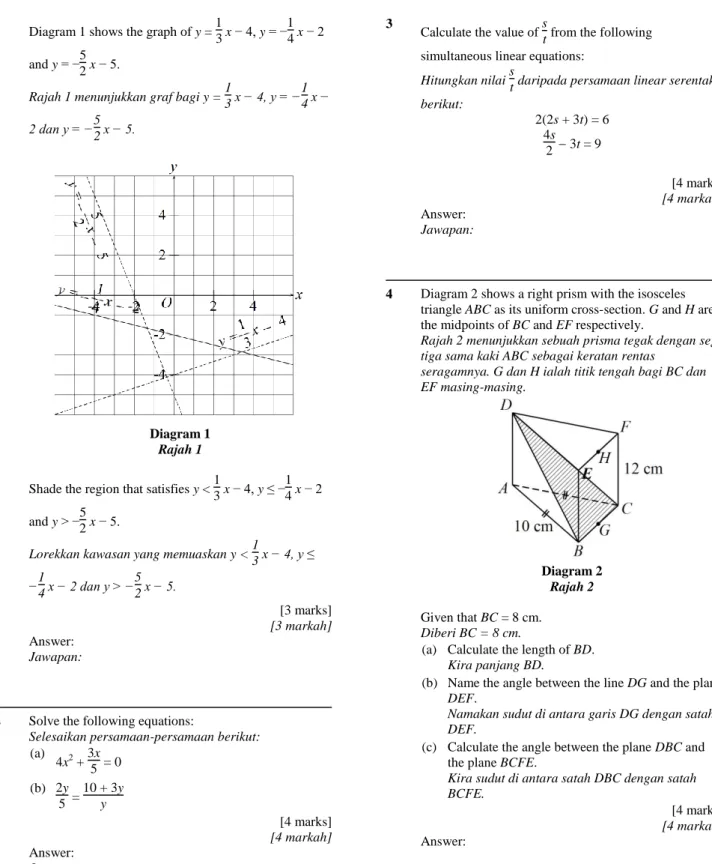
Diagram 1 shows the graph of y = 37 x + 3, y = 14 x − 4 and y = 23 x + 4.
Shade the region that satisfies y < 3
7 x + 3, y ≥ 1
4 x − 4 and y ≤ 2 3 x + 4.
Lorekkan kawasan yang memuaskan y < 37 x + 3, y ≥ 14 x − 4 dan y ≤ 23 x + 4.
[3 marks] [3 markah] Answer: SPM’08 SPM’09 Trial SBP’09 SPM’10 SPM’11 1 Soalan Pernah Keluar
16
4
3
2
3
y
x
y
x
1 Soalan Pernah Keluar
)
3
(
2
9
4
2
x
x
x
1 Soalan Pernah Keluar1
2
13
6
5
n
m
n
m
1 Soalan Pernah Keluar5
3
4
2
y
x
y
x
1 Soalan Pernah Keluar2
3
2
12
3
n
m
n
m
2 Solve the following equations: (a) p2 + 3p 8 = 0 (b) 8q 5 = 5 7q q [4 marks] Answer:
Soalan Ramalan Edisi MID TERM Pilihan 1 [KERTAS 2]
Exam Year: Mathematics
FORM 5 / TINGKATAN 5 2012
Reference: The analysis is base on last 6 year National SPM exam paper 2005-2010 and State trial Exam 2011
Disclaimer/Penafian:
The exam tips provided are base on pure forecast and assumptions. Maths Catch Network and
www.maths-catch.com
will not be liable for any inaccuracy of the information. Students are not encouraged to rely 100% on
the tips to score in SPM exams. Students are advised to study hard for their exam. Students can use the tips as a
guide. All the materials have not gone for been proof reading or editing process.
QUESTION 1 Inequalities Set FORM 5
Analysis Set
Analysis Linear Equation
Linear Equation FORM 1-3
14
2012
3Calculate the value of pq from the following simultaneous linear equations:
Hitungkan nilai pq daripada persamaan linear serentak berikut:
3(3p + 5q) = 3 3p 3 5q = 7 [4 marks] [4 markah] Answer: SPM’08 SPM’09 SPM’10 SPM’11
1 Soalan Keluar
1 soalan keluar
1 soalan keluar
1 soalan keluar
4
Diagram 2 shows a right prism with the isosceles triangle PQR as its uniform cross-section. V and W are the midpoints of
QR and TU respectively.
Rajah 2 menunjukkan sebuah prisma tegak dengan segi tiga sama kaki PQR sebagai keratan rentas seragamnya. V dan W ialah titik tengah bagi QR dan TU masing-masing.
Diagram 2
Rajah 2
Given that QR = 6 cm.
Diberi QR = 6 cm.
(a) Calculate the length of QS.
Kira panjang QS.
(b) Name the angle between the line SV and the plane STU.
Namakan sudut di antara garis SV dengan satah STU.
(c) Calculate the angle between the plane SQR and the plane QRUT.
Kira sudut di antara satah SQR dengan satah QRUT.
[4 marks] [4 markah] Answer: SPM’07 SPM’08 SPM’09 SPM’10 SPM’11 1 Soalan Pernah Keluar Deduction and Induction 1 Soalan Pernah Keluar Deduction and Induction 1 Soalan Pernah Keluar Arguments 1 Soalan Pernah Keluar Arguments 1 Soalan Pernah Keluar -Arguments -implication
5 (a) Write two implications from the statement below.
Tulis dua implikasi daripada pernyataan berikut.
Analysis
QUESTION 4
Lines and Planes in 3-D FORM 4
QUESTION 5
Analysis Mathematical Reasoning [Implication]
2012
5p = q 3 jika dan hanya jika q = 5p + 3.
(b) Write down the conclusion and premise to complete each of the following argument.
Tulis kesimpulan dan premis untuk melengkapkan setiap hujah berikut.
(i) Premise 1: All rectangles have two lines of symmetry.
Premis 1: Semua segi empat tepat mempunyai dua garis simetri.
Premise 2: q is a rectangle.
Premis 2: q adalah sebuah segi empat tepat.
Conclusion:
Kesimpulan:
(ii) Premise 1: If a number is a factor of 12, then the number is a factor of 16.
Premis 1: Jika satu nombor adalah satu faktor bagi 12, maka nombor itu adalah satu faktor bagi 16.
Premise 2:
Premis 2:
Conclusion: 4 is a factor of 16.
Kesimpulan: 4 adalah satu faktor bagi 16.
[4 marks]
[4 markah]
Answer:
SPM’07 SPM’08 SPM’09 SPM’10 SPM’11
Find –Value k Find x-intercept line PQ
6 Diagram 3 shows a parallelogram JKMN drawn on a Cartesian plane. Point N lies on the x-axis and point J lies on the y-axis. The straight line JM is parallel to the x-y-axis.
Rajah 3 menunjukkan sebuah segi empat selari JKMN, yang dilukis pada satah cartesan. Titik N terletak pada paksi-x dan titik J terletak pada paksi-y. Garis lurus JM adalah selari dengan paksi-x.
Given that the equation of MN is y = −7x + 14. Find
Diberi persamaan MN ialah y = −7x + 14. Cari
(a) the x-intercept of the straight line MN,
pintasan-x bagi garis lurus MN,
(b) the gradient of the straight line JN,
kecerunan bagi garis lurus JN,
(c) the equation of the straight line KM.
persamaan bagi garis lurus KM.
[5 marks]
[5 markah]
Answer:
Analysis The Straight Lines [Parallel Line]
16
2012
SPM’09 SPM’10 SPM’11
Pernah Keluar 1 Soalan
(a) Given matrix
5
4
3
2
A
Find inverse matrix of A
(b) Find x and y using matrix
13
5
4
7
3
2
y
x
y
x
Pernah Keluar 1 Soalan
(c) Given inverse matrix of
m
k
is
2
1
5
..
5
2
1
4
Find m and k(d) Find x and y using matrix
2
5
2
7
4
y
x
y
x
Pernah Keluar 1 Soalan
(e) Given
1
0
0
1
5
6
2
3
M
Find M(f) Find x and y using matrix
9
5
6
3
2
3
y
x
y
x
7It is given that the inverse matrix of
24 11
is 1p
1
2q
4 .
Diberi bahawa matriks songsang bagi
4
2 1 1 ialah 1 p
1 2 q 4 . (a) Find the value of p and q./Cari nilai p dan q.(b) Write the following simultaneous linear equations as matrix equation:
Tulis persamaan linear serentak berikut dalam bentuk persamaan matriks:
4x + y = 3 2x y = 7 Hence, using matrix method, calculate the value of x and y.
[6 marks] [6 markah] Answer: SPM’07 SPM’08 SPM’09 SPM’10 SPM’11 1 soalan Keluar Prism + Cylinder 1 soalan Keluar Half Cylinder + Triangle 1 Soalan Keluar Cone + Hemisphere 1 soalan Keluar Cylinder +Cube 1 soalan Keluar Half Cylinder +cuboid
8 Diagram 4 shows a cylindrical solid. A hemisphere shown by the shaded region, is removed from the solid.
Rajah 4 menunjukkan sebuah pepejal berbentuk silinder. Kawasan berlorek yang berbentuk hemisfera telah dikeluarkan dari pepejal itu.
Given that the diameter of the hemisphere is 10 cm, calculate the volume, in cm3, of the remaining solid. (Use π = 227 )
Diberi diameter hemisfera itu ialah 10 cm, Hitung isi padu pepejal yang tinggal, dalam cm3.
[4 marks] Answer:
QUESTION 7
Matrices FORM 5
Analysis Matrices
Analysis Solid Geometry [Volume]
2012
SPM’09 SPM’10 SPM’11 Pernah Keluar 1 SoalanGiven Card
S M I L E
(a) List all sample space (b) Find Probability
i. Code begin with letter M ii. Code consists two vowels or two
consonants
Pernah Keluar 1 Soalan
(a) Complete the possible outcomes (b) Find probability
i. Pointer stop at same sector twice
ii. Pointer stop at sector C
Pernah Keluar 1 Soalan
Boys Girls
Science Society Ali Bob
Nora
Maths Sociecty Kumar Rose Suzi Lina
i. List Posisible outcomes ii. Find probability boy and girl are
choosen
9 Table 1 shows the number of shirts and skirts with purple, green and blue colours in a wardrobe.
Colour Warna Item Benda Shirts Baju Skirts Skirt Purple Ungu 1 3 Green Hijau 6 2 Blue Biru 10 9 Table 1
A shirt and a skirt are drawn at random from the wardrobe respectively. Calculate the probability that
Sehelai baju dan sehelai skirt dipilih secara rawak daripada almari pakaian masing-masing. Hitung kebarangkalian bahawa
(a) a blue shirt is drawn,
sehelai baju biru dipilih,
(b) a blue shirt and a purple skirt are drawn,
sehelai baju biru dan sehelai skirt ungu dipilih,
(c) a shirt and a skirt of the same colour are drawn.
sehelai baju dan sehelai skirt yang sama warna dipilih.
[6 marks]
[6 markah]
Answer:
SPM’07 SPM’08 SPM’09 SPM’10 SPM’11
Keluar 1 Soalan
(6 marks) Keluar 1 Soalan (6marks) Keluar 1 Soalan (6marks) Keluar 1 Soalan (6marks) Keluar 1 Soalan (6marks)
10 In Diagram 5, OAB is a sector of a circle with centre O and CDEF is a semicircle with centre C. ADCFO is a straight line
A
C
B
D
QUESTION 9
Probability II FORM 5
Analysis Circle I & II
18
2012
It is given that AO = 19 cm, CD = 3.5 cm and ∠AOB = 60°.Diberi AO = 19 cm, CD = 3.5 cm dan ∠AOB = 60°.
Use π = 227 , and give the answer correct to two decimal places. Calculate
Guna π = 22
7 dan beri jawapan betul kepada dua tempat perpuluhan.
Hitung
(a) the area, in cm2, of the shaded region.
luas, dalam cm2, kawasan yang berlorek.
(b) the perimeter, in cm, of the shaded region.
perimeter, dalam cm, kawasan yang berlorek.
[6 marks]
[6 markah]
Answer:
SPM’09 SPM’10 SPM’11
Pernah Keluar 1 Soalan Speed vs Time
Given distance 361 m.Find (a) Average Speed
(b) Rate of Change of Speed (c) Value v (Distance)
Pernah Keluar 1 Soalan Speed vs Time
Find
(a) Uniform Speed
(b) Rate of Change of Speed (c) Value t (Distance)
Pernah Keluar 1 Soalan Speed vs Time
Find
(a) Uniform Speed
(b) Rate of Change of Speed (c) Value T (Distance)
11 Diagram 6 shows a speed-time graph for the movement of a particle for a period of 16 seconds.
Rajah 6 menunjukkan graf laju-masa bagi pergerakan suatu zarah dalam tempoh 16 saat.
Diagram 6
Rajah 6
(a) State the uniform speed, in m s−1, of the particle.
Nyatakan laju seragam, dalam m s−1, zarah itu.
(b) The distance travelled by the particle with uniform speed is 160 m. Calculate
Jarak yang dilalui oleh zarah itu dengan laju seragam ialah 160 m. Hitung
(i) the value of t,
nilai t,
(ii) the average speed, in m s−1, of the particle for the period of 16 seconds.
purata laju, dalam m s−1, zarah itu dalam tempoh 16 saat.
[6 marks]
[6 markah]
Answer:
Jawapan:
2012
SPM’07 SPM’08 SPM’09 SPM’10 SPM’11 1 Soalan Keluar Graphs Cubic 36
x
y
1 Soalan Keluar Graphs Reciprocalx
y
36
1 Soalan Keluar Graphs Cubic14
9
3
x
x
y
1 Soalan Keluar Graphs Quadratic 22
3
8
x
x
y
1 Soalan Keluar Graphs Quadratic1
3
3
x
x
y
12 (a) Complete Table 2 in the answer space for the equation y = 2x2 + 5x − 6.
Lengkapkan Jadual 2 di ruang jawapan bagi persamaan y = 2x2 + 5x − 6.
[2 marks]
[2 markah]
(b) For this part of the question, use the graph paper provided. You may use a flexible curve rule.
Untuk ceraian soalan ini, gunakan kertas graf yang disediakan. Anda boleh menggunakan pembaris feksibel.
By using a scale of 2 cm to 1 unit of the x-axis and 2 cm to 5 units on the y-axis, draw the graph of y = 2x2 + 5x − 6 bagi −5 ≤ x ≤ 1.
Dengan menggunakan skala 2 cm kepada 1 unit pada paksi-x dan 2 cm kepada 5 unit pada paksi-y, lukiskan graf y = 2x2 + 5x − 6 bagi −5 ≤ x ≤ 1.
[4 marks]
[4 markah]
(c) From your graph, find
Daripada graf anda, carikan
(i) the value of y when x = −0.6,
nilai y apabila x = −0.6,
(ii) the value of x when y = 5,
nilai x apabila y = 5,
[2 marks]
[2 markah]
(d) Draw a suitable straight line on your graph to find all the values of x which satisfy the equation 2x2 − 18 = 0 for −5 ≤ x ≤ 1. State the values of x.
Lukiskan satu garis lurus yang sesuai pada graf anda untuk mencari semua nilai x yang memuaskan persamaan 2x2 − 18 = 0 bagi −5 ≤ x ≤ 1. Nyatakan nilai-nilai x itu.
[4 marks] [4 markah] Answer: Jawapan: (a) x −5 −4.5 −4 −3 −2 −1 0 0.5 1 y 19 12 −3 −8 −9 −3 1 Table 2 Jadual 2 (b) (c) (d)
QUESTION 12
Graphs of Function II FORM 5
[48 marks]
[48 markah]
Answer any four questions from this section
20
2012
SPM’07 SPM’08 SPM’09 SPM’10 SPM’11
1 Soalan Pernah keluar *Rotation
*Reflection
1 Soalan Pernah keluar *Rotation
*Reflection
1 Soalan Pernah keluar *Translation
*Reflection
1 Soalan Pernah keluar *Translation
*Rotation
1 Soalan Pernah keluar *Translation
*Reflection
13 (a) Transformation J is reflection in the line x = f.
Penjelmaan J ialah pantulan pada garis x = f.
Transformation K is an anticlockwise rotation of 90° about the centre (−4, −5).
Penjelmaan K ialah satu putaran 90° lawan arah jam pada pusat (−4, −5).
Transformation M is an translation
( )
−5 . 1Penjelmaan M ialah satu translasi
( )
−5 . 1(i) The point (6, −5) is the image of the point (−4, −5) under the transformation J. State the value of f.
Titik (6, −5) ialah imej bagi titik (−4, −5) di bawah penjelmaan J. Nyatakan nilai f.
(ii) Find the coordinates of the image of point (−7, −8) under the following transformation:
Cari koordinat imej bagi titik (−7, −8) di bawah gabungan penjelmaan berikut:
(a) M2
(a) MK
[5 marks]
[5 markah]
(b) Diagram 7 shows three pentagons ABCDE, FGHIJ and MNPQJ on a Cartesian plane.
Rajah 7 menunjukkan tiga sisiempat ABCDE, FGHIJ dan MNPQJ pada suatu satah cartesan.
Diagram 7
Rajah 7
(i) MNPQJ is the image of ABCDE under the combined transformation VU. Describe in full the
transformations:
MNPQJ ialah imej bagi ABCDE di bawah gabungan penjelmaan VU. Huraikan selengkapnya penjelmaan:
(a) U
(b) V
(ii) Given that pentagon MNPQJ represents a region of area 29.3 cm2, calculate the area, in cm2, of the region represented by the shaded region.
Diberi bahawa sisiempat MNPQJ mewakili suatu kawasan yang mempunyai luas 29.3 cm2, hitungkan luas, dalam cm2, kawasan yang diwakili oleh rantau berlorek.
[7 marks]
[7 markah]
Answer:
Jawapan:
2012
SPM’08 Trial SBP’09 SPM’09 SPM’10 SPM’11 1 Soalan pernah keluar [12 marks] *Draw Graph Frequency Polygons 1 Soalan pernah keluar [12 marks] *Draw Graph Ogive 1 Soalan pernah keluar [12 marks] *Draw Graph Histogram 1 Soalan pernah keluar [12 marks] *Draw Graph Ogive 1 Soalan pernah keluar [12 marks] *Draw Graph Histogram14 The data in Diagram 8 shows the speed, in km h−1, for 44 cars on a road. 60 59 63 55 63 58 49 65 57 46 59 50 69 71 44 67 67 49 53 66 54 59 53 54 46 58 69 71 66 56 46 44 61 50 65 59 71 65 59 68 51 65 71 59
(a) Based on the data in Diagram 8, construct a grouped frequency table for the data based on the size of class interval of 4 km h−1 beginning with the class interval 44 − 47.
Berdasarkan data di Rajah 8, bina satu jadual kekerapan terkumpul bagi data berdasarkan saiz selang kelas 4 km h−1 bermula dengan selang kelas 44 − 47.
[3 marks] [3 markah] (b) By using the table constructed in (a), state the
(i) modal class, kelas mod,
(ii) mean speed of the cars. min kelajuan bagi kereta-kereta.
[4 marks] [4 markah] (c) By using the scales of 2 cm to 4 km h−1 on the horizontal axis and 2 cm to 1 car on the vertical axis, draw a histogram
based on the table constructed in (a).
Dengan menggunakan skala 2 cm kepada 4 km h−1 pada paksi mengufuk dan 2 cm kepada 1 buah kereta pada paksi mencancang, lukis satu histogram berdasarkan jadual yang dibina di (a).
[5 marks] [5 markah] Answer:
15 Table 3 is a frequency table which shows the time spent by 41 housewives to prepare a meal.
Time (minutes) Frequency
25 − 29 3 30 − 34 4 35 − 39 8 40 − 44 9 45 − 49 10 50 − 54 5 55 − 59 2 Table 3
(a) Construct a cumulative frequency table for the given data. Bina satu jadual kekerapan longgokan bagi data yang diberi.
(b) By using the scales of 2 cm to 5 minutes on the horizontal axis and 2 cm to 5 housewives on the vertical axis, draw an ogive for the data.
Dengan menggunakan skala 2 cm kepada 5 minit pada paksi mengufuk dan 2 cm kepada 5 orang suri rumah tangga pada paksi mencancang, lukis satu ogif bagi data tersebut.
[12 marks] Answer:
Analysis Statistics
22
2012
SPM’08 SPM’09 SPM’10 SPM’11
1 Soalan Pernah Keluar 1 Soalan Pernah Keluar 1 Soalan Pernah Keluar 1 Soalan Pernah Keluar
16 (a) Diagram 10 shows the point (−3, 1) and the straight line x = 2 drawn on a Cartesian plane. Rajah 10 menunjukkan titik (−3, 1) dan garis lurus x = 2 dilukis pada suatu satah Cartesan.
Diagram 10
Rajah 10
Transformation P is the translation
( )
−2 5 .Penjelmaan P ialah satu translasi
( )
−2 5 .Transformation Q is reflection in the straight line x = 2. Penjelmaan Q ialah pantulan pada garis lurus x = 2.
State the coordinates of the image of point (−3, 1) under the following transformations: Nyatakan koordinat imej bagi titik (−3, 1) di bawah penjelmaan berikut:
(i) P
(ii) PQ
[4 marks] [4 markah] (b) Diagram 11 shows three pentagons ABCDE, FGHIJ and MNPQJ on a Cartesian plane.
Rajah 11 menunjukkan tiga pentagon ABCDE, FGHIJ dan MNPQJ pada suatu satah cartesan.
Diagram 11
Rajah 11
(i) MNPQJ is the image of ABCDE under the combined transformations VU. MNPQJ ialah imej bagi ABCDE di bawah gabungan penjelmaan VU. (a) U
(b) V
(ii) Given that quadrilateral ABCDE represents a region of area 20 cm2, calculate the area, in cm2, of the region represented by the shaded region.
Diberi bahawa sisiempat ABCDE mewakili suatu kawasan yang mempunyai luas 20 cm2, hitungkan luas, dalam cm2, kawasan yang diwakili oleh rantau berlorek.
[8 marks] [8 markah] Answer:
QUESTION 16 Plans and Elevation FORM 4 Analysis Set
2012
1 Round off 0.0056129 correct to two significant figures.
Bundarkan 0.0056129 betul kepada dua angka bererti.
A 0.0057 C 0.0056
B 0.00560 D 0.00056
2 Express 1.601 × 10⁷ as a single number.
Nyatakan 1.601 × 10⁷ sebagai satu nombor tunggal.
A 0.00000001601 C 0.000001601 B 0.0000001601 D 0.00001601 3 Express 5 770 000 in standard form.
Nyatakan 5 770 000 dalam bentuk piawai.
A 5.77 × 10⁷ C 5.77 × 10⁷ B 5.77 × 10⁶ D 5.77 × 10⁶ 4 Convert 79110 to a number in base two.
Tukar 79110 kepada nombor dalam asas dua.
A 11000101112 C 11000100112
B 11000101102 D 11000001112
5 1100102 + 1010012 − 11102 =
A 10011002 C 10011112
B 10011012 D 11011012
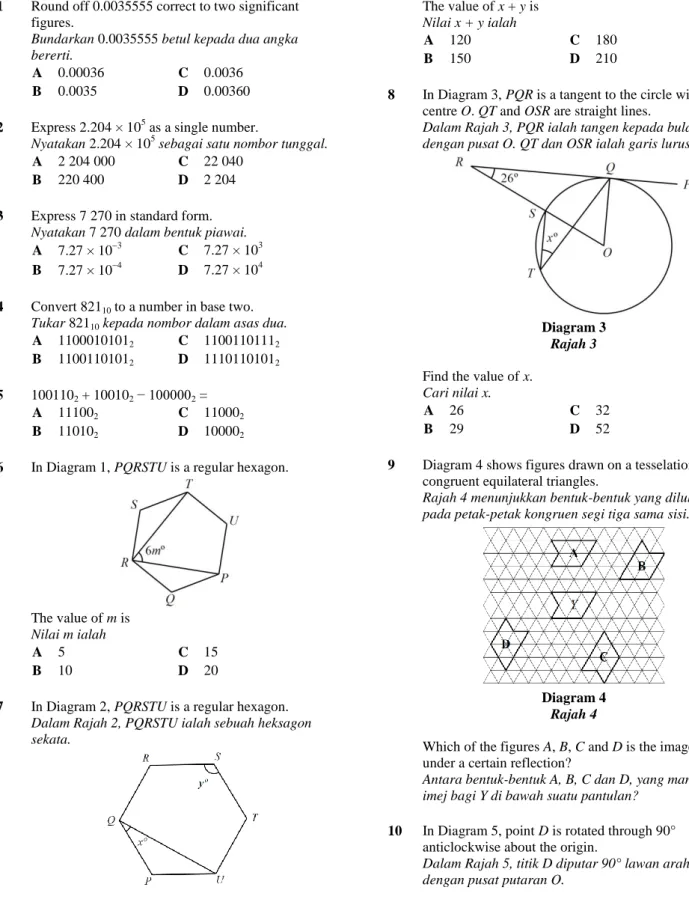
6 Diagram 1 shows a pentagon PQRST.
Rajah 1 menunjukkan sebuah pentagon PQRST.
The value of x is
Nilai x ialah
A 7 C 21
B 14 D 28
7 In Diagram 2, ABCDE is a pentagon and DEF is a straight line.
Dalam Rajah 2, ABCDE ialah sebuah pentagon dan DEF adalah garis lurus.
The value of x is
Nilai x ialah
A 99 C 109
B 104 D 114
8 In Diagram 3, PQ and QR are tangents to the circle with centre O.
Dalam Rajah 3, PQ dan QR ialah tangen kepada bulatan dengan pusat O.
Find the value of x.
Cari nilai x.
A 108 C 121
B 118 D 128
9 In Diagram 4, WX is a straight line.
Dalam Rajah 4, WX adalah garis lurus.
Soalan Ramalan Edisi Mid Term Pilihan 2 KERTAS 1 Exam Year: Mathematics FORM 5 / TINGKATAN 5 2012
Focus : Persediaan Peperiksaan Pertengahan Tahun
Reference: The analysis is base on last 6 year National SPM exam paper 2005-2011 and State trial Exam 2011 Disclaimer/Penafian:
The exam tips provided are base on pure forecast and assumptions. Maths Catch Network and www.maths-catch.com
will not be liable for any inaccuracy of the information. Students are not encouraged to rely 100% on the tips to score in SPM exams. Students are advised to study hard for their exam. Students can use the tips as a guide. All the materials have not gone for been proof reading or editing process.
24
2012
point Y under a certain reflection in the line WX?Antara titik-titik A, B, C dan D, yang manakah imej bagi titik Y di bawah pantulan di garis WX?
10 Diagram 5 shows figures drawn on a tesselation of congruent equilateral triangles.
Rajah 5 menunjukkan bentuk-bentuk yang dilukis pada petak-petak kongruen segi tiga sama sisi.
Diagram 5
Rajah 5
Which of the figures A, B, C and D is the image of P under a certain rotation about the centre O?
Antara bentuk-bentuk A, B, C dan D, yang manakah imej bagi P di bawah suatu putaran dengan pusat putaran O?
11
Given that tan x = −158 and 180° ≤ x ≤ 360°. Find the value of cos x.
Diberi tan x = −158 dan 180° ≤ x ≤ 360°. Cari nilai cos x. A −15 17 C 15 17 B −8 17 D 8 17
12 In Diagram 6, PQR and RUV are straight lines.
Dalam Rajah 6, PQR dan RUV adalah garis lurus.
Diagram 6
Rajah 6
Given that QW = 10 cm, QS = 10 cm and cos x° = −135 . Find the value of tan y°.
Diberi QW = 10 cm, QS = 10 cm dan cos x° = −135 . Cari nilai tan y°.
A −
15 C 8
B −178 D 158
13 Which of the following represents the graph of y =
−cos 4x° for 0° ≤ x ≤ 180°?
Antara yang berikut, yang manakah mewakili graf y = −cos 4x° for 0° ≤ x ≤ 180°?
A
B
C
D
14 Diagram 8 shows a cuboid.
Rajah 8 menunjukkan sebuah kuboid.
Diagram 8
Rajah 8
Name the angle between the plane RXY and the plane PQUT.
Namakan sudut di antara satah RXY dengan satah PQUT.
A ∠QXR C ∠XRQ
2012
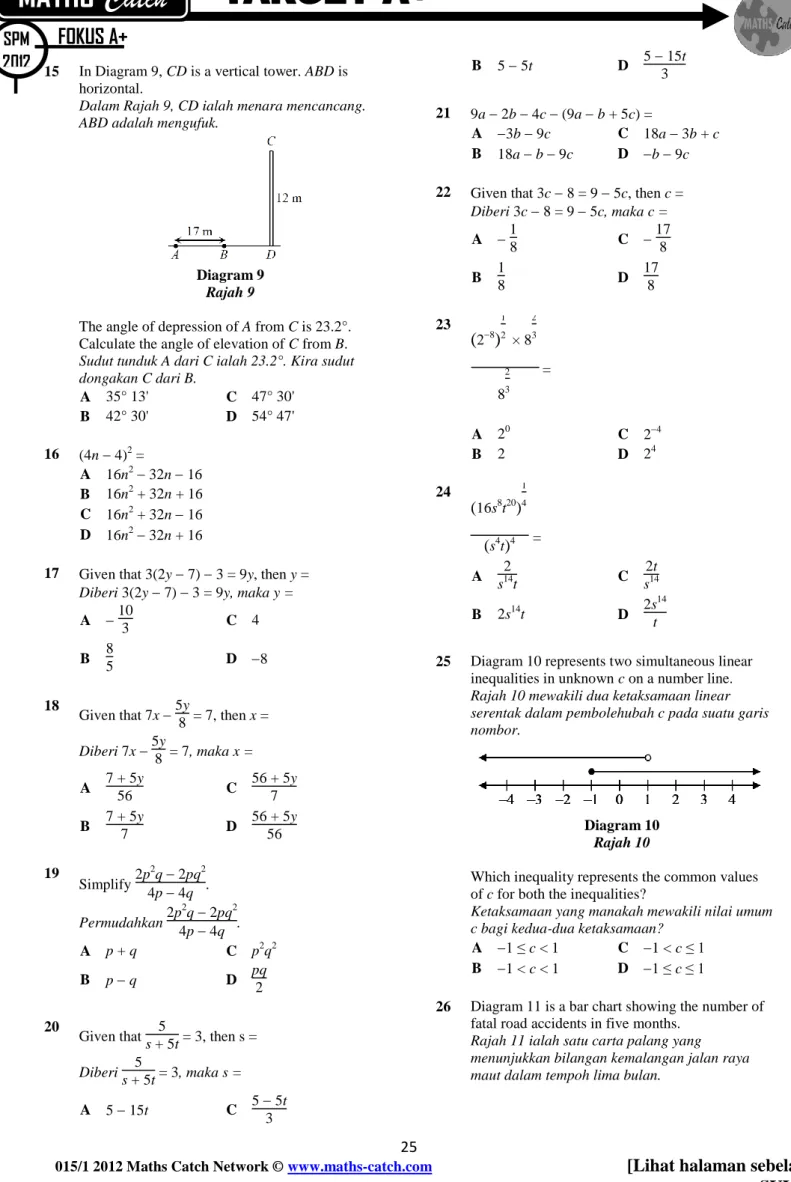
15 In Diagram 9, CD is a vertical tower. ABD ishorizontal.
Dalam Rajah 9, CD ialah menara mencancang. ABD adalah mengufuk.
Diagram 9
Rajah 9
The angle of depression of A from C is 23.2°. Calculate the angle of elevation of C from B.
Sudut tunduk A dari C ialah 23.2°. Kira sudut dongakan C dari B. A 35° 13' C 47° 30' B 42° 30' D 54° 47' 16 (4n 4)2 = A 16n2 32n 16 B 16n2 + 32n + 16 C 16n2 + 32n 16 D 16n2 32n + 16
17 Given that 3(2y 7) 3 = 9y, then y =
Diberi 3(2y 7) 3 = 9y, maka y =
A 10 3 C 4 B 8 5 D 8 18 Given that 7x 5y 8 = 7, then x = Diberi 7x 5y 8 = 7, maka x = A 7 + 5y 56 C 56 + 5y 7 B 7 + 5y 7 D 56 + 5y 56 19 Simplify 2p 2q 2pq2 4p 4q . Permudahkan 2p 2 q 2pq2 4p 4q . A p + q C p2q2 B p q D pq 2 20
Given that s + 5t5 = 3, then s =
Diberi s + 5t5 = 3, maka s = A 5 15t C 5 5t 3 B 5 5t D 3 21 9a 2b 4c (9a b + 5c) = A 3b 9c C 18a 3b + c B 18a b 9c D b 9c
22 Given that 3c 8 = 9 5c, then c =
Diberi 3c 8 = 9 5c, maka c = A 1 8 C 17 8 B 1 8 D 17 8 23
(
28)
1 2 × 8 2 3 8 2 3 = A 20 C 24 B 2 D 24 24(
16s8t20)
1 4( )
s4t 4 = A s142t C 2t s14 B 2s14t D 2s 14 t25 Diagram 10 represents two simultaneous linear inequalities in unknown c on a number line.
Rajah 10 mewakili dua ketaksamaan linear serentak dalam pembolehubah c pada suatu garis nombor.
Diagram 10
Rajah 10
Which inequality represents the common values of c for both the inequalities?
Ketaksamaan yang manakah mewakili nilai umum c bagi kedua-dua ketaksamaan?
A 1 ≤ c < 1 C 1 < c ≤ 1
B 1 < c < 1 D 1 ≤ c ≤ 1
26 Diagram 11 is a bar chart showing the number of fatal road accidents in five months.
Rajah 11 ialah satu carta palang yang menunjukkan bilangan kemalangan jalan raya maut dalam tempoh lima bulan.
26
2012
Diagram 11
Rajah 11
The difference between the highest number of fatal road accidents and the lowest is 40. Find the number of fatal road accidents in the month of July.
Perbezaan antara bilangan kemalangan jalan raya maut tertinggi dan bilangan kemalangan jalan raya maut terendah ialah 40. Cari bilangan kemalangan jalan raya maut dalam bulan Julai.
A 5 C 20
B 15 D 25
27 Diagram 11 is a bar chart showing the number of shirts sold in three months.
Rajah 11 ialah satu carta palang yang menunjukkan bilangan baju yang dijual dalam tempoh tiga bulan.
Diagram 11
Rajah 11
Which of the following statements is true about the sale of shirts?
Antara pernyataan berikut, yang manakah benar mengenai jualan baju itu?
A The sale of long-sleeved shirts in
September is 15 more than the sale in October
Jualan baju berlengan panjang pada bulan September adalah 15 helai lebih daripada jualan pada bulan Oktober
B The sale of long-sleeved shirts in October
Jualan baju berlengan panjang pada bulan Oktober adalah 25 helai lebih daripada jualan pada bulan November
C The total number of short sleeved shirts
sold in three months are 10
Jumlah bilangan baju berlengan pendek yang dijual dalam tiga bulan ialah 10 helai.
D The largest quantity of short-sleeved shirts
sold in three months is in November
Kuantiti baju berlengan pendek yang dijual dalam tiga bulan adalah paling banyak pada bulan November
28 Which of the following graphs represents y = −2 −
x2?
Antara graf yang berikut, yang manakah mewakili y = −2 − x2?
A C
B D
29 Given that the universal set ξ = P ∪ Q, set P = {l,
m, n} and set Q = {j, k, l, m, n}. Find the value of n(ξ).
Diberi set semesta ξ = P ∪ Q, set P = {l, m, n}
dan set Q = {j, k, l, m, n}. Cari nilai bagi n(ξ).
A 5 C 7
B 6 D 8
30 Diagram 13 is a Venn diagram which shows the elements of sets A, B and C.
Rajah 13 ialah sebuah gambar rajah Venn yang menunjukkan unsur-unsur bagi set A, B, dan C.
Diagram 13
Rajah 13
Given that the universal set ξ = A ∪ B ∪ C and
n(C') = n(A ∩ C). Determine the value of x.
Diberi set semesta ξ = A ∪ B ∪ C dan n(C') = n(A ∩ C). Tentukan nilai bagi x.