UNORCID, 2014. Stimulating Interim Demand for REDD+ Emission Reductions: The Need for a Strategic Intervention from 2015 to 2020, Global Canopy Programme, Oxford, UK; the Amazon Environmental Research Institute, Brasília, Brazil; Fauna & Flora International, Cambridge, UK; UNEP Finance Initiative, Geneva, Switzerland; and United Nations Ofice for REDD+ Coordination in Indonesia, Indonesia.
© The Global Canopy Programme (GCP), the Amazon
Environmental Research Institute (IPAM), Fauna & Flora International (FFI), the UNEP Finance Initiative (UNEP FI) and the United Nations Ofice for REDD+ Coordination in Indonesia (UNORCID) 2014.
Acknowledgements
The authors would like to thank the donor and forest country governments, and individuals from the private sector, who shared their views and helped shape the indings of this report.
The Interim Forest Finance Project is funded by the Norwegian Agency for Development Cooperation (NORAD). The views and interpretations in this report are those of the authors and do not necessarily represent those of NORAD.
The Global Canopy Programme (GCP)
The Global Canopy Programme (GCP) is a tropical forest think tank working to demonstrate the scientiic, political and business case for safeguarding forests as natural capital that underpins water, food, energy, health and climate security for all.
for the planet, where biodiversity is effectively conserved by the people who live closest to it, supported by the global community. Founded in 1903, FFI is the world’s longest established international conservation body and a registered charity. www.fauna–f lora.org
UNEP Finance Initiative (UNEP FI)
The United Nations Environment Programme Finance Initiative (UNEP FI) was established in 1992 as a partnership between policy makers and inancial intermediaries. With over 200 members representing banks, insurers, and investors from around the world, UNEP FI contributes the perspectives of inancial institutions to the United Nations and global activities on sustainable inance. UNEP FI’s mission is to bring about systemic change in inance to support a sustainable world by “Changing inance, inancing change”. www.unepf i.org
United Nations Ofice for REDD+ Coordination in Indonesia (UNORCID)
Immediate action is needed to stimulate demand for REDD+ emission reductions. There is currently no source of demand that will pay for medium to long-term emission reductions from REDD+ in the period between 2015 and 20201 (‘the interim period’), and do so at the scale needed to meet REDD+ emissions reduction targets in tropical forest countries.
This problem seriously threatens the successful implementation of REDD+, because without interim demand, there will be little or no incentive for forest countries to participate and redirect resources towards REDD+, or for the private sector to invest.
In order to stimulate demand for REDD+ emission reductions, the right incentives need to be in place for tropical forest country governments and the private sector, who can then commit the necessary inancial, human and political capital.
The Interim Forest Finance (IFF) project advocates a strategic intervention by donor country and tropical forest country governments, and public inancial institutions, to scale up demand for REDD+ emission reductions in the interim period. It would achieve this by using public sector funding to leverage considerably more private sector investment.
This report highlights the following key points:
There is a huge gap between
supply and demand
Basic calculations show that, between 2015 and 2020, projected supply of emission reductions from REDD+ and/or other forest and land-based activities is between 3 and 39 times larger than potential total demand. As of January 2014, the sources of potential demand for the interim period include the California Emissions Trading Scheme, FCPF Carbon Fund, BioCarbon Fund, Kf W REDD+ Early Movers Programme and the voluntary market2.
1 This report assumes that in 2020 a global climate agreement
will have been made and will be operational. The time between 2015 and 2020 is referred to as the ‘interim period’.
2 Other sources of demand may come online later in the interim period, such as the Norway-Indonesia Letter of Intent. See Table 1.
Early movers could exhaust current funding
For example, if the entire potential demand for international REDD+ offset credits from the California ETS between 2015 and 2020 were spent on compensating the State of Acre for their REDD+ emission reductions, it would pay for only around 70% of these emission reductions. The FCPF Carbon Fund, if it bought the remainder, would also exhaust its entire funds on purchasing emission reductions from Acre. The remaining fraction of total potential demand from the other sources mentioned above would need to cover emission reductions generated by all other early mover forest countries/states worldwide, during the interim period. It is unlikely that this is suficient capital, or a strong enough economic incentive, to ensure that forest countries continue to change their development pathways.Funding needs to be scaled up at least to the
magnitude of the Fast Start Finance pledges
In Copenhagen in December 2009, Annex I countries pledged approximately US$4.5 bn for REDD+ in the Fast Start Finance (FSF) period from 2010 to 2012 (ISU, 2011)3. According to the Voluntary REDD+ Database, the ive major donor countries – the UK, the USA, Norway, Germany and Australia – pledged around US$3 bn for REDD+. Assuming that a substantial proportion of emission reductions from forest and land-use activities in tropical forest countries are paid for through a REDD+ trading mechanism, demand must be scaled up to a level that results in a dollar value of primary market transactions between buyers and sellers (referred to as a ‘transaction value’) of between US$4 bn and US$48 bn in the interim period. Donor country governments need to pledge capital at least similar in size to the FSF funding in order to stimulate this level of demand. Such a pledge would also build on the inancial, human and political capital already committed in the FSF period.3 It should be noted here that numbers might have been revised since
Funding must be scaled up rapidly
Although the absorptive capacity of some tropical forest countries for REDD+ funding may be limited, without a inancial incentive in the interim period, tropical forest countries and the private sector have little motivation to invest the necessary political, human and inancial capital in REDD+. Funding therefore has to be scaled up rapidly, to provide incentives in the fast-approaching interim period. This also requires the use of a ‘light’ institutional structure to manage the funds, avoiding stagnation of capital.
Financial incentives need to
be clear and long-term
A performance-based inancial incentive, providing clear price signals to all counter-parties, will improve the risk-return proile of REDD+ investments, leverage private sector capital, match the goals of global REDD+ policy with the scale of funding needed to achieve those goals, and retain the political momentum of forest country governments. Emissions Reduction Purchase Agreements, options contracts and price loors could be used to provide this incentive, against which inancial capital could then be raised from the private sector.
The strategic intervention could build
on existing institutions and examples
Signiicant effort has gone into building momentum in the FSF period, and beyond, e.g. the FCPF Carbon Fund, and designing the Green Climate Fund as a conduit for REDD+ results-based inance. Examples from other sectors, such as the Public-Private Partnership (PPP) created under the Global Alliance for Vaccination and Immunisation (GAVI), which makes long-term inancial commitments to increase the immunisation of children in its partner countries, also demonstrates the successful use of international partnerships to scale up demand. Building on these institutions and examples will help to create or adapt institutions needed to scale-up demand for REDD+ emission reductions.The need to scale up demand now
There is currently no source of demand that will pay for medium to long-term REDD+ emission reductions in the period between 2015 and 2020 (‘the interim period’) at the scale needed to meet emission reduction targets in tropical forest countries, or international deforestation reduction targets. Immediate action is needed to stimulate demand for REDD+ emission reductions, and to obtain recognition for early action on REDD+ as part of a post-2020 global climate change agreement.
This lack of interim demand seriously threatens the successful implementation of REDD+, because without it, there will be little incentive for forest countries to participate and redirect national resources for REDD+, or for the private sector to invest in activities related to REDD+.
In order to stimulate demand for REDD+ emission reductions, the right incentives need to be in place for forest country governments and the private sector, who can then commit the necessary inancial, human and political capital.
The Interim Forest Finance (IFF) project
The Interim Forest Finance (IFF) project advocates a strategic intervention by donor country and tropical forest country governments, and public inancial institutions, to scale up demand for REDD+ emission reductions and accelerate inancial lows for tropical forests in the interim period.
The irst phase of the IFF project is composed of desk-based research and stakeholder consultations. The second phase is a campaign to secure an agreement from donor country governments, forest country governments, and public inancial institutions on the need to scale up demand, and then to facilitate the creation of a strategic intervention to scale up demand in the interim period.
This report
In the sections outlined below, this report explains the supply-demand gap in the interim period, and explores how it could be addressed by stimulating the public and private sector demand for REDD+ emission reductions in the interim period.
Lack of demand: What are the risks? explains why interim demand is so important for the future of REDD+: it will affect forest country and private sector motivation to participate and/ or invest in, or redirect resources towards, REDD+.
REDD+ supply and demand: How big is the gap? deines
the problem. It provides an overview of all potential sources of demand for REDD+ emission reductions from the voluntary and compliance markets and other non-market sources. It estimates the total projected demand for REDD+ emission reductions up to 2020, and reveals the order of magnitude difference between the supply needed if tropical forest countries reduce annual deforestation levels by 50% by 2020, and the total potential demand up to 2020.
Forest and land-use activities under a strategic intervention outlines the scope of land use and forest activities that could be considered in the strategic intervention. The suggested approach is grounded in the emerging school of thought that REDD+ exists within the context of other land use and forest activities. The international frameworks of Land Use, Land Use Change and Forestry (LULUCF) and REDD+ are explained, as well as the need to exploit links between the two.
The components of the strategic intervention discusses in more detail the three key components of the strategic intervention: (1) how capital can be generated; (2) how it can be deployed; and (3) how it can be managed. It irst outlines the recent pledges and disbursements in the 2010–2012 FSF period by eight donor countries, using this as a basis for raising the initial additional capital for the strategic intervention. Several inancial instruments for deploying and stimulating capital to address the lack of demand in the interim period are then outlined, and inally some possible options for the management of the intervention are examined.
Key Points
Without interim demand for REDD+ emission
reductions, there will be:
• Little economic incentive for forest countries to participate in REDD+
• Little motivation to redirect forest country
resources towards REDD+ activities
• Little incentive for private sector investment in REDD+ projects
There is currently no source of demand to pay for medium to long-term emission reductions from REDD+ at the scale needed to meet emission reduction targets in tropical forest countries, before 2020 (explained on page 11). This is in contrast to the principles that underpin the global REDD+ negotiations, e.g. the permanence of REDD+, and does not sit well with the promise of “predictable, results-based inance” by the international community in Cancun in December 2011 and in Warsaw in November 2013 (UNFCCC, Decisions 2/ CP.17, Decision -/CP.19).
This is a serious problem, because incentives to achieve results-based emission reductions in tropical forest countries are central to the successful implementation of REDD+. However, forest countries are only incentivised insofar as the incentive – in this case payments for emission reductions – actually exists. If there is little demand for the emission reductions, i.e. if there are very few counterparties to buy REDD+ emission reductions, then there is little incentive.
This creates a number of problems and entails various risks:
Little economic incentive for forest countries to participate in REDD+. Under the global climate negotiations, REDD+ is a mechanism that forest countries voluntarily agree to participate in, and there are no sanctions for failing to meet REDD+ related emissions targets. This means that incentives play a very important role. However, the current lack of demand means that there is little economic incentive to participate in REDD+. Meanwhile, REDD+ has become considerably more complicated and expensive to implement in comparison to several years ago, resulting in the already low incentive to invest in REDD+ being further eroded.
Little motivation to redirect forest country resources.
Considerable investment in political, human and inancial capital in a forest country is a precondition for the successful implementation of REDD+ programmes or projects. However, if there is a lack of long-term, credible and predictable economic incentives, forest countries have little motivation to divert resources away from economically viable ‘business as usual’ activities, in order to create the infrastructure and enabling conditions for REDD+.
Little incentive for private sector investment.There has been low mobilisation of private sector inance for REDD+ programmes or projects. This is not because of an aversion to investment in tropical forest countries: capital will low at scale if the risk-adjusted returns are acceptable. It is because there is no predictability of revenue or credible counterparties available to sign long-term, legally binding contracts4.
4 For example, non-REDD+ private sector investment in tropical
There is compelling evidence of the impact of lack of demand on market development and private sector investment in climate change mitigation programmes and projects. In the case of the Clean Development Mechanism (CDM), demand for Certiied Emissions Reductions (CERs) has fallen over many years. This was driven by many factors, primarily falling demand in the European Union Emissions Trading System (EU ETS), resulting in an oversupply of CERs, and causing the price to crash and investment to plummet.5
Following the UN Climate Conference in Warsaw in November 2013, it was reported that investment under the CDM had ground to a halt, with the carbon offset market ‘likely to remain “in a coma” for years’, due to low demand (Reuters, 2013b).
If demand for REDD+ emission reductions suffers the same fate, the ultimate consequence will be that the climate change mitigation potential of forests will not be harnessed, and forests may not play a permanent, central role within the global effort to address climate change.
Key Points
• Total potential demand for REDD+
emission reductions up to 2020 is currently about 253 MtCO2e.
• Reducing annual deforestation by 50% by 2020 amounts to a global supply of 3,300–9,900 MtCO2e from
all forest and land-use activities.
• This supply is 13–39 times greater than the total potential demand for
REDD+ emission reductions, requiring
transactions valued at US$15–48 bn
to ill the gap.
• It is very likely that only a proportion of this supply will be paid for through
international REDD+ trading mechanisms.
• As an example, if 25% of the supply were
paid for using international REDD+ trading
mechanisms, then supply would be 3–10
times greater than demand, requiring transactions valued at US$4–12 bn.
According to most estimates, tens of billions of dollars will be needed annually to address deforestation and forest degradation at a meaningful scale. UNEP, for example, suggests that an average annual additional investment of US$40 billion is required to halve global deforestation by 2030 (UNEP, 2011). We are currently far from achieving this target.
This section outlines the current sources of demand for REDD+ emission reductions from voluntary markets, compliance markets and non-market sources6. It then outlines the potential sources of demand in the interim period, and
6 This should not be considered a globally exhaustive list, but
it can be assumed to cover the majority of the potential sources of demand for REDD+ emission reductions.
estimates the mismatch between this demand and the supply of REDD+ emission reductions. Demand is deined as the volume of carbon that can be purchased by potential buyers of units of REDD+ emission reductions. Annex 1 describes the sources of potential demand for the interim period in greater detail.
Existing sources of demand
The majority of funding for REDD+ so far has been from the public sector. Around US$4.5 bn was pledged by Annex I countries in the 2010–12 period7, while very few commitments have been made outside the REDD+ FSF period8, which ended in 2012 (ISU, 2011).
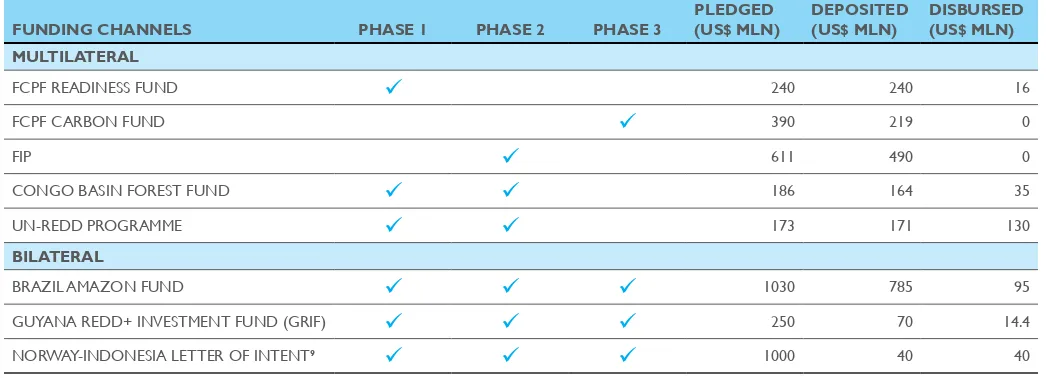
Public sector funds for REDD+ are channelled through a variety of multilateral and bilateral channels. Table 1 shows the allocation to and disbursement from a selection of these funds, as well as the phase of REDD+ on which they focus (see page 15 for a description of the phases).
As can be seen in the table, the majority of public sector funding channels are not focussing on purchasing REDD+ emission reductions (which can happen in Phase 3 of REDD+). Instead they are investing in REDD+ Readiness, preparing countries for the implementation of REDD+. Once countries have moved in to Phase 3, however, a large-scale source of demand for REDD+ emission reductions will be required to ensure REDD+ becomes sustainable in the future.
Demand can originate from market or non-market sources. Market-based demand can come from compliance markets, such as the California Emissions Trading Scheme, or from the voluntary markets. Non-market sources may include the funding channels listed in Table 1, as well as others such as the BioCarbon Fund and the KfW REDD+ Early Movers Programme (see Annex 1).
After 2020, demand is expected to originate from a compliance market established as part of a global climate change agreement under the UNFCCC. In the interim period, however (between 2015 and 2020), other compliance markets, voluntary markets and non-market sources must serve as a source of demand. 7 According to DFID (2012), the overall pledge for REDD+
in the FSF period is increased to US$6.1 billion.
8 The inance for climate change adaptation and mitigation pledged by industrialised
9 At the time of writing, Indonesia intends to create the FREDDI (see page 31) to manage the majority of this funding.
Table 1: Examples of the largest current REDD+ funding channels and the phases they target
FUNDING CHANNELS PHASE 1 PHASE 2 PHASE 3
PLEDGED (US$ MLN)
DEPOSITED (US$ MLN)
DISBURSED (US$ MLN) MULTILATERAL
FCPF READINESS FUND
ü
240 240 16FCPF CARBON FUND
ü
390 219 0FIP
ü
611 490 0CONGO BASIN FOREST FUND
ü
ü
186 164 35UN-REDD PROGRAMME
ü
ü
173 171 130BILATERAL
BRAZIL AMAZON FUND
ü
ü
ü
1030 785 95GUYANA REDD+ INVESTMENT FUND (GRIF)
ü
ü
ü
250 70 14.4NORWAY-INDONESIA LETTER OF INTENT9
ü
ü
ü
1000 40 40Source: Adapted from ISU, 2011 using data from climatefundsupdate.org, fundoamazonia.gov.br, fundoamazonia.gov.br/projects,
iftrustee.worldbank.org/webroot/data/GRIF_TR_03_13.pdf
Table 2: Sources of demand, as of January 2014, used for the calculation of interim demand
SOURCE OF INTERIM DEMAND*
INTERIM DEMAND VOLUME (TONNES OF CARBON) COMPLIANCE MARKETS
CALIFORNIA ETS
ü
80,000,000EU ETS 0
AUSTRALIAN CPM 0
NZ ETS 0
QUEBEC ETS 0
RGGI 0
JAPAN ETS 0
OTHERS 0
NON-MARKET SOURCES
BIOCARBON FUND
ü
28,430,00010FCPF CARBON FUND
ü
43,800,00011KFW REDD+ EARLY MOVERS PROGRAMME
ü
13,650,79312NORWAY-INDONESIA LETTER OF INTENT13 0
BRAZIL AMAZON FUND 014
GRIF 015
VOLUNTARY MARKET
PRE-COMPLIANCE MARKET (2013–2017)
ü
87,360,00016TOTAL INTERIM DEMAND 253,240,793
* Sources with a tick are those included in the calculation of the total potential demand as of January 2014. In some cases a potential demand source may not be included because there is insuficient information to make an estimate. See Annex 1 for more information.
101112 13
10 The size of the fund is US$280 million. A carbon price of US$5/ tonne is assumed, and that 50% of the fund is used to buy REDD+ emission reductions. It also includes the 430,000 tCO2 already allocated to REDD+ emission reductions in Tranche 2.
11 The size of the fund is US$219 million. A carbon price of US$5/tonne is assumed, and that 100% of the fund is used to buy REDD+ emission reductions.
12 The size of the fund is US$43 million. A carbon price of US$3.15/tonne is assumed, and that 100% of the fund is used to buy REDD+ emission reductions.
13 Publicly available information is currently insuficient to allow a reliable estimate
of the proportion of Phase 3 payments that will be used to stimulate demand, or to estimate a carbon price. For these reasons, the volume used in the calculation as of January 2014 is zero. For the full explanation see Annex 1.
141516
14 Since there is no exchange of REDD+ emission reduction units either between the fund and its donors, or between the fund and its recipients of capital, the effective demand for REDD+ emission reductions is zero.
15 Since there is no exchange of REDD+ emission reduction units either
between the fund and its donors, or between the fund and its recipients of capital, the effective demand for REDD+ emission reductions is zero.
16 The expected supply of REDD+ emissions reductions from 2013–2017 is 1.3
billion tonnes. The percentage of direct pre-compliance buyers in 2012 was 14%. In addition, the forest carbon market in 2012 found buyers for only 48% of
its supply. We assume that these igures will remain constant. We also assume
Supply and demand in the interim period
The sources of demand that are expected to be available in the interim period are outlined in Table 2. For a full description of all potential sources of demand, a discussion of whether they can be expected to come online in the interim period, and the calculations used, see Annex 1. Although the time horizons for some sources in Table 2 differ, and the calculations are based on assumptions, these values serve as an order of magnitude estimate of demand for REDD+ emission reductions in the period 2015 to 2020. The total potential demand for REDD+ emission reductions up to 2020 is approximately 253 MtCO2e (see Table 1). To make an assessment of the difference between supply and demand, the 253 MtCO2e of demand must be compared with supply, where the latter is deined as the proportion of forest and land-use emission reductions paid for through REDD+. No global estimate for all emission reductions targets in tropical forest countries exists. Therefore, to illustrate the size of the difference between supply and demand, we make a number of comparisons. First we compare the demand with the emissions reductions target of the State of Acre in Brazil, and then with a global deforestation reduction target.
The State of Acre has a target to reduce its deforestation rate by 80% by 2020 (WWF, 2013). Since over 95% of Acre’s emissions are a result of land use change and forestry, nearly all of this reduction in emissions could be compensated for using REDD+ payments. Assuming a linear reduction, and that all emission reductions are compensated for, Acre will generate a supply of approximately 118MtCO2e between 2012 and 2020 (WWF-UK & GCP, 2013).
If the entire anticipated demand from the California cap and trade program were to be used to buy Acre’s emission reductions, it could pay for only 68%. For Acre’s supply to be fully paid for using the sources of demand in Table 2, the FCPF Carbon Fund will also need to exhaust almost its entire funds on purchasing emission reductions from Acre. The remaining 129 MtCO2 of demand available would need to cover emission reductions generated from the other 96% of the Brazilian
Amazon (Acre represents just over 4% of the Brazilian Amazon), plus the remaining emission reductions generated from other tropical forest countries, worldwide, between now and 2020.
As an alternative way of assessing the difference between supply and demand in the interim period, consider a global target of a 50% reduction in annual deforestation levels by 2020 (compared to current levels)17. The target proposed by the European Commission, which includes many donor countries, and is used here in the absence of a global target agreed by all countries. A set of scenarios are used because estimates of emissions from deforestation differ18. The two most extreme scenarios – upper and lower bounds – estimate that between 3,300 MtCO2e and 9,900 MtCO2e of emission reductions will be generated between 2015 and 2020 from all forest and land-use activities. In contrast, the total potential demand for REDD+ emission reductions is only around 253 MtCO2e. The supply of emission reductions from forest and land-use activities is between 13 and 39 times greater than the total potential demand for REDD+ emission reductions in the interim period.
Using the two scenarios above, and assuming a carbon price of US$5/tCO2, the supply-demand mismatch equates to a gap of around US$15–48 bn of primary market transactions in the interim period. (Note: an implicit price for forest carbon is unlikely to emerge whilst there is no liquid secondary market. In the absence of this, US$5/tCO2 is an estimate of the carbon price used by some market participants, e.g. the Amazon Fund.)
17 In the recent IPCC AR5 report, carbon emissions from land use change
were identiied as the second largest contributor to global warming. The report identiies a target of a 50% reduction in emissions from
deforestation, which would be commensurate with the substantial contribution of this sector to global warming and with the need to limit the global temperature rise to 2 degrees Celsius.
It is likely that not all emission reductions from forest and land-use activities will be sold through an international trading mechanism, such as an international REDD+ offsetting mechanism, as many will likely be used to meet domestic emission reduction targets.
If, for example, only 25% (825–2,475 MtCO2e) of all forest and land-use emission reductions are paid for using international REDD+ trading mechanisms, then the supply is between 3 and 10 times greater than demand, and the gap is valued at around US$4–12 billion. This scenario assumes a signiicant role for an international trading mechanism, but not such a large role that it disincentivises domestic action in the industrialised, non-tropical forest countries. It should be noted, however, that this is a hypothetical value, and that the proportion of emission reductions that can or may need to be achieved through such a mechanism may be far greater.
Key assumptions used in estimating global supply and demand
ASSUMPTION REASON
A global deforestation reduction target of 50% on current levels by 2020.
The target proposed by the European Commission, which includes many donor countries,
and is used here in the absence of a global target agreed by all countries.
Not all forest and land-use emission reductions
will be paid for through an international REDD+ trading mechanism. In this report, we use 25% as an example of the percentage of the
global supply of forest and land-use emission reductions that are paid for through REDD+.
The importance of an international trading mechanism for REDD+ emission reductions under the anticipated global climate agreement is undecided. We assume that for every four units of REDD+ emission reductions generated by tropical forest countries, at least one is sold on the
international market, likely to be used as an offset, while three are used for compliance with domestic targets. This assumes a signiicant role for an international trading mechanism, but not such a large
role that it disincentivises domestic action in the industrialised, non-tropical forest, countries.
Carbon price of US$5/tCO2 An implicit price for forest carbon is unlikely to emerge whilst there is no liquid secondary market. In the absence of this, US$5/tCO2 is an estimate of the
Figure 1: Estimated global REDD+ supply and demand from 2015–2020: a comparison
9,900
MtCO
2
e
SUPPLY: Upper bound estimate of global supply of emission reductions needed from all forest and land-use activities in order to achieve a 50% reduction in deforestation by 2020.
253
MtCO
2
e
DEMAND: Total potential demand for REDD+ emission reductions between 2015 and 2020, as of January 2014.
825
MtCO
2
e
SUPPLY: Example of supply of REDD+ emission
reductions from 2015–2020. In this scenario, the lower
bound estimate of global supply (3,300 MtCO2e) is used
and we assume that 25% of emission reductions are sold internationally through a REDD+ trading mechanism.
2,475
MtCO
2
e
SUPPLY: Example of supply of REDD+ emission
reductions from 2015–2020. In this scenario, the upper
bound estimate of global supply (9,900 MtCo2e) is used
Key Points
• The scope of activities considered for a strategic
intervention is best deined using a cross-sectoral landscape approach.
• Activities accounted for under both the REDD+
and LULUCF frameworks should be considered.
Different activities linked to forests and land use, such as forest conservation and agroforestry, will generate different emission reductions. Therefore, in order to maximise emission reductions, the scope of activities to be covered by the intervention should be carefully deined. It is also becoming clear to stakeholders that REDD+ must be couched within the context of other land use and forest activities if it is to succeed. This way of grouping activities is referred to as a ‘landscape’ approach for land use and forest activities.
The most commonly used frameworks for categorising land use and forest activities are those used in the international frameworks of Land Use, Land Use Change and Forestry (LULUCF), and Reducing Emissions from Deforestation, Forest Degradation, Conservation, Sustainable Forest Management and the Enhancement of Forest Carbon Stocks (REDD+). There are also frameworks in the voluntary markets for REDD+ emission reductions.
The IFF project advocates adopting a cross-sectoral landscape approach which exploits the links between REDD+ and LULUCF, by grouping activities which promote high carbon stock land use in forests and agricultural areas.
Below, we describe LULUCF and REDD+ and the links between them, and explain how these links can help provide a logical scope of activities for the strategic intervention.
Land Use, Land Use Change and Forestry
(LULUCF)
Under the UNFCCC, LULUCF is a framework for grouping activities that cause anthropogenic greenhouse gas (GHG) emissions from land use, land-use change and forestry activities (UNFCCC, 2013). The LULUCF framework is used by all Parties of the UNFCCC to report on their GHG emissions from different types of land. Kyoto Protocol signatories must account for their GHG emissions from a range of different types of land-based activities, including afforestation, reforestation, deforestation and forest management. Parties can also voluntarily account for emissions from cropland management, grazing-land management, revegetation and wetland drainage and rewetting.
The LULUCF information is used to assess compliance in meeting emission targets, and is essential for participation in the Kyoto Protocol’s emissions trading scheme, Joint Implementation mechanism, and the Clean Development Mechanism (CDM). Under the CDM, emission-reduction projects in developing countries can earn credits called certiied emission reductions (CERs). These tradable credits can be used by industrialised countries to meet a portion of their emission reduction targets under the Kyoto Protocol. This process is known as offsetting. Among the different types of LULUCF activity, there are only two – afforestation and reforestation – which can currently be used by industrialised countries to offset under the CDM (UNFCCC, 2012). There are no immediate signs as to whether this will change to include a broader range of activities.
Reducing Emissions from Deforestation
and Degradation (REDD+)
While mitigation from activities that fall under the LULUCF framework applies to industrialised countries, mitigation that falls under the REDD+ framework applies to developing countries.
carbon stocks associated with that land. And similar to the CDM, REDD+ is also a mechanism that can channel capital from industrialised countries to forest countries by, for example, the process of offsetting.
The development of REDD+ at a national level in developing countries is implemented in three phases (UNFCCC, 2011): Phase 1 – planning and capacity building; Phase 2 – implementation of a national REDD+ strategy; and Phase 3 – payments for results-based emission reductions. Parties to the UNFCCC recognise the role of market-based approaches in providing result market-based payments for REDD+, though no agreement has yet been reached on the deinition of market based approaches.
Links between REDD+ and LULUCF
Both REDD+ and LULUCF were developed for the same purpose – to protect and enhance sinks and reservoirs of GHGs (e.g. forests) and to prevent GHG emissions from land-use change. As would be expected, the activities that fall under the two frameworks have many similarities. For this reason, Parties under the UNFCCC are considering whether the REDD+ framework could also include
activities from the LULUCF framework, in addition to the ive types of activities already agreed (Climate Focus & Climate Advisers, 2012). The set of additional activities from the LULUCF framework that are under consideration include those linked to agriculture and livestock.
Crop-based agriculture is responsible for an estimated 14% of global GHG emissions (GEF, 2012), while livestock adds an additional 14.5% (FAO, 2013). They are both direct and indirect drivers of deforestation as well as land and forest degradation (GCP, 2013). Agriculture has been widely overlooked in the climate change negotiations and is largely absent from the main climate change inancing mechanisms (FAO, 2010; DFID, 2011). It is not formally part of REDD+ negotiations, nor is it included in the deinition of REDD+.
However, there is growing recognition that implementation of REDD+ can only be achieved in conjunction with more
sustainable land use activities, such as the cropland and grazing-land management activities incorporated under LULUCF. Certain modiications to cropland and grazing-land management can avoid deforestation or conserve forest carbon stocks – both of which are activities under the REDD+ framework – and generate emission reductions.
The importance of agricultural activities is also
relected in groupings adopted in the voluntary market for emission reductions. There has been a push for comprehensive carbon accounting for land use activities across the spectrum of land-use and forest activities, using groupings such as agriculture, forestry and other land uses (AFOLU), reducing emissions from all land uses (REALU), and climate-smart agriculture (CSA).
The IFF project advocates exploiting the obvious links between REDD+ and LULUCF for this strategic intervention. This can be best achieved by adopting a cross-sectoral landscape approach, and grouping activities which promote high carbon stock land use in forests and agricultural areas.
This approach includes activities that are eligible under the REDD+ framework, but also incorporates cropland and grazing-land management activities as deined by the LULUCF framework. The emission reductions generated from these activities, however, will ultimately be compliant with the REDD+ accounting framework. In the voluntary market groupings, forest and land-use activities will almost certainly reside in, or be similar to, the AFOLU, REALU or CSA groupings.
It is important to note that there will be inherent challenges in this approach. Whilst carbon accounting methodologies have been developed for activities and projects linked to agriculture (e.g. the Veriied Carbon Standard for the Kenya Agricultural Carbon Project19), they are technically complex, often inlexible, and associated with high monitoring, reporting and veriication costs (PwC, 2011). Furthermore, methodologies are not yet readily
available, or have not been tested, for the full scope of activities to be incorporated under the intervention.
These methodological barriers raise questions of compatibility and fungibility with other traded emission reductions. This is exempliied by the fact that, at least for now, the majority of agricultural activities are ineligible under the CDM. This is because of challenges in aggregating emission reductions from smallholders, non-scalable project approaches, capital and capacity constraints, and others (PwC, 2011; DFID, 2011).
In addition, not all agriculture activities are the same (e.g. export-oriented monocultures are not the same as small-scale farming), making it dificult to measure the co-beneits20 expected from each project and their socio-environmental integrity21 (Reyes, O. 2011). It is also important to conduct due diligence to avoid generating REDD+ emission reductions from activities on land that was obtained illegally or without proper consent, e.g. through land grabbing.
Despite these potential challenges, it is important to pursue this integrated approach, because of its potential to allow low carbon development in tropical forest countries, while also addressing the drivers of deforestation and poverty reduction, and reducing the risk of carbon leakage.
20 Co-beneits are the in-direct beneits associated with a project, and are not the project’s primary aim. They beneit some or all of the project
stakeholders. For example, a project may have a primary goal of reducing
emissions from agriculture, but also provide co-beneits such as local
employment, community development, access to markets, etc.
21 For example, soil carbon sequestration can be achieved by no-tillage agricultural practices on monoculture plantations to generate emission reductions. This is different from agroforestry practices and the associated emission
reductions, because the latter can provide a wider range of co-beneits that
Key Points
• The strategic intervention would use donor country government capital to stimulate demand
for forest and land-use emission reductions, illing the supply-demand gap.
• It should focus on purchasing, and stimulating
the private sector to purchase, REDD+ emission reductions.
• It can increase certainty over the price and/or
volume of REDD+ emission reductions, and with
complementary efforts it can also support the
development of a liquid secondary market by 2020.
A strategic intervention is needed, by donor country governments, forest country governments and public inancial institutions, to ill the gap between supply and demand for REDD+ emission reductions. Public sector capital should be deployed to increase both public and private sector demand, and accelerate inancial lows for forests at the scale of billions of dollars.
This strategic intervention could offer payments for, or linked to, the delivery of REDD+ emission reductions. It could also offer products and services to ensure that the supply of REDD+ emission reductions can meet the growing demand once stimulated by this intervention.
The intervention should focus on two broad areas of operational activity:
1. Purchasing emission reductions from forest and land-use activities;
2. Stimulating the private sector to purchase emission reductions from forest and land-use activities.
The strategic intervention can stimulate demand primarily by offering greater certainty over the price, volume or both, for forest and land-based emission reductions.
This will scale up demand for emission reductions from these activities, create investment-grade conditions and a track record for REDD+ programmes and projects (which is a prerequisite for scaled-up investment from large institutional investors), and therefore stimulate additional investment. This kind of incentive mechanism is known as an Advance Market Commitment (AMC).
Public sector capital can be used to create conditions under which competitive risk-adjusted returns can be achieved in the interim period. The intervention can do this by stimulating the overall demand for forest and land-based emission reductions, thus increasing revenue certainty for relevant projects, and providing incentives and favourable investment conditions for governments and the private sector to enter long-term, results-based contracts.
The proposed intervention can also offer inance (e.g. grants, equity or concessional loans) for the development of relevant programmes and projects (i.e. the supply), in order to ensure an ongoing balance between the increased demand of emissions reductions and the supply. Risk mitigation instruments, such as commercial and political risk insurance, can also be used in parallel, as well as technical assistance and advisory services.
The strategic intervention will, by deinition, be incentivising an aggregate increase in investments in sustainable land use and forests. Over time, private sector investors may wish to gain exposure to these emerging sectors, but only if they can invest on a large scale (i.e. hundreds of millions of USD). If this is the case, the strategic intervention may be able to attract investment at this scale.
Finally, measuring the success of the strategic intervention will help it meet its goals. The success of the strategic intervention can be measured by comparing the
Similar initiatives in other sectors
The healthcare sector
The Global Alliance for Vaccination and Immunisation (GAVI) is a public–private partnership which makes multi-year, long-term inancial commitments to increase the immunisation of children in its partner countries. GAVI has contributed to the immunisation of 370 million children and committed US$7.9 billion since 2000. It encourages ownership and co-inancing by the countries with which it works, tries to stimulate private sector participation, and works with existing institutions, including national health systems.
The GAVI operating model is based on three inancing mechanisms to generate long-term, predictable inance: 1. Matched giving from foundations and the public sector.
The UK’s Department for International Development (DFID) and the Gates Foundation have pledged US$130 million in total to GAVI, if it is matched by contributions from the public sector, dollar for dollar. This mechanism is designed to raise US$260 million by 2015.
2. The International Finance Facility for Immunization (IFFIm). This was set up in 2006 to accelerate the availability and predictability of funding. It uses long-term (up to 20 years), legally binding pledges from donor governments to back vaccination or immunisation bonds that are sold in to the capital markets. As of July 2013, IFFIm has raised US$4.5 billion, backed by pledges of up to 23 years from the governments of seven donor countries.
3. An Advance Market Commitment (AMC) mechanism, i.e. a commitment to buy a given volume of vaccines at a given price. The price paid by the AMC for the irst two years was US$7.50 per dose (to help cover upfront development costs), and then reverted to a maximum of US$3.50 per dose for years 3 to 10.
The renewable energy sector
Feed-in tariff (FiTs) schemes are one of the most prevalent national renewable energy policies used globally. They have driven rapid renewable energy scale up in key markets. According to calculations by Bloomberg New Energy Finance,
FiTs were linked to 87% of solar photovoltaic deployment and 64% of wind projects globally by mid-2011, with a large degree of deployment in the developed world, particularly in Europe.
FiTs are a type of performance-based, public-private partnership. The price paid to electricity producers is
guaranteed at some level, or supported with a subsidy, through a long-term contract (ranging from 10 to 25 years). The reasonably certain rate of return that FiTs provide over a long time frame gives investors the conidence to deploy capital at a large scale. Public support is required to maintain Transparency, Longevity and Certainty (TLC)22 for investors over extended periods of time, so transparent periodic reviews are preferable. This allows the FiTs to respond to changing market conditions and to ensure cost and price effectiveness while maintaining fair returns to investors on the pathway to grid parity.23
Transferrable lessons
Both the examples above, from the health and energy sectors, share certain properties with REDD+. They involved relatively high upfront or capital expenditure costs, operate over relatively long timeframes, have relatively low operating costs and have faced uncertainties over market variables (such as price and demand).
Furthermore, to achieve results at scale, they both required the deployment of signiicant amounts of private sector capital. This creates a number of transferable lessons.
First, investment is driven by expectations of future returns, and responds well to targeted support if the incentives are attractive enough. The most effective incentives provide investors with TLC while seeking to minimise costs. Germany has deployed renewable energy since 1990, and China has deployed wind energy since 2000, both using attractive incentives.
22 Transparency relates to the ease with which policy can be understood
and executed. Longevity relates to the policy matching the investment horizon and Certainty relates to the policy delivering a measurable revenue stream to support a reasonable rate of return. For more information, refer to Deutsche Bank Climate Change Advisors (2009).
23 The point at which the cost per unit of electricity generated by renewables
Second, scaled-up investment requires a suitable instrument for investors. In the renewable infrastructure sector, most investment to date has been in unlisted private equity and debt vehicles24. These investments involve a 7–10 year commitment and little liquidity25. In contrast, the largest pools of private sector capital are in pension and insurance funds, which allocate capital to liquid, listed investments. A much deeper pool of capital could therefore be accessed if listed investment vehicles were available.
Third, policy uncertainty is highly damaging for investors. This is especially true with retroactive changes to policies that result in a weakening or elimination of the expected inancial returns on existing investments. These changes – like Spain’s retroactive adjustments to solar FiT rates – have diminished investor conidence (IIGCC, 2013).
Fourth, there can be trade-offs between eficiency and effectiveness. Generous subsidies can be effective in attracting capital, but might be costly on a unit cost basis, and therefore ineficient. However, it is important to note that there is a cost to all incentive regimes, however effectively they are managed over time.
Finally, legally binding inancial commitments by donor country governments were a key element of success in the GAVI’s AMC mechanism. This provided tangible inancial guarantees to manufacturers, and was crucial in building momentum with the partner countries, donors to the initiative, as well as product and service suppliers (Dalberg Global Development Advisors, 2013). This is an important lesson, given that there has been a lack of legally binding inancial commitments from donor country governments to REDD+ since the end of the FSF period.
There are many clear and transferable lessons above that can inform a strategic intervention in the REDD+ sector. However, it should be noted that in the case of renewable
24 These are legally separate entities (to the investor in the debt vehicle, and the bank) that buy debt that is linked to infrastructure, e.g. infrastructure project loans.
25 Liquidity is the ability to sell your investment and receive the resulting funds in a short period of time.
There are many funds and mechanisms with similar
aims to this strategic intervention. This
intervention differs from existing funds and mechanisms in some important ways:
Larger scale funding. Although there are existing
mechanisms that can pay for emission reductions in the interim period, they are of a considerably smaller
scale than the funding required to, for example,
reduce global annual deforestation rates by 50%
by 2020. To achieve this or a similar goal, funding
needs to be scaled up to the order of billions of
dollars, i.e. to a similar scale to the FSF pledges.
Funding used to provide incentives. This
project advocates clear, long-term incentives as a means
of scaling up demand. Using a single variable such as price, a ‘price signal’ can be created using a loor price, a combination of a loor price and a capped price, or
through an Emission Reduction Purchase Agreement
(resembling a inancial forward contract). The details of
the contract could be negotiated bilaterally, or prices
could be determined, for example, by auctioning.
Targeted incentives: private sector and
forest countries. The value of this proposal
goes beyond just providing a scaled up source
of interim demand for REDD+. It incentivises
an increase in private sector investment in
REDD+, demonstrates continued donor country commitment to REDD+, and maintains the political commitment of forest country governments.
Flexibility of incentives. Payment on delivery of
emission reductions is not the only way of incentivising
an increase in demand. Contracts might also involve prepayment of a portion of the inal contract value, for example, or minimum prices for emission reductions.
Flexibility of design. While existing funds or
mechanisms can arguably be scaled up (e.g. the FCPF Carbon Fund), this intervention can be lexibly designed. If needed, new partnerships could be created, e.g. a PPP modelled on the GAVI. Other design
features can be tailored to donor country, forest country or private sector needs, including governance, accountability, eligibility criteria, safeguards, the
architecture of the mechanism and how it uses funds.
A logical scope of activities. This intervention
exploits the obvious links between REDD+ and LULUCF by adopting a cross-sectoral landscape
approach, and grouping activities from both frameworks which promote high carbon stock
land use in forests and agricultural areas.
Finance and technical assistance. The
intervention need not just provide incentives. Technical assistance or inancial instruments (e.g. grants or
concessional loans) can also be offered, increasing
access to capital and early stage project development.
Demand beyond 2020. This initiative will lay out
the spectrum of options for creating interim demand. It will also help inform the design of the larger inancial
mechanisms that the international community hopes
Key Points
The proposed intervention has three main components:
• Generation of capital, options for which are guided by the spending plans of eight major donor countries;
• Deployment of capital, through the provision
of incentives, inance and risk management, and
technical assistance and advisory services;
• Implementing institutions, which could be existing or new multinational funds, the Green Climate
Fund, national REDD+ funds, international crediting mechanisms, or public private partnerships.
To address the lack of demand for REDD+ emission reductions, the IFF project proposes a strategic intervention by donor country governments, forest countries, and public inancial institutions. It is assumed that the initial capital to fund this strategic intervention will be provided by primarily donor country governments. This public sector capital would then be used to stimulate the purchase of REDD+ emission reductions by the public and private sectors, with the objective of creating a much larger transaction value.
This section explores the potential sources of money from donor country governments, possible instruments through which the money could be spent, and institutions that could manage the money. In each of the sections, it is evident that there are clear links to existing policies, institutions and inancial mechanisms. These links are made clear when relevant.
Generation of capital
This section explores the inancing for REDD+ of eight major donor countries. It outlines their history of pledges and disbursements up to and during the 2010–2012 period, sheds some light on their post-2012 plans and explores the relevance of these plans in addressing the demand problem for the interim period.
Australia
Australia inances REDD+ through the International Forest Carbon Initiative, bilateral relationships with Indonesia and Papua New Guinea, and key multilateral initiatives such as the FCPF and FIP. By 2010 Australia had allocated US$66 million towards REDD+, just under 30% of which was bilateral (REDD+ Survey, 2010). In June 2010 Australia announced that it would contribute approximately US$560 million to climate change as part of its FSF commitments, US$130 million of which would be for REDD+ (Australian Government, 2010).
According to submissions to the UNFCCC, Australia fully met this commitment (UNFCCC, 2013). The US$ 130 million to be allocated to REDD+ went to the International Forest Carbon Initiative to assist developing countries implement REDD+ (UNFCCC, 2013). Total funding for REDD+ reported by the Voluntary REDD+ database from 2007 until 2013 is approximately US$ 182.55 million (Voluntary REDD+ Database, 2013).
Following the general elections in September 2013 and COP19, the Australian Government has not announced pledges for forest-related inance in the post-2012 period. Nevertheless, assuming that political momentum for REDD+ inancing remains, this strategic intervention could prove to be a key tool for Australia in expanding and strengthening its positive and strong historical engagement on REDD+, particularly with Indonesia.
Germany
Germany inances REDD+ activities in developing countries through the Federal Ministry for Economic Cooperation and Development (BMZ). The Federal Ministry for the Environment, Nature Conservation and Nuclear Safety (BMU) also supports climate protection projects through the International Climate Initiative (ICI).
announced that it would spend approximately US$500 million between 2010 and 2012 on REDD+, and reported in 2012 that around US$ 390 million of this had been disbursed towards REDD+ activities in developing countries (Voluntary REDD+ Database, 2013). Germany also inances performance based payments for REDD+ through its REDD Early Movers (REM) programme (see Annex 1 for more information). With a funding volume of €32.5 million, REM has already agreed to spend around €19 million buying 8 million tCO2 from REDD+ activities in the State of Acre over a four year period.
Germany’s post-2012 engagement will depend on the policies of its new government26, as well as the on-going progress of international climate change negotiations. Nevertheless, funding for this strategic intervention supports Germany’s historical funding strategy, and builds on the steps already taken to address the lack of demand by the REM.
Japan
Japan inances REDD+ through bilateral partnerships with governments, as well as grants to multi-national funds such as the Global Environment Facility (GEF). Before 2010, Japan had allocated around US$4 billion for REDD+ activities and technical assistance (REDD+ Survey, 2010), of which around 60% was loans, grants, and technical assistance provided through bilateral relationships. It is unclear whether this inance is new and additional (although this requirement was irst placed on countries for the Fast Start Finance (FSF) period, i.e. post-2010). Between 2010 and 2012 – i.e. during the FSF period – Japan allocated approximately US$720 million to REDD+ (UNFCC Delegation of Japan, 2013), with grant aid, technical assistance and contributions to multilateral funds accounting for just under one third.
Japan has set up the Joint Crediting Mechanism (JCM) as a complement to the CDM. Using bilateral agreements with forest countries, Japan can obtain emission reductions from REDD+ projects.27 A JCM Partnership with Indonesia has been signed, and feasibility studies are already examining the
26 General elections took place in Germany on the 22nd of September 2013.
27 For more information: http://www.mmechanisms.org/e/
potential of REDD+ projects generating emission reductions in Indonesia and Vietnam (New Mechanisms Express, 2013).
Similar to Germany, Japan recognises the need to take early action to pay for performance, as evidenced by its creation of the JCM. Funding for this strategic intervention builds on bilateral action, providing another means of funding performance-based payments.
Norway
Before 2010, Norway had spent approximately US$272 million in REDD+ related activities with 20% channelled towards the UN-REDD programme and 11.4% towards the Congo Basin Forest Fund (REDD+ Survey, 2010).
Prior to 2010, Norway pledged approximately US$1 billion to REDD+ related activities for the FSF period (Voluntary REDD+ Database, 2013), but the actual inancial resources disbursed surpassed the pledge. Norway disbursed approximately US$1.2 billion, 50% of which was directed to the Amazon Fund and around 9% was allocated to the Forest Investment Partnership (Norwegian Climate Finance Report, 2012).
Towards the end of the FSF period, Norway signed bilateral agreements with Brazil, Guyana, Indonesia, Mexico and Tanzania. In the case of Brazil, Norway has pledged almost US$1 billion until 2015 through the Amazon Fund (Ogonowski.M, 2012). A partnership between Norway and Indonesia was signed in 2010 and the Norwegian government pledged US$1 billion (Norwegian Climate Finance Report, 2012). The objective is to support Indonesia in its efforts to “reduce emissions from deforestation and degradation of forests and peat lands” (Norwegian Climate Finance Report, 2012).
Initiative for Sustainable Forest Landscapes (BMU, 2013). The proposed strategic intervention would build on Norway’s strong political commitment in advancing REDD+ to date, consolidating and further scaling up investment in REDD+.
Spain
Before 2010, Spain had allocated approximately US$16.5 million for REDD+, with 44% allocated to the FCPF
Readiness Fund and 56% to the GEF (REDD+ Survey, 2010). Between 2010 and 2012 Spain spent approximately US$ 49 million on REDD+ (Voluntary REDD+ Database, 2013).
Although Spain has allocated resources directly to some countries through its International Cooperation and Development Agency, these resources are smaller than other donor countries. In Mexico, for example, Spain allocated approximately US$55,000. In other cases, such as Senegal, DRC and Indonesia, quantities are unknown (REDD+ Survey, 2010).
Spain’s post-2012 inance commitment and its role in scaling up demand for REDD+ emission reductions is not yet clear.
Switzerland
In February 2011, the Swiss Federal Parliament approved an FSF pledge of approximately US$160 million (UNFCCC Delegation of Switzerland, 2011).
During 2011, Switzerland allocated approximately US$11 million to support sustainable forest management in developing countries, primarily in the form of grants to the FCPF and Indonesia’s REDD+ Presidential Task Force – US$9.5 million and US$1.1 million respectively (SECO, SDC & FOEN, 2012). In 2012, Switzerland spent additional inance for REDD+ activities bringing its total contribution for the 2010 to 2012 period to approximately US$24 million (SDC, SECO &FOEN, 2013). According to the Voluntary REDD+ Database, in 2013 Switzerland allocated around another US$8 million for REDD+.
Although a smaller contributor than other donor countries, Switzerland is expected to continue to support REDD+.
Participation in a strategic intervention for REDD+ will build on the investments made to date for REDD+ Readiness.
United Kingdom
The UK has committed to provide approximately US$4.5 billion28 in FSF for climate change from 2010 to 2012, and as of November 2011, US$1.73 billion had already been spent (ODI, World Resources Institute, 2013). Finance has been channelled through the Environmental Transformation Fund (ETF) in 2010/11 and through the International Climate Fund (ICF) in 2011/12.
Back in 2010, the UK took the decision that over the 2010–2012 period it would allocate 20% of its FSF pledges for action on REDD+ i.e. approximately US$500 million (PwC, 2011a). Since 2010, UK’s ICF has allocated more than US$456 million to programmes addressing deforestation (DECC, 2013a). From this approximately US$269 million has been channelled, almost exclusively through the multilateral inancing channels – the FIP, Congo Basin Forest Fund, FCPF Readiness Fund and the FCPF Carbon Fund (DECC, 2013a).
Moreover, the UK has deployed forest inance through bilateral partnerships with forest countries and communities. Between 2001 and 2011, DFID allocated almost US$32.6 million to community forestry in Nepal, US$129 million has been channelled through its Forest Governance Markets and Climate Initiative, while US$25 million was recently pledged to a low carbon agriculture project in Colombia (DECC, 2013a).
The UK has also committed to spend US$4.7 billion by the end of March 2015 for international climate inance, 20% of which is earmarked for forest related activities (ClimateFinanceOptions, 2013). Although no concrete details have been published yet, discussions on a new set of measures to tackle deforestation are taking place, possibly including an Advanced Market Mechanism, as part of its US$980 million funding 2015 plan (DFID, 2012).
During the COP19 in Warsaw, the UK made a commitment to earmark US$120 million to the BioCarbon Fund
Initiative for Sustainable Forest Landscapes (ISFL), a new initiative addressing deforestation (see Annex 1).
A strategic intervention would build on this strong commitment to post-2012 funding, and is consistent with the current inancial commitments made by the UK. The UK also announced a willingness to fund additional programmes of the FCPF Carbon Fund, provided that suficient credible programmes are approved (BMU, 2013).
Last, but not least, in a joint letter with Norway and Germany, the UK expressed its support for a programme to achieve the goal of zero net deforestation in the Colombian Amazon by 2020 (BMU, 2013).
United States of America
In Copenhagen in December 2009, the United States pledged around US$1 billion for REDD+ from 2010 to 2012 (Wolosin.M, 2012; Voluntary REDD+ Database, 2013). In 2010, the USA met 25% of its overall pledge, allocating approximately US$250 million towards REDD+. This was mostly through US AID, and by providing grants to GEF, FCPF and the FIP. In 2011, REDD+ expenditure rose to US$277 million, while the respective estimate for 2012 is US$246 million (Wolosin. M, 2012). Overall, during 2010–2012, the USA allocated around US$ 887 million towards REDD+ (US DoS, 2012). An additional US$75 million might be directed to support forest and land use projects through the USA Millennium Challenge Corporation (MCC) compact with Indonesia, while during COP 19, the USA announced a pledge of US$25 million to the BioCarbon Fund ISFL (see Annex 1).
Amongst developing countries, Indonesia and Brazil have been identiied by the USA as priority countries for reducing emissions from deforestation. In 2010, 60% of the inancing was directed towards Indonesia, Brazil and Peru, with bilateral inancing composing 30%. Although no concrete estimates have yet been announced by the Obama administration for the post-2012 period, the strong bilateral cooperation so far
achieved between USA, Brazil and Indonesia can be built on through a strategic intervention in the REDD+ sector.
Deployment of capital: provision of
incentives, inance and assistance
The previous section identiied past – and potential future – sources of funding for REDD+ at the national level. This section explores a variety of instruments that could be used to spend that money. The instruments described in this section can be grouped into one of three areas: creating incentives, providing inance and risk management, and providing technical assistance and advisory services.
Creating incentives
A key function of the proposed strategic intervention is to improve the risk-return proile of REDD+ investments, up to a point where they can be competitive with other alternative land use investment options over longer time horizons. This can be achieved by improving the incentive to invest in REDD+ in a variety of ways, including through the use of Emissions Reduction Purchase Agreements29 (ERPAs), creating options contracts or setting price loors. By doing so, the strategic intervention would be directly purchasing, or incentivising the purchase of, veriied emission reductions. The contracts created could then be used by projects to raise inancial capital from the private sector.
Payments could be offered upon the delivery of veriied REDD+ emission reductions by forest countries. The facility used for the strategic intervention can act as the buying counterparty, on behalf of donor country governments, in bilateral Emission Reduction Purchase Agreements (ERPAs). An ERPA is a type of contract where the buyer agrees to pay for veriied emission reductions from the seller (a more general term often used is an “off-take agreement”). The price, volume or both, of emission reductions, is normally ixed at the date of contract signing.
29 In order to maximise the economic eficiency of funds provided
An ERPA can be signed with private sector REDD+ project developers, with public sector entities implementing REDD+ projects on behalf of, or with, governments. The advantage of signing an ERPA is that it provides a higher degree of certainty over the cash lows associated with the REDD+ projects. This is because price, volume or both, are agreed in advance of the emission reductions being generated or veriied. By signing an ERPA, demand for REDD+ emission reductions are directly increased. An ERPA also reduces the risk proile of the investment (as perceived by any inancier or investor looking to offer upfront debt or equity capital for the project), which increases access to capital. Furthermore, the ERPA can contribute to collateral for a loan, further increasing access to, and potentially lowering the cost of, capital.
Variations on a standard ERPA may also be able to scale up demand. If the capital is used to pay for only a portion of the total veriied emission reductions generated (e.g. 30%), other private sector counterparties may be encouraged to sign ERPAs for the remaining portion (e.g. 70%). This is because other investors may be satisied that the parties to the intervention have done their proper due diligence. This concept of ‘crowding in’ investment is similar to how investment by development inance institutions, such as the IFC, can be used as cornerstone investments in a project.
Alternatively, a portion of the payment for the veriied emission reductions could be made upfront, rather than all on delivery. This would improve the capital structure of the project (because the project has more initial capital with which to operate), increasing the attractiveness of the project to other debt and equity investors, and increasing access to capital.
To stimulate investment from the private sector and forest country governments, put options could be offered on emission reductions. A put option would give investors or forest countries the right but not the obligation to sell a speciied volume of veriied emission reductions at a certain price (known as the strike price) at a certain date in the future. There is generally a fee or premium associated with these instruments, but this could be waived.
Whether the option is exercised by the private sector investor or forest country government will depend on the price it is linked to, e.g. the spot price of carbon, and the level of that price when the options expires. This is because, if that price is below the pre-deined strike price, then the put option will be exercised30.
To illustrate how put options work, consider the following example. An implementing state in Peru wishes to sell the emission reductions that will be generated by its jurisdictional REDD+ programme. If political support for the programme is lacking, and buyers are uncertain, the state may struggle to get the jurisdictional REDD+ programme off the ground. To help get the political backing necessary to get the programme off the ground, the state could be sold a put option. For a premium, this put option would guarantee the state a buyer for its emission reductions, at a ixed minimum price, for a inite period of time.
Alternatively, the state may have a set of potential buyers for the emission reductions, but it might be concerned about the impact of a drop in the spot price of carbon on the value of its emission reductions (assuming that at least part of the price is ‘loating’ – e.g. part determined by the spot price). In this case, the put option could be used to hedge the risk that the price at which the state can sell its emission reductions will drop below an unattractive level.
Normally, the investor would be charged for signing the options contract. Instead, however, this could be waived. If the fee is waived, this can be thought of as a price loor. There are many examples of governments imposing price loors, although not usually by offering put options. A well-known example is the minimum wage, i.e. the minimum price that can be paid for labour. Price loors have also been used extensively within the Common Agricultural Policy (CAP) in the EU to protect farmers from drops in prices.
30 This is assuming it is a European style option. If it is an America