REEF CHECK DESCRIPTION
OF THE 2000 MASS CORAL BEACHING EVENT IN FIJI WITH REFERENCE TO THE SOUTH PACIFIC
Edward R. Lovell
Biological Consultants, Fiji
TABLE OF CONTENTS
1.0 Introduction ...4
2.0 Methods ...4
3.0 The Bleaching Event ...5
3.1 Background ...5
3.2 South Pacific Context...6
3.2.1 Degree Heating Weeks ...6
3.3 Assessment ...11
3.4 Aerial flight ...11
4.0 Survey Sites ...13
4.1 Northern Vanua Levu Survey...13
4.1.1 Site 1: Vorovoro I., Southern Side ...13
4.1.2 Site 2: Barrier Reef North of Labasa: Northeast corner of channel ...14
4.1.3 Site 3: Inner Cakaulevu barrier Reef areas North of Labasa...15
4.1.4 Site 4: Cakaulevu Reef near Kia I. ...16
4.2 Southern Vanua Levu ...17
4.2.1 Jean-Michel Cousteau Resort: Big Blue Dive Site: 3m reef slope: Site 1 July 5, 2000 ...19
4.2.2 Jean-Michel Cousteau Resort: Big Blue Dive Site: 6m reef slope: Site 3 ... 22
4.2.3 Jean-Michel Cousteau Resort: Big Blue Dive Site: Deep Site 30m: Transect 1: June 28, 2000... 23
4.2.4 Jean-Michel Cousteau Resort: Big Blue Dive Site: Deep Site 30m: Transect 2:...22
June 30, 2000...22
4.3 Rat Tail and Suva Passage Reefs ...23
4.3.1 Rat Tail Passage Reef flat May 23, 2000: Site 1...24
4.3.2 Rat Tail Reef Flat June 11, 2000: Site 2 ...29
4.3.3 Suva Pass July 8, 2000: Site 3...31
4.3.4 Rat Tail Reef Flat July 29, 2000: Site 4 ...33
5.0 Reef Check Transects Conducted at the Fiji Dive Operators (FDOA) Workshop ...34
5.1 Combined Transects to equal the 4 x 20m ...34
5.2 Interview of the Fiji Dive Operators Association members...37
6.0 Results ... 41
7.0 Discussion ...39
7.1 The Nature of the Bleaching Event ...39
7.2 Localised influences ...40
7.2.1 Temperature...40
7.2.2 Shading...41
7.2.3 Current flow ...41
7.2.4 Oxygen depletion ...42
7.2.5 Weather ...42
8.0 Bibliography...43
9.0 Appendix ...45
9.1 Fiji Dive Operator Network: Register of Dive Operators ...45
9.2 Bleaching Time Line for the Fiji 2000 Bleaching event ...48
9.3 Locations of Field Surveys...59
9.4 A Weather Bureau summary of weather patterns exemplifies this (Gosai pers. comm.): ...59
9.5 Reef Check results of the Fiji Dive Operators Workshop...63
FIGURES
Figure 1. Variation in the appearance of bleached coral ... 5 Figure 2. Bleaching in Tonga ...6 Figure 3. National Oceanic and Atmospheric Administration (NOAA) Degree Heating
Weeks (DHW’s) Chart of the South Pacific for the last 12 weeks prior to 4/25/2000. The coloured areas show varying degrees of elevated water temperature along the west Australian coast and a band extending across the South Pacific. (NOAA website URL: http://www.psbsgil. nesdis.noaa.gov: 8080/PSB/EPS/ SST/dhw_retro.html). ...9 Figure 4. Map showing the locations of the coral bleaching assessment in Fiji. ...10 Figure 5. Aerial photos of the contrasting areas of coral bleaching. Nukubuco Reef (above)
exhibits substantial bleaching as is evident on the margins of the spur and groove system. By contrast, the area, north of Vanua Levu had only minor bleaching (below) ...12 Figure 6. Aerial flight path conducted to determine the degree of bleaching from southern
Viti Levu to the north of Vanua Levu, Fiji...13 Figure 7. a) Aerial view of the sample area north of Labasa Aerial photographs.
b) Photo (right) is reef area north of Labasa showing the Qawa/Labasa River delta
and Vorovoro I. and Mali Passage ... 15 Figure 8. Photographs of the area north of Labasa showing little coral bleaching ... 19 Figure 9. Aerial photo of Point Reef extending from Vanua Levu and forming the southeast
margin of Savusavu Bay. The Big Blue Dive site is located on the southern side near
Lesiaceva Point ... 20 Figure 10. Views of coral bleaching at Rat Tail Passage May 23, 2000... 27 Figure 11. Aerial views of Suva and RatTail passages ... 28 Figure 12. Training session at the Fiji Dive Operators workshop (left). Reef Check diver
swims (right) over severly bleached coral area at the Big Blue Dive Site ... 37 Figure 13. Diver conducting a Reef Check survey of the coral bleaching (left). Divers returning
from survey (right)... 37 Figure 14. Variation exhibitied in the responses of coral to bleaching: A) is between colonies B)
1.0 Introduction
This paper is a description of the coral bleaching event in Fiji, which occurred in February/March 2000. It draws on a variety of sources of information which include the satellite information from the NOAA/ERDIS satellite, aerial surveillance during the event, in situ temperature information, reports from members of the Fiji Dive Operators Association (FDOA), researchers at the University of the South Pacific (USP) and World Wide Fund for Nature and Foundation for the People of the South Pacific, who have coral reef related projects.
The dive operator’s observations and modified Reef Check assessments are used to provide a broad understanding of the event in Fiji. To compliment this, a program of progressive Reef Checks was used to assess the bleaching phenomenon at various stages.
2.0 Methods
Surveys were conducted by using the Reef Check protocol modified in its benthic assessment as the line intercept transect (LIT) technique with the information taking account of the bleaching and subsequent mortality. Variations in the Reef Check method entailed the shortening of the length that was surveyed and using a more detailed assessment of the benthic transect. Different areas were surveyed in this manner to quantify the percentage cover of bleached coral cover and assess the maturity of the coral bleaching event.
The standard Reef Check method was used at RatTail Passage, the Fijian Hotel and Cousteau Resorts. This involved assessment of the 100m transect for fish, mobile invertebrates and benthic cover according to the Reef Check methods. As the objective of the assessment was to create an overview of the bleaching event, the extent of the survey was determined by both the presence of the bleaching and assessment of a wider range of habitats. The logistical support was, at times, limiting.
Following is the convention used to record the coral bleaching (adapted from Cumming et al. in review) used in the transect assessment.
1. Not bleached or normal coloration had only the species or generic designation.
2. Fully bleached referred to the whole colonies being white or pastel-colored and is designated Bl.
3. Dead referred to new algal turf on the skeleton to a state where the algae was dense and co-existed with other encrusting organisms. D was the designation that the coral had died from the bleaching event.
4. Partially bleached referred to the colony either exhibiting both bleaching (Bl), a normal state (N) or dead state (D).
5. A bleached colony re-establishing its zooxanthellae or recovering were designated RE .
3.0 The Bleaching Event
3.1 Background
Coral bleaching is a global phenomenon. It’s frequency, scale and severity seems to be increasing. There have been 60 bleaching events between 1979 and 1990 (Glynn 1993). Few were reported before that period. The worst bleaching event on record affected the Indian Ocean, south and Southeast Asia and Australia in 1998. The South Pacific has recently experienced a major bleaching event.
Coral bleaching is a descriptive term applied to the influence of higher sea temperatures on a variety of coral reef organisms, which include sea anemones, giant clams as well as corals. What they all have in common is the presence of symbiotic algae, the zooxanthellae. In the presence of prolonged, unusually high sea temperatures, physiological problems occur and they are expelled from the host organisms. The resulting appearance of coral or other organisms is a white appearance cue to the removal of the brown colored algae, which give coral its color and masking the natural color of the animal host and may appear commonly pink, blue or yellow.
Figure 1. Variation in the appearance of bleached coral.
(Figure not available in electronic format)
Coral bleaching in Fiji, until recently, has not been recorded though anecdotal village accounts report an event in the early 1950’s. This is supported by the long-term weather records of the Hadley Climate Prediction Center, MetOffice, United Kingdom, which shows an apparent peak of warm water at that time. An unsubstantiated account of the bleaching of Acropora was recorded in 1988 (Beckman (pers. comm.) in Williams and Bunkley-Williams, 1990). Coral bleaching of Pocillopora damicornis and Seriatopora hystrix was observed in Bau Waters in the April of 1998. Recently, coral bleaching was first observed in the late summer of 1998/1999 in both Suva Harbor, Bau Waters and to a lesser extent on Cakaulevu Reef north of Labasa. This was minimal by comparison to the year 2000 event but did include the bleaching of such prone genera as Seriatopora, Stylophora, Acropora and, unusually, Platygyra.
3.2 South Pacific Context
The major bleaching event in Fiji coincided with prolonged temperatures sometimes in excess of 300C. Similar bleaching extended across the South Pacific from Papua New Guinea (PNG) to Easter Island in the east. Satellite surveillance of sea surface temperatures (SST) revealed a band of progressively elevating temperatures initiating in PNG and extending down through the Solomon Islands. This area first experienced warming as early September. Waters around Fiji began to warm in the third week of Dec. 1999. NOAA’s SST maps showed waters around Fiji and Tonga, alternately, warming and cooling locally around these island groups into the first week of January 2000. Water temperature continued to increase around north PNG, Solomon Is, south of Fiji and around Tonga. Southeast of this area, patchy elevation of temperature occurred.
By February 1, the trend continued to now include Vanuatu and northeast New Caledonia. Waters of Tonga, Cook Is., Tubai (Austral) Is. and Easter I. began to warm . By the middle of the month, this band of warm water intensified to +1.0-1.250C above the maximum monthly mean (MMM), and extended across the South Pacific to Easter I. The MMM is a figure reflecting the average longterm temperature over which incident temperatures are considered elevated. Water temperatures continued to increase. By February 29, the warm water extended to Australia in the northwest and broadened as a continuous band to the southeast to include the Tubai Is. Temperature elevation progressed, characterized by discrete areas of hotter areas occurring within this broad band. By the middle of March, the trans-Pacific zone of higher temperature began to break up. Particularly hot areas to the southwest of New Ireland in PNG and the Solomon’s and a large warm water mass south of Fiji, over Tonga, Cook Is. and the Tubai I remained. A separate warm water mass covered Easter I. It is at this time, the first reports of coral bleaching were being made from across the South Pacific.
For southern Viti Levu I. in Fiji, this was determined to be during the week surrounding March 1. Slight bleaching was seen during a Reef Check survey on February 27 but by the first week of March widespread bleaching had occurred. It is thought that the same time-frame applied to the other affected areas of Fiji. Interestingly, the satellite record of SST’s north of Vanua Levu indicated much cooler waters. An aerial survey of this area revealed far less bleaching (<5%). By April 15, the warm water mass was dissipating. It had retracted to the Kimbe Bay area and Bouganville in PNG and the Solomon Is. SST’s in Vanuatu had returned to normal. The warm water around Fiji was slightly elevated and extended across Tonga to the Cook Is. SST’s had returned to normal in both the Tubai Is. and Easter I.
Figure 2. Bleaching in Tonga
(Figure not available in electronic format)
3.2.1 Degree Heating Weeks
Coral bleaching, though correlated with elevated water temperatures is influenced by light, and as a result occurs differentially in the reef environment with corals at depth and in inshore areas being less affected in terms of the amount of bleaching and mortality. Hard coral death was highest in areas characterized by the clearest water such as the forereef environments. This reef zone is typically dominated by table-like Acropora assemblage. Mortality of hard coral in these areas may reach 80%.
The unusual occurrence of warm water appears to be the result of a weather phenomenon and is subsequently influenced by oceanic and local currents (Wilkinson et al 1999; Skirving et al. 2001). In the case of the weather, it is characterized by calmness with the prevailing trade winds remaining light. When coinciding with the zenith of the sun on its seasonal transit, warming of the sea surface occurs. Surprisingly, this layer of warm water may extend to a depth of 30m. Bleaching occurs but is less frequent than that which is experienced in the shallow water. Bleaching seems to be moderated by the presence of high currents in location like reef passages. Inshore, more turbid, waters experience less bleaching. The key to this latter observation is the reduced penetration of light and its affect on the algal photosynthetic processes within the host animal. In the presence of high temperatures and light, toxic photosynthetic products such as oxygen radicals poison the animal. Many corals survive the harmful affect of light being moderated and protected by pigments within the animal. Some species of corals don’t bleach at all.
9
Figure 3. National Oceanic and Atmospheric Administration (NOAA) Degree Heating Weeks (DHW’s) Chart of the South Pacific for the last 12 weeks prior to 4/25/2000. The coloured areas show varying numbers of heating weeks accumulation along the west Australian coast and a band extending across the South Pacific. (NOAA website URL: http://www.psbsgil. nesdis.noaa.gov: 8080/PSB/EPS/ SST/dhw_retro.html).
10
Figure 4. Map showing the locations of the coral bleaching assessment in Fiji.
3.3 Assessment
The earliest assessment of the coral bleaching event was initially through a survey conducted by the Reef Check program at the Fijian Resort at Cuvu Reef February 25, 2000. Subsequently, an aerial survey was conducted of the bleaching, particularly with respect to the northern part of Fiji. It was of interest to see if this differential influence was manifest in the degree of coral bleaching.
Subsequently, field visits were conducted to determine the in situ effect of the bleaching. These occurred on the Great Sea Reef north of Labasa, Vanua Levu I. On the south side of the island, surveys were conducted by some members of the Fiji Dive Operators Association (see appendix 1) and at the Jean-Michel Cousteau resort. Similar surveys were conducted near Suva, particularly at Rat Tail passage. The Fiji Dive Operators were interviewed on the extent of the bleaching in their area. Summary accounts were made of other surveys conducted throughout Fiji at various stages during the event.
3.4 Aerial flight
An aerial flight was conducted at 11AM on April 21, 2000 to assess the extent of the bleaching from the Suva area to the Cakaulevu Reef, the extensive barrier reef to the north of the main Fiji islands. The NOAA hotspot charts indicated that the area of the highest temperature elevation was the southeast corner of Viti Levu extending both to the southeast and north to southern Vanua Levu. On the northern side of Vanua Levu the temperatures were very reduced, approaching normal. The objective of the flight was to assess whether the bleaching was less. This proved to be the case with severe bleaching indicated in the Suva area and Bau Waters but very reduced on the northern barrier reef.
With clear weather conditions and a low tide, the extent of the bleaching was easily observable. It was pronounced on the fore-reef areas of the barrier reefs which extending from Rat Tail Passage to Naisali Pt, on the southeast corner. Similar observations were made in flying over Bau Waters and heading along the barrier reefs adjacent Ovalau I. It was very clear upon crossing Vanua Levu, that bleaching was far less with little bleaching being discerned on the Cakaulevu barrier reef.
Figure 5. Aerial photos of the contrasting areas of coral bleaching. Nukubuco Reef (above) exhibits substantial bleaching as is evident on the margins of the spur and groove system. By contrast, the area, north of Vanua Levu had only minor bleaching (below).
Figure 6. Aerial flight path conducted to determine the degree of bleaching from southern Viti Levu to the north of Vanua Levu, Fiji
4.0 Survey Sites
The suvey of the coral bleaching event in Fiji was based on a sample of three localities which were representative of three regions of increasing latitude. The northern site is where the coral bleaching was minimal. The mid-region was southern Vanua Levu. The third area was southern Viti Levu. These latter areas shared habitats that represented examples of severe, moderate and minimal influence. With in the later two localities contrasting habitats of reef front, inshore reef and reef at depth.
4.1 Northern Vanua Levu Survey
In order to confirm the observations of the aerial survey, site surveys were carried out in the reef areas north of Labasa. These areas were relatively isolated from the waters to the south of the Vanua Levu. The degree and duration of the elevated temperatures in this area was substantially less than the areas south of the main islands. Only a minor amount of bleaching was observed. The surveys involved five habitats. Following are the survey results.
4.1.1 Site 1: Vorovoro I., Southern Side
The first site is the inshore area located on the southern side of Vorovoro Island opposite the Qawa River. It is characterised by soft sediments and general inshore conditions. No bleaching was observed in this area of low diversity and coral cover. The Reef Check survey of fish and mobile invertebrates reflected the low diversity and was characterised by didemnid sea urchins whose herbivorus, detrital feeding diet makes them common in areas of reef rock which is covered by a thin algal layer.
Vorovoro I. Southern Side
Taxa N Total Mean Std. Max. Min. Percent
Intercept (cm)
Dev. Cover
Coral Porites sp. Massive 2 2300 460 356 1000 0.0 21.90%
Psammocora sp. 1 800 800 0 800 800 7.62%
Substrate Rock 1 4800 2400 400 2800 2000 45.71%
Sand 1 2600 870 602 1700 300 24.76%
Total 97.8m Total 100%
4.1.2 Site 2: Barrier Reef North of Labasa: Northeast corner of channel
This site is located on the northeast seaward edge of the main channel, which enters through the Cakaulevu Barrier reef. This area was characterised by moderate wave action. It was Acropora dominated, particularly tabulate or plate-like species, and should have been affected by the coral bleaching if it had occurred. The dominant species in the area was Acropora hyacinthus and A. humulis. Living coral cover was moderate at 59.25%. There was no sign of bleaching in this area. .Due to the wave action there were few invertebrates seen. The most abundant recorded fish were Chaetodons and snappers (Lujanus kasmira). Several parrotfish and surgeonfish were seen.
Barrier Reef North of Labasa: Northeast corner of channel
Taxa N Total
Intercept
Mean Std. Max. Min. Percent Cover
Coral Acropora aculeus 1 10 10 0 10 10 0.50%
Acropora sp. 2 70 35.0 5.0 40.0 30.0 3.50%
Acropora humilis 7 155.0 22.1 13.1 50.0 10.0 7.75%
Acropora hyacinthus 12 695.0 57.9 25.6 100.0 20.0 34.75%
Acropora monticulosa 1 20.0 20.0 0.0 20.0 20.0 1.00%
Acropora nasuta 1 10.0 10.0 0.0 10.0 10.0 0.50%
Acropora sarmentosa 2 60.0 30.0 20.0 50.0 10.0 3.00%
Acropora secale 1 30.0 30.0 0.0 30.0 30.0 1.50%
Hydnophora exesa 1 45.0 45.0 0.0 45.0 45.0 2.25%
Pocillopora eydouxi 3 70.0 23.3 12.5 40.0 10.0 3.50%
Pocillopora verrucosa 1 20.0 20.0 0.0 20.0 20.0 1.00%
Total 59.25%
Algae Coralline algae 6 465.0 77.5 44.1 170.0 30.0 23.25%
Substrate Rubble 1 20.0 20.0 0.0 20.0 20.0 1.00%
Old dead coral 1 50.0 50.0 0.0 50.0 50.0 2.50%
Sand 3 280.0 280 0.0 280 280 14.00%
Total 20m Total 17.50%
4.1.3 Site 3: Inner Cakaulevu barrier Reef areas North of Labasa
This table is the combination of three transects on different sites inside of the barrier reef. These areas are Gunasara Reef (3a) and two sites on the back reef are of the Cakaulevu Reef (3b,c).
Inner Cakaulevu barrier Reef areas North of Labasa
Taxa N Total Mean Std. Max. Min. Percent
Intercept Dev. Cover
Coral Acropora humilis 2 40.0 20.0 10.0 30.0 10.0 0.80%
Acropora hyacinthus 3 70.0 23.3 12.5 40.0 10.0 1.40% Acropora intermedia 2 55.0 27.5 12.5 40.0 15.0 1.10%
Acropora millepora 2 60.0 30.0 10.0 40.0 20.0 1.20%
Acropora muricata 1 40.0 40.0 0.0 40.0 40.0 0.80%
Acropora nasuta 3 70.0 23.3 12.5 40.0 10.0 1.40%
Acropora sp. 4 160.0 40.0 10.0 50.0 30.0 3.20%
Diploastrea heliopora 1 130.0 130.0 0.0 130.0 130.0 2.60%
Favites pentagona 1 20.0 20.0 0.0 20.0 20.0 0.40%
Fungia sp. 1 10.0 10.0 0.0 10.0 10.0 0.20%
Goniastrea sp. 2 20.0 10.0 0.0 10.0 10.0 0.40%
Goniastrea reniformis 1 20.0 20.0 0.0 20.0 20.0 0.40%
Porites cyclindrica 1 90.0 90.0 0.0 90.0 90.0 1.80%
Porites sp. (massive) 7 160.0 22.9 10.3 40.0 10.0 3.20%
Porites rus 3 265.0 88.3 42.9 140.0 35.0 5.30%
Pocillopora verrucosa 1 25.0 25.0 0.0 25.0 25.0 0.50%
Seriatapora hystrix 2 50.0 25.0 5.0 30.0 20.0 1.00%
Algae Coralline algae 8 685.0 85.6 68.4 215.0 20.0 16.70%
Other soft coral 10 680.0 68.0 50.8 190.0 10.0 13.60%
Sinularia sp. 1 10.0 10.0 0.0 10.0 10.0 0.20%
Tunicates 1 20.0 20.0 0.0 20.0 20.0 0.40%
Substrate new dead coral 1 20.0 20.0 0.0 20.0 20.0 0.40%
old dead coral 3 265.0 88.3 37.0 140.0 55.0 5.30%
Rock 17 1155.0 67.9 52.5 220.0 10.0 23.10%
Sand 6 880.0 146.7 59.1 240.0 70.0 17.60%
Total 50m Total 100%
4.1.4 Site 4: Cakaulevu Reef near Kia I.
This area is located to the west of Kia I. on the Cakaulevu Barrier Reef. It is a submerged reef on the outer barrier reef. Its location to the west of Kia I. provides protection from the prevailing northeast swells though is exposed to oceanic swells from the northeast. Bleaching was not recorded on the transects but some colonies of A. robusta were seen (5 per 20min swim) that appeared as though they were bleached by the light nature of their tips but are now nearly re-established with zooxanthellae. A. hyacinthus appeared formerly bleached but now re-re-established. A colony of newly dead A. robusta was seen. A large colony of Platygyra daedalea (50cm. Dia.) was obviously bleached but has been largely recolonized by the zooxanthellae. Dead spots were present.
Cakaulevu Reef near Kia I.
Taxa N Total Mean Std. Max. Min. Percent
Intercept Dev. Cover
Coral Acropora humilis 7 190.0 27.1 36.2 115.0 5.0 9.50%
Acropora hyacinthus 8 275.0 34.4 21.7 75.0 10.0 13.75% Acropora monticulosa 3 50.0 16.7 9.4 30.0 10.0 2.50%
Acropora robust 7 205.0 29.3 12.7 50.0 10.0 10.25%
Acropora valida 1 20.0 20.0 0.0 20.0 20.0 1.00%
Goniastrea sp. 1 10.0 10.0 0.0 10.0 10.0 0.50%
Montastrea curta 1 10.0 10.0 0.0 10.0 10.0 0.50%
Pocillopora eydouxi 3 65.0 21.7 6.2 30.0 15.0 3.25%
Porites sp. (massive) 1 10.0 10.0 0.0 10.0 10.0 0.50% Pocillopora verrucosa 1 10.0 10.0 0.0 10.0 10.0 0.50%
Turbinaria sp. 1 10.0 10.0 0.0 10.0 10.0 0.50%
42.75% Algae Coralline algae 12 600.0 50.0 27.6 120.0 20.0 30.00%
Substrate Rock 11 655.0 49.5 37.8 140.0 10.0 27.25%
Total 20m 100.00%
This is an area of high luxuriance with a living coral cover of 42.75%. The species diversity of coral is high. Despite the fishing pressure from the local village, the fishes are abundant with Chaetodons and snapper (Lutjanus kasmira) recorded.
(Figure not available in electronic format)
Figure 8. Photographs of the area north of Labasa showing little coral bleaching.
4.2 Southern Vanua Levu
The reef areas surveyed were adjacent to the Jean Michel Cousteau Resort, on both the windward and proctected side of Point Reef. This area is 10 km east of Savusavu. The area was intially surveyed by the participants of the Fiji Dive Operators Association Reef Check training program (April 19, 2000). This was at a site known as Big Blue. This site and several others were subsequently sampled through a survey conducted by the Jean Michel Cousteau Resort (June 29-31, 2000).
This area south of Vanua Levu has been greatly affected by the bleaching and subsequent death. Where as few corals showed signs of bleaching to the north of the island, the southern area was dramatically affected. This was particularly manifest on the windward reefs in the shallower waters.
Figure 9. Aerial photo of Point Reef extending from Vanua Levu and forming the southeast margin of Savusavu Bay. The Big Blue Dive site is located on the southern side near Lesiaceva Point.
19
4.2.1 Site 1 Jean-Michel Cousteau Resort: Big Blue Dive Site: 3m reef slope: Site 1 July 5, 2000
Taxa N Total
Intercept
Mean Std. Max. Min. Percent Cover
% of coral bleached
% Dead % Normal
Coral Acropora humilis D 1 60.0 60.0 0.0 60.0 60.0 5.17% 9.30%
Acropora hyacinthus D 1 20.0 20.0 0.0 20.0 20.0 1.72% 3.10%
Acropora nasuta 1 20.0 20.0 0.0 20.0 20.0 1.72% 3.10%
Acropora robust D 1 40.0 40.0 0.0 40.0 40.0 3.45% 6.20%
Acropora sp. D 4 140.0 35.0 5.0 40.0 30.0 12.07% 21.71%
Galaxea fasicularis 2 30.0 15.0 5.0 20.0 10.0 2.59% 4.65%
Goniastrea reniformis B/R 1 10.0 10.0 0.0 10.0 10.0 0.86% 1.55%
Lobophyllia corymbosa 2 40.0 20.0 10.0 30.0 10.0 3.45% 6.20%
Platygyra sp. R 1 20.0 20.0 0.0 20.0 20.0 1.72% 3.10%
Pocillopora damicornis D 1 30.0 30.0 0.0 30.0 30.0 2.59% 4.65%
Pocillopora damicornis 1 25.0 25.0 0.0 25.0 25.0 2.16% 3.88%
Pocillopora eydouxi D 2 80.0 40.0 0.0 40.0 40.0 6.90% 12.40%
Pocillopora eydouxi 2 80.0 40.0 20.0 60.0 20.0 6.90% 12.40%
Pocillopora verrucosa D 1 50.0 50.0 0.0 50.0 50.0 4.31% 7.75%
645 55.60% 4.65% 65.12% 30.23%
Other Soft coral 1 10.0 10.0 0.0 10.0 10.0 0.86%
Algae Coralline algae 2 75.0 37.5 17.5 55.0 20.0 6.47%
Substrate Rock 1 30.0 30.0 0.0 30.0 30.0 2.59%
Rubble 3 180.0 60.0 37.4 100.0 10.0 15.52%
Old dead coral 3 220.0 73.3 33.0 120.0 50.0 18.97%
Total 37.07%
20
This area is one of a steep reef front in which the coral cover is high at 56%. Of the living cover the newly dead coral as the result of the bleaching was 65% and the unaffected or re-established coral 30%. The only remaining bleached coral was 5% of living coverage.
4.2.2 Jean-Michel Cousteau Resort: Big Blue Dive Site: 6m reef slope: Site 3
Taxa N Total
Intercept
Mean Std. Max. Min. Percent
Cover
%of newly
%Normal dead
Coral Acropora clathrata D 1 240.0 240.0 0.0 240.0 240.0 10.34% 14.63%
Acropora hyacinthus D 3 280.0 93.3 57.9 170.0 30.0 12.07% 17.07%
Acropora intermedia D 2 370.0 185.0 45.0 230.0 140.0 15.95% 22.56%
Acropora muricata D 3 290.0 96.7 66.5 190.0 40.0 12.50% 17.68%
Acropora muricata 1 90.0 90.0 0.0 90.0 90.0 3.88% 5.49%
Acropora nasuta D 1 60.0 60.0 0.0 60.0 60.0 2.59% 3.66%
Echinopora lamellosa 2 90.0 45.0 35.0 80.0 10.0 3.88% 5.49%
Galaxea fascicularis 1 10.0 10.0 0.0 10.0 10.0 0.43% 0.61%
Pocillopora damicornis D 1 110 110 0 110 110 4.79% 6.71%
Pocillopora damicornis 1 20.0 20.0 0.0 20.0 20.0 0.86% 1.22%
Pocillopora eydouxi 3 80.0 26.7 12.5 40.0 10.0 3.45% 4.88%
21
Other Soft coral 1 10.0 10.0 0.0 10.0 10.0 0.43%
Algae Halimeda 1 70.0 70.0 0.0 70.0 70.0 3.02%
Substrate Old dead coral 1 100.0 100.0 0.0 100.0 100.0 4.31%
Rock 1 40.0 40.0 0.0 40.0 40.0 1.72%
Rubble 5 460.0 92.0 64.0 210.0 40.0 19.83%
Total 23.20m Total 100%
Fish Butterfly Fish
Sweetlip
(Haeulidae)
Snapper (Lujanidae)
Grouper >30cm
Humphead Wrasse (Cheilinus undulatus)
Bumphead parrotfish (Bulbo
metopon sp.)
Lobster
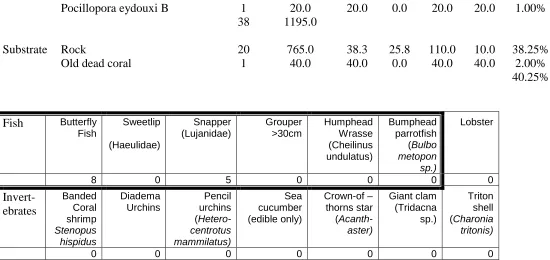
4 1 4 1 0 0 0
Invert-ebrates
Banded Coral shrimp
Stenopus hispidus
Diadema Urchins
Pencil urchins
(Hetero-centrotus mammilatus)
Sea cucumber (edible only)
Crown-of –thorns star
(Acanth-aster)
Giant clam (Tridacna sp.)
Triton shell (Charonia tritonis)
0 0 0 0 0 0 0
4.2.3 Jean-Michel Cousteau Resort: Big Blue Dive Site: Deep Site 30m: Transect 1: June 28, 2000
Taxa N Total Mean Std. Max. Min. Percent % %Newly
Intercept Dev. Cover bleached dead
Hard Coral Echinophyllia aspera 4 110 60 5 60.0 50.0 9.17%
22
Echinopora lamellosa D 1 35 35 0 35.0 35.0 2.92% 2.80%
Fungia N/B 1 10 10 0 10.0 10.0 0.83% 0.80%
Fungia sp. 1 140 10 16.7 10.0 10.0 11.67%
HC* 5 110 20 19.4 20.0 20.0 9.17%
HC B 1 20 20 0 20.0 20.0 1.67% 1.60%
Herpetolitha limax 1 30 10 5 10.0 10.0 2.50%
Zoopilus echinatus 2 45 25 2.5 25.0 25.0 3.75%
Montipora D 1 90 90 0 90.0 90.0 7.50% 7.20%
20 7.15m Total 59.58% 2.40% 10%
Other Soft coral 2 145 15 6.1 475.0 79.2 12.08%
Sponge 1 25 25 0 25.0 25.0 2.08%
14.17%
Algae Coralline algae 70 50 15 50.0 50.0 5.83%
Macro algae and rubble 165 330 0 165.0 165.0 13.75%
19.58%
Substrate Old dead coral 35 35 0 35.0 35.0 2.92%
Rubble 55 20 7.5 185.0 185.0 4.58%
Total 1210 7.50%
Total 100% *HC refers to hard coral. This data was collected by Holly Lohuis, Jean-Michel Cousteu Resort
4.2.4 Jean-Michel Cousteau Resort: Big Blue Dive Site: Deep Site 30m: Transect 2: June 30, 2000
Taxa N Total
Intercept
Mean Std. Max. Min. Percent Cover
% bleached
23
Echinopora lammelosa 3 285.0 47.5 14.6 65.0 20.0 20.75%
Fungia partial bleached 1 10.0 10.0 0.0 10.0 10.0 0.83% 0.72%
Fungia sp. 6 140.0 23.3 16.7 60.0 10.0 11.67%
HC 5 110.0 22.0 19.4 60.0 10.0 9.17%
HC B 1 20.0 20.0 0.0 20.0 20.0 1.67% 1.44%
Herpetolitha limax 2 30.0 15.0 5.0 20.0 10.0 2.50%
Montipora D 1 90.0 90.0 0.0 90.0 90.0 7.50%
Zoopilus echinatus 2 45.0 22.5 2.5 25.0 20 3.75%
24 7.95m 62.51% 2.16%
Other Soft coral 6 145.0 24.2 6.1 30.0 15.0 12.08%
Sponge 1 25.0 25.0 0.0 25.0 25.0 2.08%
14.17%
Algae Coralline algae 2 70.0 35.0 15.0 50.0 20.0 3.75%
Macro algae and rubble 1 330.0 330.0 0.0 330.0 330.0 24.16%
27.91%
Substrate Old dead coral 1 35.0 35.0 0.0 35.0 35.0 2.92%
Rubble 2 55.0 27.5 7.5 35.0 20.0 4.58%
Total 13.90m 7.50%
Total 100.00% Only two colonies were bleached and the rest was normal with one newly dead.
4.3 Rat Tail and Suva Passage Reefs
Rat Tail Passage is located near Suva on the southern side of Viti Levu. It is a narrow passage through the barrier reef, which is 1km offshore. The sample area is located on the west side of the passage. It includes the intertidal reef flat and passage reef slope. The inshore area is a fringing reef located seaward of Muaivuso Village.
24
4.3.1 Rat Tail Passage Reef flat May 23, 2000: Site 1
Of the Coral Cover
Taxa N Total
Intercept
Mean Std. Max. Min. Percent Cover
% Bleach
%50 Bleach
% dead
% Normal
Coral A humilis B 1 10.0 10.0 0.0 10.0 10.0 0.50% 0.84%
A humilis D 1 20.0 20.0 0.0 20.0 20.0 1.00% 1.67%
Acropora anthocercis D/B 50/50 1 30.0 30.0 0.0 30.0 30.0 1.50% 2.51%
Acropora cytherea 2 85.0 42.5 27.5 70.0 15.0 4.25% 7.11%
Acropora diversa 1 15.0 15.0 0.0 15.0 15.0 0.75% 1.26%
Acropora diversa B 2 45.0 22.5 2.5 25.0 20.0 2.25% 3.77%
Acropora diversa D 1 60.0 60.0 0.0 60.0 60.0 3.00% 5.02%
Acropora diversa %50B/D 1 30.0 30.0 0.0 30.0 30.0 1.50% 2.51%
Acropora humilis 1 10.0 10.0 0.0 10.0 10.0 0.50% 0.84%
Acropora humilis B 4 100.0 25.0 8.7 40.0 20.0 5.00% 8.37%
Acropora humilis D 3 90.0 30.0 14.1 50.0 20.0 4.50% 7.53%
Acropora hyacinthus 2 40.0 20.0 0.0 20.0 20.0 2.00% 3.35%
Acropora hyacinthus D 6 180.0 30.0 14.1 60.0 20.0 9.00% 15.06%
Acropora muricata D 2 50.0 25.0 5.0 30.0 20.0 2.50% 4.18%
Acropora nana B 1 10.0 10.0 0.0 10.0 10.0 0.50% 0.84%
Acropora nasuta 50%D/B 1 30.0 30.0 0.0 30.0 30.0 1.50% 2.51%
Acropora nasuta B 2 40.0 20.0 0.0 20.0 20.0 2.00% 3.35%
Acropora nasuta D 1 30.0 30.0 0.0 30.0 30.0 1.50% 2.51%
Acropora specifera B 1 10.0 10.0 0.0 10.0 10.0 0.50% 0.84%
Acropora sp. B 3 50.0 16.7 4.7 20.0 10.0 2.50% 4.18%
Acropora sp. D 4 120.0 30.0 12.2 50.0 20.0 6.00% 10.04%
Acropora subulata 1 10.0 10.0 0.0 10.0 10.0 0.50% 0.84%
Gardineroseris planulata %50B/D
1 10.0 10.0 0.0 10.0 10.0 0.50% 0.84%
Montipora sp. B 2 90.0 45.0 5.0 50.0 40.0 4.50% 7.53%
25
Pocillopora eydouxi B 1 20.0 20.0 0.0 20.0 20.0 1.00% 1.67%
38 1195.0 32.22% 9.21% 46.03% 12.55%
Substrate Rock 20 765.0 38.3 25.8 110.0 10.0 38.25%
Old dead coral 1 40.0 40.0 0.0 40.0 40.0 2.00%
40.25%
Fish Butterfly Fish
Sweetlip
(Haeulidae)
Snapper (Lujanidae)
Grouper >30cm
Humphead Wrasse (Cheilinus undulatus)
Bumphead parrotfish (Bulbo
metopon sp.)
Lobster
8 0 5 0 0 0 0
Invert-ebrates
Banded Coral shrimp
Stenopus hispidus
Diadema Urchins
Pencil urchins
(Hetero-centrotus mammilatus)
Sea cucumber (edible only)
Crown-of – thorns star
(Acanth-aster)
Giant clam (Tridacna sp.)
Triton shell (Charonia
tritonis)
0 0 0 0 0 0 0
Figure 11 Aerial views of Suva and RatTail passages.
29
4.2.2 Rat Tail Reef Flat June 11, 2000: Site 2
Taxa N Total
Intercept
Mean Std. Max. Min. Percent
Cover
% bleach
% Part Bleach
% Newly
Dead
% Normal
Coral Acropora clathrata D 1 20.0 20.0 0.0 20.0 20.0 1.00% 1.23%
Acropora cytherea D 2 50.0 25.0 5.0 30.0 20.0 2.50% 3.09%
Acropora cytherea %50N/D
1 20.0 20.0 0.0 20.0 20.0 1.00% 1.23%
Acropora divaricata N 2 30.0 15.0 5.0 20.0 10.0 1.50% 1.85%
Acropora humilis 1 10.0 10.0 0.0 10.0 10.0 0.50% 0.62%
Acropora humilis D 1 30.0 30.0 0.0 30.0 30.0 1.50% 1.85%
Acropora hyacinthus N 8 210.0 26.3 12.4 45.0 10.0 10.50% 12.96%
Acropora hyacinthus D 7 170.0 24.3 5.6 30.0 15.0 8.50% 10.49%
Acropora intermedia 1 20.0 20.0 0.0 20.0 20.0 1.00% 1.23%
Acropora monticulosa N 1 20.0 20.0 0.0 20.0 20.0 1.00% 1.23%
Acropora nasuta D 9 300.0 33.3 18.7 60.0 10.0 15.00% 18.52%
Acropora robust N/D 1 60.0 60.0 0.0 60.0 60.0 3.00% 3.70%
Acropora robust N 5 125.0 25.0 11.8 45.0 10.0 6.25% 7.72%
Acropora robust D 1 30.0 30.0 0.0 30.0 30.0 1.50% 1.85%
Acropora secale N 2 15.0 7.5 2.5 10.0 5.0 0.75% 0.93%
Acropora selago D 1 10.0 10.0 0.0 10.0 10.0 0.50% 0.62%
Acropora spicifera D 1 40.0 40.0 0.0 40.0 40.0 2.00% 2.47%
Acropora sp. N 4 70.0 17.5 13.0 40.0 10.0 3.50% 4.32%
Acropora sp. N/D 1 10.0 10.0 0.0 10.0 10.0 0.50% 0.62%
Acropora valida N 3 25.0 8.3 2.4 10.0 5.0 1.25% 1.54%
Favites russeli 1 30.0 30.0 0.0 30.0 30.0 1.50% 1.85%
Goniastrea reniformis 1 30.0 30.0 0.0 30.0 30.0 1.50% 1.85%
Goniastrea sp. B 1 10.0 10.0 0.0 10.0 10.0 0.50% 0.62%
Hard coral %50D/N 1 50.0 50.0 0.0 50.0 50.0 2.50% 3.09%
Montastrea curta %50B/N 3 100.0 33.3 18.9 60.0 20.0 5.00% 6.17%
30
Pavona varians 1 5.0 5.0 0.0 5.0 5.0 0.25% 0.31%
Platygyra 3/4 B 1 10.0 10.0 0.0 10.0 10.0 0.50% 0.62%
Platygyra sp. 1 5.0 5.0 0.0 5.0 5.0 0.25% 0.31%
Pocillopora eydouxi N 1 45.0 45.0 0.0 45.0 45.0 2.25% 2.78%
Pocillopora verrucosa D 2 50.0 25.0 5.0 30.0 20.0 2.50% 3.09%
Porites lutea 1 5.0 5.0 0.0 5.0 5.0 0.25% 0.31%
68 16.2m Totals 0.0 5.56% 53.70% 40.74%
Algae Coralline algae 1 10.0 10.0 0.0 10.0 10.0 0.50%
Other Remains of soft coral 1 50.0 50.0 0.0 50.0 50.0 2.50% 3.09%
Zoanthid N 1 40.0 40.0 0.0 40.0 40.0 2.00% 2.47%
Totals 3.09% 2.47%
Substrate Rock 10 310.0 31.0 11.6 50.0 10.0 15.50%
Total 20m Total 100%
Fish Butterfly Fish
Sweetlip
(Haeulidae)
Snapper (Lujanidae)
Grouper >30cm
Humphead Wrasse (Cheilinus undulatus)
Bumphead parrotfish (Bulbo
metopon sp.)
Lobster
8 0 4 0 0 0 0
Invert-ebrates
Banded Coral shrimp
Stenopus hispidus
Diadema Urchins
Pencil urchins
(Hetero-centrotus mammilatus)
Sea cucumber (edible only)
Crown-of – thorns star
(Acanth-aster)
Giant clam (Tridacna sp.)
Triton shell (Charoni
a tritonis)
31
4.2.3 Suva Pass July 8, 2000: Site 3
Taxa N Total
Intercept
Mean Std. Max. Min. Percent Cover
% Bleach
%part bleached
/normal
% Dead %Normal
Hard Coral
Acropora corymbose 1 10.0 10.0 0.0 10.0 10.0 0.20% 0.51%
Acropora corymbose D 2 90.0 45.0 25.0 70.0 20.0 1.80% 4.63%
Acropora monticulosa 3 70.0 23.3 9.4 30.0 10.0 1.40% 3.60%
Acropora nana 1 30.0 30.0 0.0 30.0 30.0 0.60% 1.54%
Acropora nana D 2 30.0 15.0 5.0 30.0 10.0 0.60% 1.54%
Acropora sp. 10 205.0 20.5 52.6 50.0 10.0 4.10% 10.54%
Acropora sp. D 5 290.0 19.3 19.3 50.0 10.0 4.80% 14.91%
Astreopora sp. 1 10.0 5.5 4.2 10.0 1.0 0.20% 0.51%
Echinopora lamellosa 2 65.0 32.5 22.9 40.0 25.0 1.30% 3.34%
Favid 1 40.0 40.0 18.4 40.0 40.0 0.80% 2.06%
Galaxea astreata 1 10.0 10.0 4.2 10.0 10.0 0.20% 0.51%
Goniastrea reniformis 1 10.0 10.0 4.2 10.0 10.0 0.20% 0.51%
Hydnophora exesa 3 40.0 13.3 12.9 20.0 10.0 0.80% 2.06%
Merulina ampliata 1 10.0 13.3 4.2 10.0 10.0 0.20% 0.51%
Montastrea sp. 2 60.0 30.0 10.0 60.0 20.0 1.20% 3.08%
Montipora N/B 40/60 1 70.0 70.0 0.0 70.0 70.0 1.40% 3.60% 3.60%
Montipora sp. 3 160.0 53.3 53.1 80.0 10.0 3.20% 8.23%
Pavona minuta 1 30.0 30.0 13.7 30.0 30.0 0.60% 1.54%
Pavona varians 1 40.0 40.0 18.4 40.0 40.0 0.80% 2.06%
Platygyra sinensis 3 50.0 25.0 19.7 40.0 40.0 1.00% 2.57%
Pocillopora damicornis 4 125.0 31.3 39.4 125.0 20.0 2.50% 6.43%
Pocillopora damicornis 1 10.0 10.0 0.0 10.0 10.0 0.18% 0.51%
Pocillopora eydouxi 2 130.0 65.0 55.0 120.0 10.0 2.60% 6.68%
Pocillopora eydouxi D 1 30.0 30.0 0.0 30.0 30.0 0.60% 1.54%
Pocillopora verrucosa D 3 110.0 36.7 35.4 40.0 30.0 2.20% 5.66%
32
Porites massive 6 120.0 20.0 20.0 30.0 10.0 2.40% 6.17%
Porites massive D 1 20.0 20.0 0.0 20.0 20.0 0.40% 1.03%
67 1945.0 34.00% 0.00% 3.60% 28.79% 70.18%
Other
Soft coral D 2 50.0 25.0 17.3 30.0 20.0 1.00%
Algae
Coralline algae 3 520.0 173.3 206.6 390.0 60.0 10.40%
Substrate
Rock 30 2730.0 91.0 462.7 220.0 20.0 54.60%
Total 52 m Total 100%
Fish Butterfly Fish
Sweetlip
(Haeulidae)
Snapper (Lujanidae)
Grouper >30cm
Humphead Wrasse (Cheilinus undulatus)
Bumphea d parrotfish (Bulbo
metopon sp.)
Lobster
2 1 5 1 0 0 0
Invert-ebrates
Banded Coral shrimp
Stenopus hispidus
Diadema Urchins
Pencil urchins
(Hetero-centrotus mammilatus)
Sea cucumber (edible only)
Crown-of – thorns star
(Acanth-aster)
Giant clam (Tridacna sp.)
Triton shell (Charonia
tritonis)
33
4.2.4 Rat Tail Reef Flat July 29, 2000: Site 4
Taxa N Total
Intercept
Mean Std. Max. Min. Percent
Cover
% Bleach
%part bleach /normal
%part bleach /dead
% Dead
%Normal
Coral Acropora clathrata 2 75.0 37.5 12.5 50.0 25.0 3.61% 4.95%
Acropora cuneata 1 10.0 10.0 0.0 10.0 10.0 0.48% 0.66%
Acropora cytherea 1 10.0 10.0 0.0 10.0 10.0 0.48% 0.66%
Acropora digitifera 1 20.0 20.0 0.0 20.0 20.0 0.96% 1.32%
Acropora humilis 3 60.0 20.0 8.2 30.0 10.0 2.89% 3.96%
Acropora hyacinthus 1 50.0 50.0 0.0 50.0 50.0 2.41% 3.30%
Acropora hyacinthus D 5 180.0 36.0 10.2 50.0 20.0 8.67% 11.88%
Acropora intermedia 5 130.0 26.0 15.9 50.0 10.0 6.27% 8.58%
Acropora muricata 1 20.0 20.0 0.0 20.0 20.0 0.96% 1.32%
Acropora nasuta 1 40.0 40.0 0.0 40.0 40.0 1.93% 2.64%
Acropora nasuta D 3 100.0 33.3 12.5 50.0 20.0 4.82% 6.60%
Acropora robusta 6 175.0 29.2 11.0 50.0 20.0 8.43% 11.55%
Acropora secale D 3 75.0 25.0 8.2 35.0 15.0 3.61% 4.95%
Acropora sp. 2 30.0 15.0 5.0 20.0 10.0 1.45% 1.98%
Acropora sp. D 4 140.0 35.0 20.6 70.0 20.0 6.75% 9.24%
Acropora sp. N/D 50/50 1 10.0 10.0 0.0 10.0 10.0 0.48% 0.66%
Acropora subulata 1 60.0 60.0 0.0 60.0 60.0 2.89% 3.96%
Acropora valida 4 90.0 22.5 8.3 30.0 10.0 4.34% 5.94%
Acropora valida N/D 50/50
1 40.0 40.0 0.0 40.0 40.0 1.93% 2.64%
Montipora sp. 3 50.0 16.7 4.7 20.0 10.0 2.41% 3.30%
Pocillopora damicornis N/B 90/10
1 35 35 0 35 35 1.69% 2.31%
Pocillopora verrucosa 1 20 20 0 20 20 0.96% 1.32%
Pocillopora verrucosa D 1 30 30 0 30 30 1.45% 1.98%
Porites sp. 5 65.0 13.0 6.0 20.0 5.0 3.13% 4.29%
62 15.0 m 73.01% 0.00% 2.31% 3.30% 34.65% 59.74%
34
Substrate Rock 2 70.0 35.0 5.0 40.0 30.0 3.37%
Total 22 m Total 100%
5.0 Reef Check Transects Conducted at the Fiji Dive Operators (FDOA) Workshop
April 19, 2000, the Fiji Dive Operators president Curly Carswell of EcoDivers, Savusavu convened a Reef Check training workshop. This was to be the first of three which would encompass all of the dive operations in Fiji. Unfortuantely the coup of May 19 destroyed tourism in the country and put any further plans for the subsequent training periods on hold.
Following are the results of the workshop. Though 100m transects were run by each of the six companies, the first two 20m segments were used as training and the last two were combined with partnered groups. The results are presented. The individual transects ar contained in the appendix 9.5.
5.1 Combined Transects to equal the 4 x 20m
Eco Divers/ Susies Dive Center: Depth 10m
Fish Butterfly
Sponge Sand Rubble Rock
Inter-sections
35
Vuna Divers and Namale Dive Resort: Depth 10-13m
Fish Butterfly
Soft Coral Fleshy Seaweed
Sponge Sand Rubble Rock
Inter-sections
84 25 18 21 0 0 7 3 1
Aqua-Trek Garden I./ Namena I. Resort: Depth 3m
Fish Butterfly
Soft Coral Fleshy Seaweed
Sponge Sand Rubble Rock
Inter-sections
Figure 12 Training session at the Fiji Dive Operators workshop (left). Reef Check diver swims (right) over severly bleached coral area at the Big Blue Dive Site.
(Figure not available in electronic format)
Figure 13. Diver conducting a Reef Check survey of the coral bleaching (left). Divers returning from survey (right).
5.2 Interview of the Fiji Dive Operators Association members.
The Fiji Dive Operators Association are an important part of the Fiji Coral Reef Monitoring Network. This is part of the Global Coral Reef Monitoring Network (GCRMN), of which, we are one of the member countries in the Pacific Node.
Questions were asked of the dive operators to assess their perceptions of the effect of the bleaching event on the coral reefs that they dive and on their business. The following questions were posed. How much coral bleaching occurred in your area? Anemones and soft corals?
What areas/habitats were most effected? Inshore? Offshore? Passages? Depth? Has there been good recovery? What about the fish and other reef inhabitants? Is there any residual bleaching?
Given the political situation, has there been a substantial impact on your business? Have certain areas been taken off your dive list?
Do you have any monitoring progam in place to take account of the changing situation? Do you think the reefs are recovering?
Is there bleaching again this year?
Have you been seeing any Crown-of-Thorns?
5.3 Summary Assessment
Observations by members of the Fiji Dive Operators Association provide a summary of events of the bleaching episode from the perspective of the dive industry. The coral bleaching event was as much a surprise to the dive operators as to the scientific community. Though in a global context, the diving community was well aware of the effects of the bleaching on other dive locations such as the Republic of Palau and the Maldive Islands, in the Indian Ocean, experienced severe bleaching in 1998 (Wilkinson et al. 1998).
attempted coup of May 19th and the bloody military insurrection (October 2000) created political instability, though greatly improved, continues to the present. The resulting loss of tourism due to the turmoil was devastating to the industry, minimising any influence the perception of coral bleaching might have had. Losses in clientele due to the bleaching event were variously estimated to be 5-15%, though dive tourism became non-existant at the height of the conflict the numbers continue to be depressed by 50% or more.
The coral mortality on the reefs was extreme in some areas with 80% of the coral cover dying. This was balanced by low mortality in areas at greater depth (>20m) and those areas inshore which were dominated by species more resistant to coral bleaching such as Porites and Montipora. Fishlife remained abundant despite the dead coral skeletons that were rapidly colonized by algae. A full explanation of the phenomenon of the bleaching event presented to the dive tourists provided an interesting focus. Though some of the dive sites had been abandoned during the bleaching and post-bleaching period, by the following November most of the dive sites were being utilised again. During the period from late October, it was evident that the water temperatures were increasing in a manner similar to the previous year. Indications of early bleaching (bright colour or paling) were being reported from several areas throughout Fiji, most notably Kadavu (January 2001) and Yadua Tabu (January 14). By February 14, Seriatopora, Stylophora and Pocillopora damicornis were all bleached in the Suva area as were some branching Acroporas (approx. 50%) such as A. muricata and A. intermedia and Platygyra sinensis. From the westside of Viti Levu, corals that were being maricultured by Walt Smith International became bleached and began dying. In the wild context in both areas, the small corals, which were developing from the 1999 spawning period, were growing normally seemingly unaffected by the current elevated temperatures. Likewise, the larger corals, which had survived the 2000 bleaching event, were not bleached. Spawning was not reported for the October-November period 2000. Acropora samples taken near Suva revealed no eggs with limited sperm present. The film crew aboard the live aboard dive yacht Nai’a were unable to observe the mass spawning of October, November or December.
Other phenomenon noted was the degradation of the standing skeletal framework of the recently dead coral. The finer architecture of the corallites had become less evident, with the colonies becoming much smoother and represented by only the main skeletal structure. As well, the algal cover that was characteristic of the newly dead colonies now (February 2001) was very much less. The skeleton had become much more brittle, being heavily infested and weakened by sponges, algae and other boring organisms.
With the path of cyclone Paula (March 3-4) traveling south of Fiji, heavy swell removed much of the superficial algae with the reported appearance of the coral being scrubbed. Much of the coral was broken off and washed into the adjacent deeper areas or inshore.
Interestingly, a number of Dive Operators observed some specimens of the large sea anemone Heteractis sp. remained bleached from the 2000 event as did some specimens of the largest massive hard corals Diploastrea heliopora. Most of this latter species had re-established its zooxanthellae or had died, usually in patches, on the larger colony. The crown-of-thorns starfish, Acanthaster planci, was not reported as abundant, though it had been reported with localised elevated numbers prior to the bleaching.
6.0 Results
Survey of a selection of reefs north of Labasa, Vanua Levu confirmed that there was only minor coral bleaching. The reefs were representative of platform reefs within and including the barrier reefs. Percentage cover on these reefs extended from inshore where it was only 10% coral cover involving two species of coral to the offshore area of approximately 60% comprised of 17 species of coral. Bleaching was estimated at less than 1%.
On southern Vanua Levu, bleaching was severe. Sampling here was at a single site on an exposed reef front. The maximum coral cover was 70.8% previous living cover with 82.3% death from bleaching at 6m depth. 17.7% remained unaffected by the bleaching. The shallow area (3m) had less mortality, with 65.1% death. Bleaching at 30m depth was relatively minimal at 4.8%. This sample was taken at the end of June/ early July so many of the coral that were bleached in early March had died.
At Rat Tail Passage on southern Viti Levu near Suva, coral bleaching was similar to southern Vanua Levu. As of May 23, 2000, 41% of the coral remained bleached or partially bleached and 46% had died. 12.6% remained unaffected by the bleaching. By June 11, 5.6% remained partially bleached with 53.7% having died. The normal coral had re-established itself to 40.7%. By July 29 Suva Pass, which is similar in nature, had 28.8% mortality and 70.2% living coral indicating substantial survival. On July 29 at Rat Tail Passage, 34.5% had died and 59.7% had recovered. Observed trends included the survival of small colonies which are now developing despite another year of elevated temperatures in 2001. Such corals as Acropora crateriformis, Echinopora lamellosa, Turbinaria reniformis, and Pocillopora eydouxyi appeared to be resistant to bleaching. Those most liable to bleaching were Platygyra sinensis, Pocillopora damicornis, P verrucosa, Acropora muricata, A. intermedia, Diploastrea heliopora, and Porites spp. The percentage of bleaching was less at both depth and in inshore habitats though these communities varied considerably in species dominance from the shallow water species assemblage.
During February, and early March bleaching had begun again with temperatures elevated in a broad area around the Fiji Islands. In the hardest hit areas in 2000, little bleaching has been observed.
7.0 Discussion
7.1 The Nature of the Bleaching Event
The coral bleaching event occurred unexpectedly, though could have been predicted in the short term by the NOAA SST satellite record and in the longer term by an understanding of the influence that the ENSO cycles play in the probability of the bleaching periods. A retrospective record of bleaching may be inferred from past SST (Hadley Center Data, Edwards pers.comm.).
7.2 Localised influences
It is widely understood that prolonged elevated temperatures in the presence of sunlight gives rise to the bleaching phenomenon. Variation within species to the prolonged effects of temperature raise questions as to the uniform nature of the response. What is curious are the secondary factors that influence the nature and extent of the bleaching. Inconsistencies are thought to be the result of the influence of secondary variables. The combination of light (cloudiness, UVR), genetics, period of exposure, water flow, oxygen and other (secondary) variables with temperature anomalies over reefs should hold the key to explaining the variation seen between corals and across reefs. (CHAMP Corallist, Hoegh-Guldberg, Aug. 2000). As an example, differential survival of corals in the Seychelles was attributed to different water flow regimes, residence time and localised upwelling (Bradshaw et al, 2000).
Figure 14. Variation exhibitied in the responses of coral to bleaching: A) is between colonies B) within mono-specific stand C) within colony
(Figure not available in electronic format)
During the 1998 bleaching event in Palau and in Fiji in 2000, corals in very shallow water survived much better than those just a few feet deeper. Presumably corals on these these shallow water reefs are adapted to extreme heat and sun due to exposure during low spring tides, and therefore better able to survive a warm water anomaly. There are four reef environments where corals have a better chance of survival during a warm water anomaly:
1. Reefs that are exposed at low spring tide 2. Reefs close to shore especially near rivers
3. Reefs with strong water flow during changing tides 4. Reefs below about 30 meters depth
(Carlson, CHAMP Corallist, Aug. 2000)
7.2.1 Temperature
The difference in species composition of inshore vs. offshore communities provide most of the basis for the explanation for differential coral bleaching on a local scale. Factors such as the variation in larger scale fluctations in temperature may play an important role in the amelioration of prolonged high temperatures. The range of temperature fluctuations that is characteristic of inshore areas make the coral more tolerant to the temperature extremes and, by extension, less affected by the a larger range of fluctuations. The first is adaption to a stressful environment in which they are conditioned to large range of temperatures. This has proved very true for the hard corals but is not the case of the fleshy soft coral, Sarcophyton, which was subject to wide spread bleaching in the intertidal areas.
population of corals (same species) living in neritic coastal waters, in inner areas of the lagoon, appear to be genetically more adapted to tolerate : high temperature, turbid waters after rainfalls, even falls of salinity. Today in Mayotte, probably the recovery of coral on the mid-lagoon patch reefs (recruitement) is due to larvae coming from these coastal coral populations. This is one of the main reasons to protect these "special" reefs in muddy environments from all the effects of coastal works (marinas, dredgings, infilling of littoral areas for roads, etc. (B. A. Thomassin, CHAMP Corallist, Aug., 2000).
Prolonged temperature exposure is the key component in causing bleaching. The rapiditiy of temperature fluctuations, this doesn’t seem to impart much stress. Summer temperatures in Oman, for example, fluctuated daily up to 8 deg. C with maxima up to 33 deg. C and had no apparent effect on an abundant coverage of 26 species of corals (Coles,1997); Quinn and Johnson (1997)). Temperature fluctuations near upper thermal limits were observed with no negative effects on corals near the Kahe Point thermal outfall in Hawaii (Coles,1975). Bleaching threshold(s) in the Gulf apparently are a function of dose-duration. Extreme temperatures are experienced by the Gulf's "tough" corals almost every year, yet bleaching occurs only when exposure duration lasts beyond a certain threshold. The 1996 and 1998 episodes suggest such a mechanism, with a delayed response. Gulf corals are exceptionally tough. Almost every year, between November and December, seawater temperature drops 10-120 C in less than two weeks, with corals showing no ill effects. (Y. Fadlalla, CHAMP Corallist, Sept.2000)
It is interesting that the inshore site of Muaivuso fringing reef had such limited coral death with many of the coral species, which suffered high mortality on the exposed faces, being only partially affected. By an large the Portites/ Montipora assemblage was little affected.
7.2.2 Shading
During the 1998 mass coral bleaching event, on the inshore reefs of the GBR, a relatively lower rate of bleached corals in control plots where macroalgal (mainly Sargassum) canopy were left intact (dense and ~ 1 m high) compared to plots where the canopy had been experimentally removed. The preliminary result can be seen on http://www.gbrmpa.gov.au/corp_site/info_services/publications/reef_research/
issue2_98/2seaweeds.html (Jamal, CHAMP Corallist, Aug., 2000).
Coral s at depth are thought to excape bleaching due to attenuated light through deeper water may be slighly cooler. Inshore turbid conditions reduce light, which may contribut to the deduction of bleaching and mortality.
7.2.3 Current flow
Flow probably has some effect through the removal of some of the feedback effects of the high oxygen tensions that occur during the daylight hours. If the increased production of active oxygen after thermal stress (Hoegh-Guldberg 1999), then flow might have an ameliorating effect through the decreased boundary layer thickness and hence oxygen tensions close to coral surfaces.
during bleaching. Superoxides forming during warm water events, maybe dispersed more efficinetly in flowing water.
Water motion is greatly underrated. Reef calcification is strongly linked to water motion, which is attributed to a trade-off in terms of saturation state with good flushing, the advective, non-symbiotic calcifiers (which includes endoliths down to the bacterial level) can get the CO2 out of their boundary layers faster. Algal symbiosis compensates to a substantial degree. With no motion and especially with high light, excess oxygen becomes a problem by day, oxygen depletion by night (B. Buddemeier, CHAMP Corallist, Aug, 2000)
7.2.4 Oxygen depletion
Dissolved oxygen (DO) depletion may be the cause of some coral bleaching and mortality. Bleaching and mortality of Acropora and Montipora spp. Has been attributed to oxygen depletion in the Houtman Abrolhos Islands, Western Australia. The deep sites (10 to 30m) depressions in the reef had DO concentrations below 1 mg/L in some instances. Transplanted Acropora branches bleached and died within a week at DO's of 2 to 4 mg. Controls suffered no (visible) ill effects. Water temperature was only 24 deg C though (D.Blakeway, CHAMP Corallist, Aug 2000).
Oxygen may be involved (either as an promoter of the photoinhibitory production and build-up of active oxygen within the zooxanthellae as a secondary variable). We know that thermal stress collapses oxygen production and increases respiration (Coles and Jokiel 1977; Hoegh-Guldberg and Smith - J. Exp. Mar. Biol. Ecol. 1989; 129:279-303 and others). If the photosynthetic production of oxygen is down and respiration is up (and probably, bacterial consumption up due to decaying tissue), then oxygen at night over reefs under low flow (especially on reefs where corals dominate) would be expected to decrease, perhaps to critical levels. While not a primary factor, it may actually be an important determinant of mortality (Hoegh-Guldberg, CHAMP corallist, Aug. 2000). Is it possible that the zooxanethellae, existing inside the coral polyp tissue starts competing with the coral polyp for oxygen at night, when dissolved oxygen levels are low? During periods of low mixing and natural aeration of surface waters, the oxygen level may drop below a threshold and the coral polyp is in a state of competing for oxygen with the zooxanethellae (Causey, CHAMP Corallist, 2000).
7.2.5 Weather
The exceptional warming of sea surface temperatures resulted from a combination of increased insolation from the sun traversing its seasonal path to the Tropic of Capricorn and back. With its zenith passing over the latitude resulted in an apparent prolonged period of heating. This happens twice with in a short period of tiem as the the suns azimuth passes directly over the group in January-February and then again in March and April as it returns northward.
8.0 Bibliography
Bradshaw, C, Spalding MD, Teleki, KA,and Spenser, T. (in review) Variability in Coral Bleaching and Related Mortality in Within-reef Scales, Southern Seychelles, Western Indian Ocean. Seminar session. International Coral Reef Symposium, Bali 2000
Coles S.L. (1975) A Comparison of Effects of Elevated Tyemperature versus Temperature Fluctuations on Reef Corals at Kahe Point, Oahu, Pacific Science 20 29:15-18)
Coles, S.J., and. Jokiel P.L. 1977. Effects of temperature on photosynthesis and respiration in hermatypic corals. Mar Biol 43: 209-16.
Coles, S.J., and Jokiel P.L.. 1978. Synergistic effects of temperature, salinity and light on the hermatypic coral Montipora verrucosa. Mar.Biol 49: 187- 95.
Coles, S. L., and Fadlallah Y. H.. 1991. Reef coral survival and mortality to low temperatures in the Arabian Gulf: low species-specific lower temperature limits. Coral Reefs 9: 231-7.
Coles, S. L. (1997) Reef corals occurrinng in a highly fluctuating temperature envionment at Fahal Island, Gulf of Oman (Indian Ocean), Coral Reefs 16:269-272
Cumming, R.L., Carlson B.A., Dulvy N.K., Hughes A., Koven J.F., Lovell E.R., Quinn N.J., Sykes H.R, Taylor O.J.S., Toscano M.A., Vaughan D (in review). Geographic extent and severity of mass coral bleaching in Fiji 2000, in relation to seawater temperature.
Gleason, D. F.; Wellington, G. M. 1993 Ultraviolet radiation and coral bleaching. Program in Evol. Biol. and Ecol., Dep. Biol., Univ. Houston, Houston, TX 77204-5513, USA, NATURE Vol. 365, No. 6449, pp. 836-837 ISSN 0028-0836
Glynn P.W. (1993). Coral reef bleaching: ecological perspectives. Coral Reefs 12:1-17.
Goreau, T.J.; Hayes, R.L. 1994. Coral bleaching and ocean "hot spots" AMBIO Vol. 23, No. 3, pp. 176-180 ISSN 0044-7447 1994.
Hoegh-Guldberg O. and Smith G.J. 1989. The effect of sudden changes in temperature, light and salinity on the population density and export of zooxanthellae from the reef corals Stylophora pistillata Esper and Seriatopora hystrix Dana, J. Exp. Mar. Biol. Ecol. 1989; 129:279-303
Jokiel, P.L.; Coles, S.L. 1990. Response of Hawaiian and other Indo-Pacific reef corals to elevated temperature. Univ. Hawaii, Hawaii Inst. Mar. Biol., P.O. Box 1346, Kaneohe, HI 96744, USA Coral Reefs. Vol. 8, No. 4, pp. 155-162 ISSN 0722-4028.
Lesser, M.P.; Stochaj, W.R.; Tapley, D.W.; Shick, J.M. 1990. Bleaching in coral reef anthozoans: Effects of irradiance, ultraviolet radiation, and temperature on the activities of protective enzymes against active oxygen. Bigelow Lab. Ocean Sci., McKown Point, West Boothbay Harbor, ME 04575, USA Coral Reefs. Vol. 8, No. 4, pp. 225-232 ISSN 0722-4028.
UNEP/IUCN (1988). Coral reefs of the World Vol. 3: Central and Western Pacific. Compiled by Wells SM and Jenkins MD . UNEP Regional Seas Directories and Bibliographies. IUCN and UNEP Pp.329 ISBN 2-88032-945-0.
Van Woesik, R, (in review). Coral Bleaching: Differential Survival Explained by Passive Diffusion and Water Flow. Seminar session. International Coral Reef Symposium, Bali 2000
Wellington, G.M, Glynn P.W., Strong A.E., Naurrete S.A., Wieters and D. Hubbard. 2001. Crisis on Coral Reedfs Linked to Climate Change, EOS, Transactions, American Geophysical Union Vol. 82, No. 1 Jan. 2 2001.
Wilkinson C., Linden O., Cesar H., Hodgson G., Rubens J., Strong A.E. 1999. Ecological and Socieoeconomic Impacts of 1998 Coral Mortality in the Indian Ocean: An ENSO Impact and a Warning of Future Change? Ambio Vol. 28 No.2 March, 1999.
9.0 Appendix
9.1 Fiji Dive Operator Network: Register of Dive Operators
OPERATOR ADDRESS PHONE FAX EMAIL
LIVE-ABOARD DIVE VESSELS
Nai’a Cruises PO Box 332, Pacific Harbour
450382; 450733 hm; 907791
450566 [email protected]
Fiji Aggressor 361382 362930 [email protected]
Mollie Dean Lot 25 Wailada, Lami
Aqua-Trek Mana Island
Castaway Island 661233 665753 [email protected]
Subsurface Fiji 666738 665753 [email protected]
Yasawa Lodge 722266 724456 [email protected]
Plantation Divers
669333 669200 [email protected]
VITI LEVU ISLAND NORTH
Ra Divers Lot 2 Sekoula Est. Nananu-i-Ra
Crystal Divers 694747 694747 [email protected]
EAST Ovalau
Toberua Is. Resort PO Box 567, Suva 472777 472888 [email protected] WEST
Inner Space Adventures Lot 33 Wasawasa Rd. PO Box 10207 Nadi Airport
Total Water Ltd Votualevu Rd Namaka
725523 West Side Water
Sports
34 Thomson Corners, Lautoka
Aqua-Trek; Ocean Sport; Adventure Fiji
PO Box 10215 Nadi Airport 465 Queens Rd
Nadi
Scuba Bula Momi Bay 706100;
92016
706094 [email protected]
Dive Tropex 703944;
703954
703955 [email protected] South Pacific
Adventure Divers
724246 720719 [email protected]
Dive Sonasali 706011;
706225
706092 [email protected] Westside
Watersports
661462 661462 [email protected]
SOUTH
Aqua-Trek Beqa Queens Rd Pac. Hbr
450324 Atlantis Divers Co.
Ltd.
57 Kennedy Ave, Nadi
702704 Coral Coast Scuba
Ventures
75 Marine Drive, Lami
361088, 361241
361047 [email protected] Mikes Divers Fiji Votua Vlg. PO
Box 136, Korolevu, Fiji
530222 [email protected]
Dive Connection (Fiji) Ltd.
PO Box 14869 Suva
16 River Drv. Pac Hbr.
450541 920541
450439 [email protected]
Aqua –Trek Fiji Diving
Seashell Cove Surf and Dive Resort, Momi Bay
Coral Coast Dba 304605 Dive Center (Fiji)
Ltd.
4 Matua St. Walu Bay, Suva
Marlin Bay Resort Beqa I 304042
VATULELE ISLAND
Sydney Australia 550300
311780 303860 [email protected]
TAVEUNI,
880544 880288 [email protected]
Aquaventure
Matei, Taveuni 880441; 880445
Fiji Forbes Laucala Island
880077 880099
Matagi I. Resort 880260 880274 Christene@matangiisland
Susies Dive Center Navaca Plantation 880125 [email protected] Swiss (Fiji) Dive
Center Ltd.
Matei, Taveuni 880586 [email protected]
Vuna Reef Divers Navaca Plantation 880125 [email protected] VANUA LEVU
SOUTH
Eco Divers Copra Shed Marina
Private Mail Bag Savusavu:
Lesiaceva Pt. Ssv
850188;
Namale Resort Namale Savusavu 850435 850400 [email protected]
48
9.2 Bleaching Time Line for the Fiji 2000 Bleaching event
Temp. 0C
In situ (n ) refers to the degree over the max monthly mean SST of 28.3)
Date Location Observations Fiji locations and regional
sites.
NESDIS Hotspot (degrees above max. monthly mean 28.30C)
Regional No elevated temperatures around Fiji though some appearing (x-0C) around Solomon I. and north PNG. Also, .25-.50 South of Samoa and Nth of Fiji.
Bismarck Sea, P. N. G.: Cent./SW Solomon Is: Fiji: W/NW Viti Levu I.: SW Viti Levu I.: Beqa I.: Kadavu: South/cent. Vanua Levu: N. Vanua Levu:
Kingdom of Tonga: Cook Is: Tubuai: Easter I: Western Australia:
(.50-.75; (.75-1.0: 20%)) (.50-.75; .75-1.0: 50%))
0-.25
Fish Patch, Suva
28.03 27.98 27.98
27.6
Dec. 18 Regional No hotspot to the southwest but temp is elevating to the south east (.25-.500C) and south of the Samoa’s and over Tonga
Bismarck Sea, P. N. G.: Cent./SW Solomon Is:
Fiji:
W/NW Viti Levu I.: SW Viti Levu I.: Beqa I.: Kadavu: South/cent. Vanua Levu: N. Vanua Levu:
Kingdom of Tonga: Cook Is: Tubuai: Easter I: Western Australia:
(.50-.75; .75-1.0) 50%
.75-1.0 Fish Patch, Suva
49 Dec. 21 Regional
Consider this the date of the
beginning of the hotwater
event based on the hotspot
charts. Hotspot beginning to form
southwest of Fiji (.75-1.000C). It includes the areas of the Yasawa Is. Water beginning to warm around Tonga. A trend of warm water is generally occurring on the southwest sides of the various island groups (New Ireland, Solomon Is., Vanuatu and Fiji).Bismarck Sea, P. N. G.: Cent./SW Solomon Is: Fiji: W/NW Viti Levu I.: SW Viti Levu I.: Beqa I.: Kadavu: South/cent. Vanua Levu: N. Vanua Levu:
Kingdom of Tonga: Cook Is: Tubuai: Easter I: Western Australia:
.50-.75 (.75-1.0) 50% .75-1.0 Fish Patch, Suva
28.95 (.65) 28.98 28.61 27.95
Dec. 25 Regional Hot spot forming particularly near Savusavu.
Warmer water in the Solomon’s now concentrated around Bougainville, PNG.
Elevated temperatures SE of Viti Levu.
Bismarck Sea, P. N. G.: Cent./SW Solomon Is: Fiji: W/NW Viti Levu I.: SW Viti Levu I.: Beqa I.: Kadavu: South/cent. Vanua Levu: SE Viti Levu: N. Vanua Levu:
Kingdom of Tonga:
Cook Is: .50-.75 Over remainder .0-.25 Fish Patch, Suva
50 Jan 8,
2000
Regional Area around the Solomon’s and northeast PNG getting much hotter. Fiji continues to warm at (XX) with hot water extending to the east over Tonga: Tongatapu I. (75-1.0 (30%).
Bismarck Sea, P. N. G.: Cent./SW Solomon Is:
Fiji:
W/NW Viti Levu I.: SW Viti Levu I.: Beqa I.: Kadavu: South/cent. Vanua Levu: N. Vanua Levu:
Kingdom of Tonga: Cook Is: Tubuai: Easter I: Western Australia:
.75-1.0; 1.0-1.25 (15%) 1.0-1.25
.50-.75; .(75-1.0 (30%)) 0-.25 (Tongatapu I.) Fish Patch, Suva
Offshore 29.45 (1.12)
Jan 9 Taveuni I.
Inshore 29.53 (1.23) Jan. 14 End of
Savusavu airport
Beginning of the DHW event
for the Taveuni I./ MtMutiny
area (Southern Vanua Levu)
Fiji Dive Operator Association president Curly remembered bleaching beginning.First report of possible bleaching
Taveuni I. Inshore Offshore Mt. Mutiny Fish Patch, Suva