RAPID BIODIVERSITY ASSESSMENT ON THE ESSEI AND
BUTUAH LAGOONS AND THE WHIN RIVER ESTUARY
IN THE SEKONDI-TAKORADI METROPOLIS OF
THE WESTERN REGION OF GHANA
Technical Report
Implemented by the Coastal Resources Center-Ghana and Friends of
the Nation in partnership with:
United States Agency for International Development (USAID)
The University of Rhode Island
The Government of Ghana
SustainaMetrix
The WorldFish Center
Citation: Coastal Resource Center-Ghana/Friends of the Nation (2010), Rapid Biodiversity Assessment on the Essei and Butuah Lagoons and Whin River Estuary in the Sekondi-Takoradi Metropolis of the Western Region of Ghana. Coastal Resource Center in Partnership with Friends of the Nation on the Hεn Mpoano Initiative in Ghana.Technical Report.
Disclaimer:
This study was jointly commissioned by the Hεn Mpoano Initiative with the support of the United States Agency for International Development (USAID). The contents are the responsibility of the consultants and the initiative and do not necessarily reflect the views of USAID or the United States Government.
Cover Photos:
Top row from left to right: Crab species (Cardiosoma armatum) from the Butuah lagoon, fish sampling in the Butuah Lagoon, Marine turtle at the mouth of Butuah lagoon.
Middle row from left to right: Hermit crab, Littorina sp., Mangroves (Rhizophora mangle) at the Whin estuary.
Bottom row from left to right: Collection of fish species from the Whin Estuary, Barnacles and Mud skippers (Periopthalmus barbarus) at the Whin estuary.
Photo Credits: S-P. K. Aheto
Compiled by:
Dr. Denis Worlanyo Aheto (Lead Researcher) Coastal Zone Management Specialist
Department of Fisheries and Aquatic Sciences University of Cape Coast (UCC)
Private Mail Bag, University Post Office Cape Coast
Tel: 0242910056
ACKNOWLEDGEMENTS
This work would not have been possible without the numerous contributions of various people. First, our sincere gratitude goes to Mr. Donkris Mevuta, Executive Director of Friends of the Nation (FoN) and Programmes Coordinator Mr. Kyei Kwadwo Yamoah of FoN for the confidence entrusted in us to conduct this study in support of coastal restoration efforts in the Western Region. Further gratitude goes to Mr. Mark Fenn, Executive Director, Chief of Party and Programme Director, Coastal Resources Center, Ghana (CRC) for providing relevant information when needed, and for reviewing the initial draft. Our sincere gratitude goes to Mr. Kofi Agbogah, Deputy Chief of Staff and Programme Coordinator r of CRC for his insightful review of the draft document. We are thankful to Prof. John Blay for supporting aspects of laboratory identification work. We wish to acknowledge the contributions of the Department of Fisheries and Aquatic Sciences of the University of Cape Coast (UCC) for providing field, laboratory and office equipment in support of this work. We also wish to express our immense gratitude to the following students of UCC who supported in various diverse ways in field data collection- Messrs. Eric Mbroh, Emmanuel Anson, Victor Owusu Appiah, Vincent Egbenya and Mr. Evans Arizi. Finally, we are indebted to the local inhabitants who provided invaluable information to facilitate the work.
This report was produced as part of the project activities of the Integrated Coastal and Fisheries Governance (ICFG) Initiative in the Western Region, Ghana—a four-year initiative supported by the United States Agency for International Development (USAID).
Investigators:
Dr. Denis Worlanyo Aheto (Marine Ecologist and Coastal Management Specialist) Mr. Isaac Okyere (M. Phil Student in Fisheries Science)
Mr. Emmanuel Mensah (GIS, Remote Sensing and Natural Resource Mgt. Specialist) Mr. Justice Mensah (M.Phil. Student in GIS and Remote Sensing)
The data have shown that the wetlands have a vast economic and conservation potential. However, deplorable management, ignorance or conflict of interest on the part of users has led the wetlands onto a path of potentially irreversible destruction. Certainly, a new coastal management thinking and practice are needed taking into account a Ghanaian economic, socio-cultural and environmental perspective. It is argued here that
development as a whole cannot be the adaptation of external views but should be based on local empirical evidence. This allows to defend an own view placing in the context of global trends. Such a holistic approach would be necessary calling for stronger
partnerships including scientists, local and government actors as well as the international community.
CONTENT
1.1 The Terms of Reference... 14
1.2 Research objectives ... 14
2. BACKGROUND ... 17
2.1 Lagoons ... 17
2.1 Estuaries ... 18
2.3 Literature review of wetlands in the Western Region ... 20
3. METHODOLOGY ... 22
3.1 Site description... 22
3.2 Methodology for mapping boundaries and land use change ... 23
3.3 Measurement of hydrographic factors ... 23
3.4 Plankton, benthic and littoral macroinvertebrate sampling ... 23
3.5 Fish sampling and measurements ... 26
3.6 Analysis of invertebrate and fish data ... 26
3.7 Questionnaire surveys ... 27
3.8 Additional considerations: ... 28
3.9 Limitations of the assessment: ... 29
4. RESULTS ... 30
4.1 Spatial information on the wetlands ... 30
4.2 Hydrographic profiles ... 36
4.2.1 Temperature ... 36
4.2.2 Dissolved Oxygen (DO) ... 37
4.2.3 Salinity ... 38
4.2.4 Conductivity ... 39
4.2.5 Turbidity ... 40
4.2.6 pH ... 41
4.3 The Plankton community ... 42
4.4 The Benthic macroinvertebrate community ... 48
4.5 The Littoral community ... 57
4.6 The Fish Community ... 63
4.7 Riparian vegetation ... 73
4.8 Biodiversity assessment of the wetlands... 79
4.7 Issues from the participatory social surveys ... 84
5 DISCUSSION ... 88
6. CONCLUSIONS AND RECOMMENDATIONS ... 93
6.1 Conclusions ... 93
6.2 Recommendations for follow-up studies for graduate and undergraduate students ... 97
6.3 Recommendations on other mitigation actions ... 100
6.5 Recommendations to enhance dialogue, partnership and scholarship ... 105
7. REFERENCES ... 106
8. APPENDICES ... 108
LIST OF FIGURES Figure 1: Conceptual framework for the Rapid Ecological Assessment in the Sekondi-Takoradi Metropolis of the Western Region (modified from the Ramsar Framework for Wetland Inventory (Resolution VIII.6)... 16
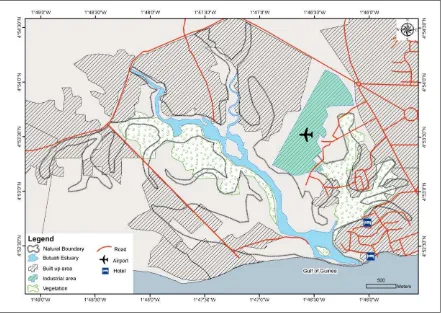
Figure 2: Map of study area showing locations for benthic and littoral sampling (A-E) and collection ... 25
of water samples for water quality analysis (A-G). ... 25
Figure 3: Spatial structure of the Butuah Lagoon comparing change in area of water body between 1973- 2010. ... 30
Figure 4: Spatial structure of the Whin estuary comparing change in area of water body between 1973- 2010. ... 31
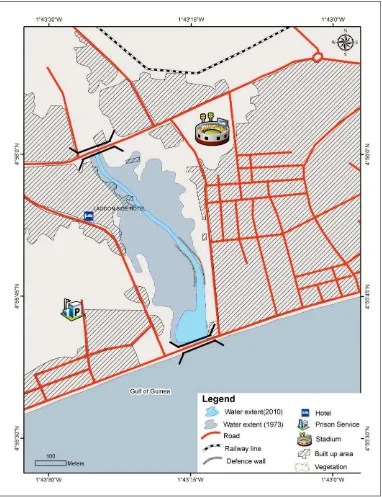
Figure 5: Spatial structure of the Essei Lagoon comparing change in area of water body between 1973- 2010. ... 32
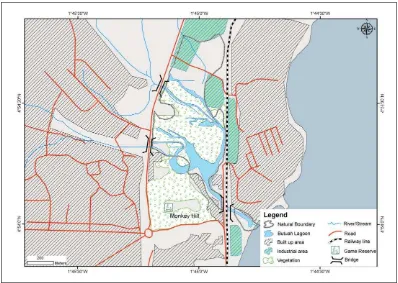
Figure 6: Land use/ land cover scenario around Essei lagoon in 2010. ... 34
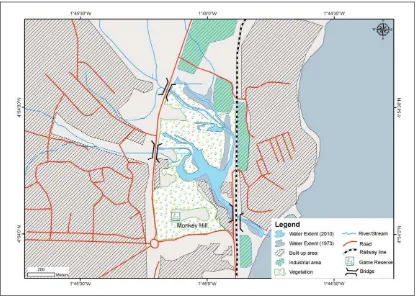
Figure 7: Land use/ land cover scenario around Butuah lagoon in 2010... 35
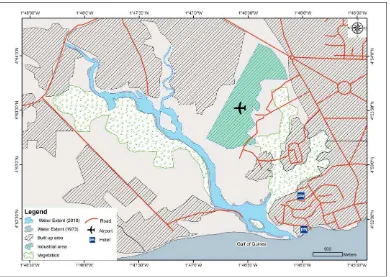
Figure 8: Land use/ land cover scenario around Whin estuary in 2010. ... 36
Figure 9: Temperature profile of the wetlands ... 37
Figure 10: Dissolved Oxygen (DO) profile of the wetlands ... 38
Figure 11: Sanity profile of the wetlands ... 39
Figure 12: Conductivity profile of water bodies ... 40
Figure 13: Turbidity profile of the water bodies ... 41
Figure 14: pH profile of the wetlands ... 42
Figure 17: Percentage composition of benthic invertebrate groups in the three water bodies ... 52
Figure 16: Density of benthic invertebrate groups at five stations in the ... 54
Essei lagoon ... 54
Figure 17: Density of benthic invertebrate groups at five stations in the ... 55
Figure 18: Density of benthic invertebrate groups at five stations in the Whin ... 56
Estuary ... 56
Figure 19: Percentage composition of littoral invertebrate groups in the three water bodies ... 61
Figure 20: Richness and diversity of littoral invertebrates at the different stations of the three water bodies ... 62
LIST OF TABLES
Table 1: Differences between lagoon and estuary ... 19 Table 2: Water Extent in 1973 and 2010 ... 33 Table 3: Land use/ cover pattern around the water bodies ... 33 Table 4: List of phytoplankton in Essei Lagoon in the Sekondi – Takoradi metropolis .. 43 Table 5: List of phytoplankton in Butuah Lagoon in the Sekondi – Takoradi metropolis 44 Table 6: List of phytoplankton inWhin Estuary in the Sekondi – Takoradi metropolis ... 45 Table 7: List zooplankton in the Essei Lagoon in the Sekondi – Takoradi metropolis .... 46 Table 8: List of zooplankton in the Butuah Lagoon in the Sekondi – Takoradi metropolis ... 47 Table 9: List of zooplankton in the Whin Estuary in the Sekondi – Takoradi metropolis 47 Table 10: Richness of plankton and zooplankton genera of the three water bodies ... 48 Table 11: List of benthic macroinvertebrates of the Essei Lagoon in the sekondi-Takoradi metropolis ... 49 Table 12: List of benthic macroinvertebrates of the Butuah Lagoon in the
sekondi-Takoradi metropolis ... 50 Table 13: List of benthic macroinvertebrates of the Butuah Lagoon in the
sekondi-Takoradi metropolis ... 50 Table 14: Richness of benthic invertebrate families of the three water bodies ... 51 Table 15: Richness and diversity indices for the benthic invertebrate communities of the three water bodies ... 51 Table 16: Sorensen‘s similarity index for pairs of benthos communities of the three water bodies ... 51 Table 17: List of littoral macroinvertebrates of the Essei Lagoon in the Sekondi-Takoradi Metropolis ... 58 Table 18: List of littoral macroinvertebrates of the Butuah Lagoon in the
Table 29: Size range of fish species in the three water bodies ... 69
Table 30: Classification of fish communities found ... 70
Table 31: Rare and threatened species and breeding patterns (Species of conservational importance) ... 71
Table 32: List of riparian vegetation around the Essei lagoon ... 73
Table 33: List of Riparian vegetation around the Butuah lagoon ... 75
Table 34: List of Riparian vegetation around the Whin estuary ... 77
Table 35: Floral diversity of the wetlands ... 78
Table 36: Mangrove stands around the wetlands ... 78
Table 37: Comparative rating of biodiversity assets of the wetlands ... 79
Table 38: Site criteria and some ecological differences ... 80
ACRONYMS
BMBF Bundesministerium fuer Bildung und Forshung
(German Foreign Ministry for Education and Research)
CBD Convention on Biological Diversity
CRC Coastal Resources Center-Ghana
D Margalef‘s Richness Index
DFID Department for Foreign and International Development
DO Dissolved Oxygen
DSS Decision Support System
EPA Environmental Protection Agency
FoN Friends of the Nation
GIS Geographic Information System
GPS Global Positioning System
H’ Shannon-Wiener Diversity Index
ICFG Integrated Coastal and Fisheries Governance Initiative
J’ Pielou‘s evenness
Mg/L Milligrams per liter
MPA Marine Protected Area
REA Rapid Ecological Assessment
SAMP Special Area Management Plan
UCC University of Cape Coast
USAID United States Agency for International Development
µs/cm Microsiemens per centimeter
EXECUTIVE SUMMARY
The overall objective of this study was to provide basic scientific data relevant for biodiversity assessment of the Essei and Butuah lagoons and Whin estuary in the Sekondi-Takoradi Metropolis of the Western Region of Ghana in order to determine their relative ecological health. This largely involved the estimation of the present functions of the wetlands, their services and biodiversity, together with analysis of prevailing threats and challenges. Therefore it was of crucial importance to assess the hydrographical parameters as well as carry out field and laboratory studies on the general flora and fauna species content of the wetlands. Additionally, mapping of the major terrestrial, land use/ cover around the marine habitats was conducted based on a GIS and remote sensing application. This was supported by ground based habitat mapping procedures using a GPS receiver.
The study largely based on a Rapid Ecological Assessment (REA), consistent with the Ramsar Framework for Wetland Inventory. The analysis therefore involved many steps and considerations. Thus, knowledge of integrative approaches was applied. It aimed to cover part of the analysis by assessing those factors which may differ among the wetlands but with focus on issues that have previously not been studied.
Information has been provided relative to biodiversity assets of the wetlands and possible impacts on them to allow for full consideration or mitigation of those impacts based on the
Riparian vegetation mainly grasses, sedges, shrubs, and trees
Mangroves
Providing indications of reptile, amphibian and birds data that could be derived. To understand the possible threats, the analysis reviews the condition of the habitats considered being of high or low biodiversity significance. This was done relative to the occurrence, species composition, richness and diversity of the general fauna. For the riparian vegetation, a species list has been generated. A database of biodiversity assets has been generated as a preliminary measure for future studies and information systems monitoring of species.
Particularly at Essei and Butuah, it was concluded that there would be a need to enhance marine wildlife and biodiversity. Friends of the Nation (FoN) and other stakeholders must be proactive in matters of conservation of the wetlands in order to keep pace with the human impacts where necessary.
1) For instance the setting up of Protected Areas at Essei following the removal of the lagoon defence walls (groins) constructed across the lagoon for the restoration of fisheries. Such an action would potentially expand the wetland corridors at Essei.
2) The development of Special Management Plans for the Whin estuary for development of ecotourism would be relevant for conservation purposes of the already ―pristine‖ environment of the estuary and to also generate some income for the local people. 3) The Essei and Butuah lagoons and associated vegetation are presently faced with serious
4) Mangrove restoration is highly encouraged in adjacent areas of the lagoon. Attempt must be made to balance the interests of various multiple groups in balance with marine biodiversity conservation.
5) This study also prompts the need to engage in further scientific studies at the postgraduate and undergraduate levels.
6) It encourages the need to use databases and develop information systems monitoring concept for the wetlands.
7) Capacity building for the monitoring of hydrological factors, beach front monitoring, assessing the potential impacts of sea level rise on biodiversity in those wetlands would be necessary. Basic and secondary school students including their teachers could be deployed for these tasks with some motivation infused into the process.
8) For other scientific considerations, these aspects should also consider the effects of large scale physical ocean processes that address future impacts of climate change and ocean acidification.
For the habitats studied, it was of special interest to notice that the overall area of the Butuah Lagoon and Whin Estuary had increased in water surface area by a margin of 17 % and 14. 6 % respectively between the period between 1973-2010. This may be attributed to possible impact of climate variability maybe due to increased water temperatures, precipitation or sea level rise. What is not apparent is the overall change in biodiversity during the period due to the absence of long-term data on the biodiversity assets. On the contrary, it was revealed that Essei lagoon had decreased in its entire surface area by a margin of about 80% over the period of about 30 years (1973-2010).
The implications of the spatial change of the wetlands on their biodiversity assets are unclear due to the lack of long-term data on biodiversity information. However, the overall increase in area of the Butuah lagoon and the Whin estuary may have had positive impact on biodiversity assets, possibly through the creation of new breeding and feeding grounds for fisheries productivity and the development of plankton and invertebrate communities. Habitat loss at the Essei lagoon may have contributed to a possible loss in biodiversity to a great extent. In addition, habitat fragmentation of the Essei lagoon through creation of the defense wall (groin) in the middle of the wetland targeted towards flood control possibly aggravates the situation.
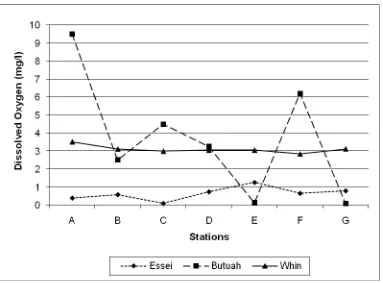
The water quality parameters provided indications of the changing conditions across the habitats and distribution of fisheries resources and other relevant aquatic flora and fauna. In principle, the Whin estuary recorded fairly stable conditions relative to the survival and proliferation of fish species and aquatic fauna and flora. Indeed, Whin recorded the best water quality standards. The low oxygen content of the Essei Lagoon calls for serious management intervention on curbing the organic inputs through control of effluent discharge or run-offs. Optimum levels for fish survival and growth is about 5mg/L.
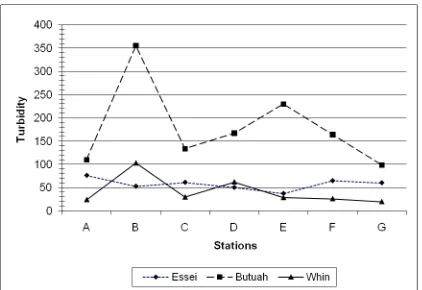
However, oxygen content of the Essei lagoon was at a critically low levels ranging between 0.1-1.27 mg/L, which may be regarded as near deoxygenation. This may have accounted for the very low fisheries content of the lagoon. Turbidity in the Butuah lagoon showed record high values that may have impacted negatively on the productivity of the system in general. This may be due to the intense human activities around the lagoon such as agricultural and organic effluent discharge.
Euphobia heterophylla, Euphorbia hirta, Phyllantus amarus, Boerhavia diffusa, Ipomoea cairica and Ipomea barbata. Besides, some of these herbs are used for medicinal purposes e.g. Physalis angulata is used for treating palpitation of the heart, Acanthospermum hispidum for curing leprosy. The leaves of Achyranthes aspera are used for treating itching and for headaches. Whin had the highest diversity in mangrove species namely Rhizophora mangle, Avicennia Africana, Laguncularia racemosa. Essei and Butuah lagoons habour single species mangroves namely
Avicennia portulacastrum and Avicennia africana respectively.
1. INTRODUCTION
This report addresses the issue of ―Biological diversity‖ in three urban wetlands in the Sekondi-Takoradi Metropolis of the Western Region of Ghana. It provides baseline scientific information that could be used to strengthen the management of coastal wetland ecosystems to assure livelihoods and food security, ecotourism as well as biodiversity conservation in the region. In broader terms, ―Biological diversity refers to the variability among living organisms from all sources including, inter alia - terrestrial, marine and
other aquatic ecosystems and their ecological complexes of which they are part. This
includes the diversity within species, between species, and of ecosystems (CBD, 1992). For the purposes of this project, the term has been used in the context of the selected wetlands of concern. ―Biological diversity‖ is often pronounced ―Biodiversity‖, and is often used as a relative measure of ecosystem health. Usually high level of biodiversity is desirable and provides an indication of relative good health status of the ecosystem concerned. Therefore, maintaining biodiversity is necessary in order to assure the survival and productivity of ecosystems and livelihoods.
baseline data on available species in the wetlands are lacking. Furthermore, spatial information on the present natural boundaries, extent of loss of the wetlands or encroachment on adjacent riparian vegetation has not been quantified. However, for the implementation of effective ecosystem management programme, these data are mandatory requirements.
The study was commissioned by the Friends of the Nation (FoN) against this background for conservation purposes and to recommend improvement measures at the selected sites. The project had as a primary objective to conduct rapid ecological surveys to estimate the biodiversity status of selected wetlands namely the Essei and Butuah lagoons and the Whin River estuary. Among others, the information could be used to advance effective collaboration with local Government authorities and other stakeholders in advocating for necessary bye-laws on their wise use. The Project was based on a three-week field sampling and laboratory investigations, as well as the use of Geographic Information Systems (GIS) and Global Positioning Systems (GPS). The mass of information gathered is numerous, and goes beyond what could be handled in single report. This therefore required to focus on particular aspects, in particular relating the scientific findings to possible mitigation actions to reduce impacts on biodiversity assets identified.
1.1 The Terms of Reference
1. Collect data on the general flora and fauna species content of the wetlands 2. Identify any rare and threatened species within the wetlands ecosystems
3. Identify the breeding patterns and habitat of the rare and threatened species needs to support enrichment planting and management plan preparation
4. Provide monitoring and evaluation indicators for the biological systems within the wetlands ecosystem
1.2 Research objectives
Specifically, the study aimed at ensuring that:
a database on the classification of the flora and fauna species, providing information on their breeding patterns are provided.
GIS and remote sensing techniques are deployed to characterize the spatial extent of the wetlands, including an assessment of their natural borders (contours) of the wetlands and settlement areas, including any assessment of change in land use/ estimate change in area of surface water over the past 3 decades where necessary. degradation or sanitation issues are addressed.
socio-economic and environmental values are addressed. water quality data of the wetlands is analysed;
conservation priorities for the wetland areas are suggested.
Fig. 1 provides a conceptual framework used as a guidance to implement the rapid assessment. It was adapted from, and consistent with the Ramsar Framework for Wetland Inventory. However, it must be noted that certain steps were minimized in order to take account of the very short time required to undertake such a preliminary assessment.
2. BACKGROUND
Globally, lagoons and estuaries are among the first ecosystems to receive international attention through the "Convention on Wetlands of International Importance, which opened for signature at Ramsar, Iran, in February 1971. Lagoon and estuarine wetlands are among Ghana‘s most valuable wetlands. These wetlands are closely tied to salt marshes, mangroves swamps and tidal flats which constitute significant features of Ghana‘s coastline providing critical habitats for many fish and wildlife species that support Ghana‘s economy.
2.1 Lagoons
By definition, lagoons are shallow coastal water bodies separated from the ocean by a barrier, connected at least intermittently to the ocean by one or more restricted inlets, and usually oriented shore-parallel (Kjerfve, 1994). Coastal lagoons of Ghana have been classified into two types namely ―open‖ and ―closed‖. Yankson and Obodai in 1999 provided a vivid account on the different types of lagoons in Ghana, classified as follows: Open lagoons: These are characterised by the infrequent closure to the sea. There are two main types existing in Ghana:
(a) Classical open lagoons: Theseare usually open to the sea but seldom barred from it by a sand bar; and
(b) Man-made open lagoons: These maintain a permanent contact with the sea as a result of human intervention e.g. The Essei lagoon.
Closed lagoons: These lagoons are usually closed to the sea but occasionally opened due to factors such as rainfall or floods, or due to the incidence of high tides. Three types of closed lagoons have been identified in Ghana namely:
(a) Lagoons which get cut off from the sea by sand bar for greater part of the year, but open for a short period during the rainy season, and are regarded as ―Classical closed. E.g. Butuah lagoon falls in this category of lagoons:
(c) The non-brackish, small sized coastal water bodies which lie ‗permanently‘ behind a sand bar and may be regarded as ‗isolated closed‘ lagoons.
2.1 Estuaries
Estuaries are partially enclosed coastal water bodies that have a free connection with the open sea, but whose water is diluted by fresh water from a river or stream. Estuaries provide interaction between the sea, river and land. Their orientation is more or less perpendicular to the sea, and has a funnel shape permitting a large seawater-freshwater interchange. The sources of estuarine water, like some lagoons, are land drainage, direct rain and the sea, but in this case the volume of land drainage far exceeds that of lagoons and therefore influences the salinity to a larger extent (Yankson and Kendall, 2001). The classification of estuaries is based on various parameters including the nature sediment, salinity and mode of formation. Yankson and Kendall in 2001 provided a functional classification based on salinity as follows:
(a) Positive estuary: when seawater enters it as a bottom current with the lighter freshwater leaving as a surface current into the sea. This is the most common type of estuary that is more prevalent in temperate regions and also when there is a large volume of freshwater discharge.
(b) Negative estuary: occur when the rate of evaporation exceeds the freshwater input and therefore results in hypersaline estuarine water which sinks and enters the sea as a bottom current. This type is more prevalent in the tropics and the Whin estuary is no exception.
(c) Neutral estuary: when there is a balance between evaporation and freshwater input, causing a more or less uniform salinity profile from the surface to the bottom. This type of estuary is rather rare.
season among others. The sediment in estuaries is predominantly mud and therefore usually contains very little oxygen. This tends to render estuaries unsuitable for active, mobile animals while it encourages burrowing and low oxygen tolerant forms.
Table 1: Differences between lagoon and estuary
LAGOONS ESTUARIES
Shallow coastal water bodies separated from the ocean by a barrier, connected at least intermittently to the ocean by one or more restricted inlets
Partially enclosed coastal water bodies that have a free connection with the open sea, but whose water is diluted by fresh water from a river or stream Usually oriented shore-parallel Orientation is more or less
perpendicular to the sea, and has a funnel shape permitting a large seawater-freshwater interchange Horizontal salinity gradient established Salinity gradient decreases from the
seaward end to the riverine end Lower sediment load due to lower input
from fresh water sources and land drainage
High sediment input from land drainage (rivers or streams
Connected to the sea either by natural factors or human interference and the connection may be permanent or periodical/occasional or even seasonal.
Have permanent connection with the sea
Classified as open (classical and man – made) or closed (classical, spring tide – fed and isolated) based on the mode of
formation and seasonality of connection to the sea
2.3 Literature review of wetlands in the Western Region
The Western Region of Ghana has an area of about 21,391 km2 (estimating to about 10% of the total land area of Ghana) with a 202 km coastline. The Western Coastline is made up of six districts which cover approximately 203 km. The coastal habitats of the Region are of various types. These include sandy beaches, lagoons and estuaries, mangroves and inland wetlands. Despite their importance in sustaining the flows of environmental goods and services, they face a variety of threats.
Review of literature done by deGraft-Johnson et al. (2010) documents the following as the major threats to the survival and management of coastal water bodies in the Western Region include:
Overexploitation of marine fisheries resources due to overcapitalization of the fishing industry, use of small mesh nets in the beach seine fishery and other illegal fishing methods
Loss of coastal habitat through establishment of monocrop plantations, destruction of wetlands for infrastructure development, solid waste disposal, harvest of mangrove forests, beach sand mining and tourism development
Pollution of the marine and coastal environment from domestic and industrial solid waste, siltation, sewage disposal, mining waste, pesticides and fertilizers By-catch of endangered species like seabirds, sea turtles, sharks, dolphins and
manatees from the use of nonselective gears in the fishing industry
Accelerated coastal erosion from deforestation, sand and stone winning, and infrastructure development as the Takoradi Port and the nearby fishing harbor Increasing population density which could bring about an increase in the rate of
exploitation of resources of fragile ecosystems
Weak governance, legislation and institutional framework due to the fragmented nature of environmental legislation and lack of political will to enforce legislation Development of oil and gas resources which has the potential to increase conflicts
Climate change and sea level rise which has the potential to severely impact the shoreline and further weaken the resilience of coastal habitats and biodivervsity and human communities
Spread of invasive species such as the Water hyacinth Eichhornia crassipes in the wetlands and blooms of the green alga Enteromorpha flexuosa in the marine coastal waters could significantly hamper fishing activities and affect the livelihoods of coastal communities.
3. METHODOLOGY
Rapid Ecological Assessment (REA) methods were deployed for the study of the wetlands. REA is regarded as a suite of methods that are usually used to assess wetlands. For the surveys in the Whin estuary, Butuah and Essei lagoons, key aspects of biodiversity were investigated covering information about their species e.g. their rarity, endemism, range, and habitat requirements. Information on habitat condition and threats were also recorded. Attempts were made to generate a species lists for these habitats. Not only address the prevailing threats to the environment, but also aspects of their socio-economic and cultural implications were documented.
3.1 Site description
(i) Essei lagoon: This lagoon maintains a permanent opening into the sea as a result of human interference. The wetland areas could be described as low-lying occurring around the lagoon. The lagoon is located in Sekondi and is bordered to the north by the STMA road, east by the Bakaakyir road and west by the Bakaano road. Fishing in the lagoon is carried out by about twenty resident fishermen.
(ii) Butuah lagoon: The Butuah lagoon is located in New Takoradi, a suburb of Takoradi. It is bordered to the north by the Sekondi-Takoradi Road. This lagoon is the classically closed lagoon type that is cut off from the sea for a greater part of the year but opened for a relatively short period of time during the rainy season. According to key informants, fishermen fishing in this system number about twenty-five, and fishing activities managed under the leadership of a Chief fisherman.
heavily vegetated with tickets of mangrove stands, and the indication of a closed vegetation pattern surrounding the estuary. Interviews reveal that there are about 50 fishermen working within the estuary alone.
3.2 Methodology for mapping boundaries and land use change
In order to provide data on the current boundaries and land use patterns around the Butuah and Essei lagoons and estuary of the Whin river, these water bodies were mapped using Trimble Juno ST Global Positioning System Receivers (GPS). This information was complemented by data extracted from georeferenced google earth images. To provide an indication of changes in the areal extent of the water bodies and also in the land use patterns within the immediate surroundings of the three water bodies, the current boundary and land use data were processed and compared with boundary and land use data extracted from a 1973 1:50,000 topographic map of the area.
3.3 Measurement of hydrographic factors
Water quality was assessed relative to predetermined standards for critical concentrations for certain hydrographic factors and pollutants. The water samples were collected at different locations and depths namely surface and bottom from selected water bodies of critical importance. Hydrographic parameters measured were:
- Salinity,
- Dissolved Oxygen (DO) - pH,
- Conductivity, - Temperature; and - Turbidity
These were achieved with the help of Water quality checker (Model: Horiba Water Quality Checker U-10).
3.4 Plankton, benthic and littoral macroinvertebrate sampling
laboratory, the phytoplankton and zooplankton were examined under high power objectives of compound microscope and identified using plankton manuals (Newell and Newell, 1963).
Three replicates of benthic and littoral samples were taken from five stations designated A – E in each of the three water bodies for studies on the benthic and littoral fauna; where A was the station closest to the mouth of the water bodies, and E referring to the upper limits of the northern section of the water bodies ( Figure 2). An Ekman grab (15 cm × 15 cm) was used in collecting benthic sediments while littoral samples of soft banks were collected by sweeping the sediments using a 50 cm × 50 cm quadrat with fixed net (800 μm). The random quadrat sampling method (Krebs, 1999) was adopted at the mouth of the Whin Estuary (Station A) due to the rocky nature of the banks (quadrat size: 50 cm × 50 cm), and macrofauna occurring within the area enclosed by the thrown quadrat were collected. The sediment samples were screened in the field using a set of sieves of mesh sizes 4000 μm, 2000 μm and 500 μm, and the animals retained in the sieves were preserved in 10% formalin for detailed examination in the laboratory. Prior to sorting, a pinch of Bengal rose dye was added to the samples to stain the organisms and enhance their visibility.
The macrofauna found were examined under a dissecting microscope and identified with
the aid of laboratory manuals (Edmunds, 1978; Dejoux et al., 1982; Yankson & Kendall,
2001; Hauer & Lamberti, 2006). Counts of the different taxonomic groups in the samples
It is important to note here that, larger wetland areas exist beyond the study area. These existing wetland areas were not included in this study for lack of resources. Notice must however be given that wetlands have been developed such as places west of Essei lagoon and behind the Effia Nkwanta Hospital. These would require further studies. For the Whin river, larger tributary areas exist to the east and west exist that were not assessed in this present study, and across the main highway to the north. This also applies for the north of the road at Butuah lagoon.
3.5 Fish sampling and measurements
A pole-seine net (7 m long and 1.5 m deep) with stretched mesh size of 5mm was used for the fish sampling. This particular net was used because of the small size, shallowness and soft bottom of the water bodies; another reason was to ensure the capture of small fishes. Fish samples were also purchased from the local fishermen as complementary information. The fishes were preserved in 10% formalin and transported to the laboratory for further examination. The fish were sorted and identified to their families and species using manuals and keys on fin fishes and shellfishes in Ghana and West Africa (Dankwa et al., 1999; Schneider, 1990; Holden and Reed, 1991; Paugy et al., 2003; Kwei and Ofori-Adu, 2005), and the number of individuals belonging to each species from the water bodies was recorded. The total length (TL) of fish specimens was measured to the nearest 0.1cm.
3.6 Analysis of invertebrate and fish data
The invertebrate and fish samples from the water bodies were analyzed for species
richness, diversity and species composition. Species richness was determined using
Margalef index (d) given as , where s is number of species in the sample, and N
is the number of individuals in the sample (Krebs, 1999). Diversity of the communities
was ascertained by the Shannon-Wiener index (H′) given as H′ = - , where s is
to species i in the community (Krebs, 1999). The evenness or equitability component of
diversity was calculated from Pielou‘s index (Pielou, 1996 in Blay, 1997) given as J′ = H′/Hmax where Hmax= lns. The degree of similarity between the communities in the
different water bodies was determined as Cs = (Krebs, 1999), where Cs is
Sorensen‘s index, j is the number of species common to a given pair of water bodies, and
a and b are the number of species occurring in either of the pair.
The richness and diversity of littoral invertebrates at each of the five sampling
stations of the three water bodies was determined while the benthic macrofauna were
analysed for their densities at these stations.
In computing the density of the benthic invertebrates, the procedure provided by
Elliot (1977) was followed due to the small number of grab samples taken from each
station (n= 3). Counts of individuals belonging to each taxon in a sample were log
transformed. Where all three samples contained organisms, the number of individuals, x,
belonging to each group of invertebrates was transformed as , and where zero
counts occurred, was used for the transformation. The arithmetic mean of the
transformed counts was then calculated, and the derived mean (= geometric mean) which
is the mean number of individuals of each taxon per dredge area (225 cm2 = 0.0225 m2)
was computed as the antilog of the mean of transformed counts. The derived mean value
was converted to mean number of individuals per 1 m2 by multiplying this number by a
factor of 44.4. Size range of fish samples from each of the water bodies was determined.
A social survey would be conducted for a socio-economic and cultural evaluation of study sites using questionnaires. Key informants would be contacted and focused group discussions conducted where necessary. The data are anticipated to support evaluation of both threats and opportunities for conservation. Additionally, broad demographic and regulatory information would be collected on:
population size of dependent population
cultural issues such as customary laws regarding the use of the natural habitats and traditional conservation values
economic activities and development being pursued
reliance on natural habitats for food, medicines, fuel, building materials, etc.
address land ownership issues, including customary and those belonging to government.
Information on the human activities taking place in the region regarded as threats were collated. Such documentation will enable to link observed or possible environmental impacts with their probable uses, and predict likely impacts in the future.
3.8 Additional considerations:
(a) Rarity: Rarity in this sense would refer to local or country rarity. It will exclude regional considerations. This may be of crucial importance for the local inhabitants or provide for income generation in the context of ecotourism. This is because when a species is rare, it is obvious that efforts should be mustered to conserve it to the latter.
(b) Geographic range/ endemism: Geographical distribution is a major factor used for estimating the biological value of a species. The highest value is given to species (called local endemics) that only exist in a small area. Due to their small distribution range, it is imperative to preserve their limited natural habitats, because otherwise they may rapidly become endangered. The survival of such species largely depends on conservation
(c) Habitat specialization: this criterion was used to determine the conservation needs of a species. The more specialized a species is in terms of its habitat requirements, the more exposed or vulnerable it could become if efforts are not made to preserve its preferred habitats. Habitat considerations, in terms of habitat distribution are also paramount to be assessed and documented whether continuous or in small their occurrence in small patches must be noted.
(d) Flagship species: This refers to identifying single species that appeal to a wider segment of the local population to be of great importance to the area. Usually, these require large expanses of habitat, which is likely to help conserve many other animals and plants with much smaller habitat requirements.
3.9 Limitations of the assessment:
The rapid nature did not allow for full wetland inventory. However, it was generally possible to collect initial baseline data or provide preliminary results for early management interventions. The information could be used for detailed assessment at a later stage depending on level of resources available.
Time limitation for data collection, data processing and reporting Study could did not capture data on seasonality
4. RESULTS
4.1 Spatial information on the wetlands
The areal coverage of the Butuah lagoon in 2010 is 86404 (sq. meters) whilst Essei lagoon covered an area of 110,902 (sq. meters). The Whin estuary spanned an area of 652,202 (sq. meters) as shown in Figures 3-5.
Figure 4: Spatial structure of the Whin estuary comparing change in area of water body between 1973- 2010.
The changes in the areal extent of water surface of the lagoons from 1973 to 2010 are
shown in Table 2. As shown in Table 2, Essei lagoon had significantly decreased in water
surface area by 82.10%. However, the Butuah lagoon and the Whin estuary rather
Table 2: Water Extent in 1973 and 2010
Water body Extent in 1973
(sq. meters)
Extent in 2010
(sq. meters)
Percentage Change
Essei 110,902 19,855 -(82.10)
Butuah 73,774 86,404 17.12
Whin 652,202 747,911 14.67
Currently, the land use/ cover pattern within the natural boundaries of the three water
bodies shows three main classes/categories (Table 3). These categories were identified as
built up area, Industrial and Vegetation.
Table 3: Land use/ cover pattern around the water bodies
Land use/cover
Area
Essei Butuah Whin
(sq meters) Percent (sq meters) Percent (sq meters) Percent
Vegetation 61189 38.38 186887 44.13 1301206 21.06
Built up area 13871 8.7 3265 0.77 1601561 25.92
Industrial - 0 33276 7.86 24855 0.40
Unused/Vacant 84366 52.92 200071 47.24 3250693 52.62
Total 159422 100 423520 100 6177676 100
The current pattern around the Essei lagoon shows that the land use/cover around the
estuary was 38.38% natural vegetation and 8.7 % built up. The remaining land use
Figure 6: Land use/ land cover scenario around Essei lagoon in 2010.
Similarly, the area within the natural boundary of the Butuah Lagoon recorded
natural vegetation as the largest land cover with mostly mangrove and some
scattered patches of reeds, vegetation covered 44.13% of the area. Encroachment
be 50 feet above sea level. Consequently, 0.77% of the boundary has been settled
and 7.86% for Industrial activities (Fig. 7).
Figure 7: Land use/ land cover scenario around Butuah lagoon in 2010.
About 52% of available land around the estuary is unused (Fig. 8). Vegetation and
Built up areas constitute 21.06% and 25.92 % respectively. Industrial sitings
makes up the least component amounting to 0.40%. The data points to the fact
that the natural boundaries surrounding the Whin estuary is the least encroached
Figure 8: Land use/ land cover scenario around Whin estuary in 2010.
4.2 Hydrographic profiles
4.2.1 Temperature
Figure 9: Temperature profile of the wetlands
4.2.2 Dissolved Oxygen (DO)
Figure 10: Dissolved Oxygen (DO) profile of the wetlands
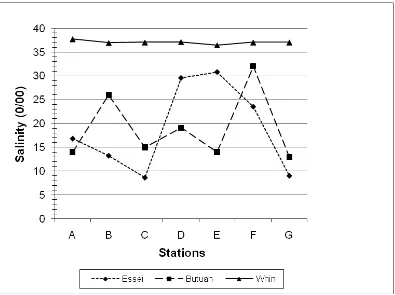
4.2.3 Salinity
Figure 11: Sanity profile of the wetlands
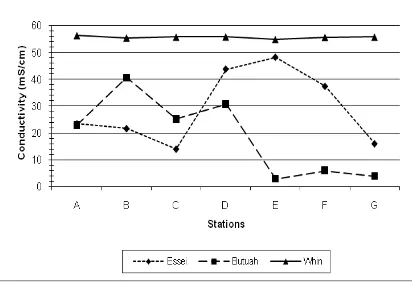
4.2.4 Conductivity
µs/cm. For Essei higher conductivity values were recorded at the middle portions of the lagoon from points D-E, and subsequently dropped sharply to G. Nevertheless, Butuah had the overall least values at 2.97µs/cm (Fig. 12).
Figure 12: Conductivity profile of water bodies
4.2.5 Turbidity
Figure 13: Turbidity profile of the water bodies
4.2.6 pH
7.4 7.5 7.6 7.7 7.8 7.9 8 8.1 8.2 8.3 8.4
A B C D E F G
Stations
pH
Essei Butuah Whin
Figure 14: pH profile of the wetlands
4.3 The Plankton community
Plankton diversity were measured and used as indicators for comparative assessment of the primary productivity of the wetlands to be able to support fish resources.
Phytoplankton
As shown in Tables 4-6, the phytoplankton identified from the three water bodies
includes species of blue-green algae, green algae and diatoms. The blue-green algae
found include Anabaena spp., Oscillatoria spp., Chroococcus sp., Microcystis sp. etc.,
while the green algae were mostly desmids such as Closterium sp. and Scenedesmus sp.,
such as Spirogyra sp.. The most common diatoms present include species of Navicula,
Rhizosolenia, Gyrosigma, Diatoma spp. and Stephanodiscus.
Table 5: List of phytoplankton in Butuah Lagoon in the Sekondi – Takoradi metropolis
PHYTOPLANKTON ABUNDANCE
Blue - green algae
Oscillatoriaspp. ++
Anabaena spp. +++
Lyngbya sp. +++
Spirulina spp. ++
Calothrix sp. ++
Microcystis spp. +++
Chroococcus sp. +++
Aphanizomenon sp. +
Diatoms
Navicula spp. ++
Nitzschia spp. +
Pleurosigma sp. +
Stephanodiscus spp. +
Rhizosoleniaspp. ++
Diatoma spp. ++
Synedra spp. +
Green algae
Staurastrum spp. +
Netriumspp. +
Microspora sp. ++
Scenedesmus sp.
+ + = occurred sparingly
green algae occurred in the Whin Estuary than Essei and Butuah, while Butuah had the
highest number of genera of blue – green algae. There was a high abundance of blue –
green algae than green algae and diatoms in Butuah, and green algae were highly
abundant in Whin. The abundance of diatoms was higher in Essei and Whin than Butuah.
The list of zooplankton identified from the three water bodies is presented in Tables 6-8.
Species of copepods (Calanus sp., Sappharina spp., Cyclops spp., Thermocyclops sp.,
and Copepodite sp.), rotifers (Brachionus sp., Keratella spp., Kellicottia spp., and
Trichocera sp.) and a cladoceran (Bosmina sp.) were the zooplankton encountered. A
total of 10 zooplankton genera were found in Whin, and 7 in each of Essei and Butuah
Lagoon (Table 10). A higher number of genera of copepods and rotifers occurred in
Whin Estuary than Essei and Butuah, while the 1 cladoceran genus occurred in the three
water bodies.
Table 7: List zooplankton in the Essei Lagoon in the Sekondi – Takoradi metropolis
ZOOPLANKTON ABUNDANCE
Copepods
Calanus sp. +
Cyclops spp. ++
Sappharina sp. +
Rotifers
Brachionu ssp. +
Keratellaspp. +++
Kellicottiaspp. ++
Cladocerans
Bosmina sp. ++
ZOOPLANKTON ABUNDANCE +++ = highly abundant
Table 8: List of zooplankton in the Butuah Lagoon in the Sekondi – Takoradi metropolis
Zooplankton Abundance
Copepods
Cyclops spp. ++
Sappharina sp. +
Thermocyclops sp. ++
Copepodite sp. +
Rotifers
Brachionuspp. +
Kellicottiaspp. +++
Cladocerans
Bosmina sp. +
+ = occurred sparingly + + = moderately abundant +++ = highly abundant
Table 9: List of zooplankton in the Whin Estuary in the Sekondi – Takoradi metropolis
ZOOPLANKTON ABUNDANCE
Copepods
Calanus sp. +++
Cyclops spp. +
Sappharina sp. +
Thermocyclops sp. ++
ZOOPLANKTON ABUNDANCE Rotifers
Brachionussp. +++
Keratellaspp. +
Kellicottiaspp. +++
Trichocerasp. ++
Cladocerans
Bosmina sp. +++
+ = occurred sparingly + + = moderately abundant +++ = highly abundant
Table 10: Richness of plankton and zooplankton genera of the three water bodies
4.4 The Benthic macroinvertebrate community
Occurrence, richness and diversity
The benthic communities of the three water bodies included mainly oligochaetes,
polychaetes and insect larvae, with echinoderms, nemertine worms and gastropods
occurring sparingly (Tables 11-13). The polychaetes found belonged to the families
Capitellidae, Nereidae, Cirratulidae, Opheliidae, and Maldanidae while the insect larvae
encountered were dipterans of the families Chironomidae and Ceratopogonidae. The only
gastropod collected was Tympanotonus fuscata of the family Potamididae. Oligochaetes, NUMBER OF GENERA
PHYTOPLANKTON ESSEI BUTUAH WHIN
Blue-green algae 7 8 5
Diatoms 10 7 12
Green 7 4 8
Total 24 19 25
ZOOPLANKTON
Copepods 3 4 5
Rotifers 3 2 4
Cladocerans 1 1 1
capitellid polychaetes and chironomid larvae were present in all three water bodies while
the other macrofauna occurred in one or two of the wetlands.
A total of 7 families of the zoobenthos were collected from Essei, 4 of which were
polychaetes, and 6 families were sampled from Butuah of which 2 were polychaetes
(Table 14). The 5 macrobenthic families present in Whin comprise 2 insect families.
Richness and diversity of benthic invertebrate communities of Essei (d = 1.18, H’
= 1.22) and Butuah (d = 1.09, H’ = 1.21) were very close, with Whin being slightly lower
than the two (d = 0.89, H’ = 1.02) Table 14. However, the distribution of the individuals
among the various benthos groups was somehow even in all the three communities (J’ >
0.6). As shown in Table 15, there was a higher similarity between the Essei and Whin
communities than (Cs > 0.6) than any of the other pairs.
Table 11: List of benthic macroinvertebrates of the Essei Lagoon in the sekondi-Takoradi metropolis
CLASS ORDER FAMILY
OLIGOCHAETA
POLYCHAETA Capitellidae
Nereidae Opheliidae Maldanidae
INSECTA DIPTERA Chironomidae
Table 12: List of benthic macroinvertebrates of the Butuah Lagoon in the sekondi-Takoradi metropolis
CLASS ORDER FAMILY
OLIGOCHAETA
POLYCHAETA Capitellidae
Nereidae Cirratulidae
INSECTA DIPTERA Chironomidae
Ceratopogonidae
GASTROPODA Potamididae
Others
Echinodermata
Table 13: List of benthic macroinvertebrates of the Butuah Lagoon in the sekondi-Takoradi metropolis
CLASS ORDER FAMILY
OLIGOCHAETA
POLYCHAETA Capitellidae
INSECTA DIPTERA Chironomidae
Ceratopogonidae
GASTROPODA Potamididae
Table 14: Richness of benthic invertebrate families of the three water bodies
INVERTEBRATE GROUP
NUMBER OF FAMILIES
ESSEI BUTUAH WHIN
OLIGOCHAETA 1 1 1
POLYCHAETA 4 2 1
INSECTA 1 2 2
GASTROPODA 1
ECHINODERMATA 1
NEMERTEA 1 1
TOTAL 7 7 5
Table 15: Richness and diversity indices for the benthic invertebrate communities of the three water bodies
Water body Margalef‘s Richness (d)
Shannon – Wiener diversity (H’)
Pielou‘s evenness (J’)
Essei 1.18 1.22 0.63
Butuah 1.09 1.21 0.68
Whin 0.89 1.02 0.63
Table 16: Sorensen’s similarity index for pairs of benthos communities of the three water bodies
Essei Butuah Butuah 0.46
Composition of benthic invertebrate fauna
The most common and dominant macrobenthic fauna in all the three wetlands
were Oligochaeta, Capitellidae and Chironomidae (Figure 15). The composition of
Oligochaeta were 17.5 %, 41.3 % 45.3 % in Butuah, Whin and Essei respectively, that of
Capitellidae were 34 %, 27.5 % and 27.3% in Butuah, Whin and Essei respectively, while
Chironomidae made up 31 %, 25.2 % and 23.1 % of the communities in Butuah, Whin
and Essei respectively. Potamidiae constituted 10 % of the Butuah community. The
composition of the other benthic groups varied between 0.5 and 4 % in all the three
wetlands.
Density of benthic invertebrates
In Essei Lagoon, the density of oligochaetes was higher at stations A (367
individuals / m2) and E than the stations in between (< 110 individuals / m2), with the
density at Station E (581 individuals / m2) being the highest. (Figs. 16-18). Capitellid
polychaete density was lower in at Stations A – D (> 100 individuals / m2) but higher at
station E (500 individuals / m2). Similarly, chironomids also had lower densities at
stations A – D (< 56 individuals / m2) and higher at Station E (490 individuals / m2). The
densities of the remaining benthos varied between 0 and 64 individuals / m2 at the various
stations.
Oligochaete density in Butuah Lagoon ranged in density from 56 individuals / m2
(Stations A & E) to 138 individuals / m2 (Station D) while the density of the capitellid
polychaetes varied between 80 individuals / m2 and 100 individuals / m2 at Stations A –
D, 161 individuals / m2 at Station E. Chironomids occurred at Stations D and E and had
densities 89 individuals / m2 and 287 individuals / m2 respectively. The gastropods also
occurred at two Stations (A and B) at densities of 128 individuals / m2 and 56 individuals
/ m2 respectively. The other organisms were less than 90 individuals / m2 and occurred at
1 or two stations.
600
Figure 16: Density of benthic invertebrate groups at five stations in the
300
300
4.5 The Littoral community
Occurrence, richness and diversity
As presented in Table 17-19, the littoral invertebrate communities of the three
water bodies include oligochaetes, polychaetes, insects, gastropods, bivalves and
crustaceans. The polychaetes found belonged to the families Capitellidae, Nereidae,
Cirratulidae and Opheliidae while the insect larvae encountered were dipterans of the
families Chironomidae Aedinae and Ceratopogonidae, and odonatans of family
Coenagriidae. The gastropods collected were from the families Potamididae, Patellidae,
Neritidae, Muricidae and Littorinidae while the bivalve families were Mytilidae,
Ostreidae and Arcidae. Crustaceans present were barnacles Ballanus pallidus, and hermit
crab.
Oligochaeta, Capitellida and Chironomidae were present in all three water bodies
while the gastropods, bivalves and crustaceans were found at only Whin, except
Potamidiae which was also present at Butuah. The other littoral fauna occurred in one or
two of the wetlands. A total of 14 families of littoral macrofauna were collected from
Whin, 8 from Essei and 4 from Butuah (Table 20).
Of the three wetlands, Whin had the most rich and diverse littoral invertebrate
community (d = 2.16, H’ = 2.41) (Table 21). Diversity was same for Butuah and Essei
(H’ = 1.50) although richness differed slightly. Distribution of the individuals among the
various invertebrate groups was highly even in Butuah and Whin (J’ > 0.9) than Essei (J’
= 0.72). The littoral communities of the two lagoons were highly similar (Cs > 0.6), but
Table 17: List of littoral macroinvertebrates of the Essei Lagoon in the Sekondi-Takoradi Metropolis
CLASS ORDER FAMILY
OLIGOCHAETA
POLYCHAETA Capitellidae
Nereidae Cirratulidae
INSECTA DIPTERA Chironomidae
Ceratopogonidae Aedinae
ODONATA Coenagriidae
Table 18: List of littoral macroinvertebrates of the Butuah Lagoon in the sekondi-Takoradi metropolis
Table 19: List of littoral macroinvertebrates of the Whin Estuary in the Sekondi-Takoradi metropolis
CLASS ORDER FAMILY SPECIES
OLIGOCHAETA
POLYCHAETA Capitellidae
Onuphidae
INSECTA DIPTERA Chironomidae
Aedinae
CLASS ORDER FAMILY SPECIES
OLIGOCHAETA
POLYCHAETA Capitellidae
Nereidae
INSECTA DIPTERA Chironomidae
Ceratopogonidae
CLASS ORDER FAMILY SPECIES
GASTROPODA Potamididae Tympanotonusfuscata
Muricidae Thais hemastoma Thais forbesi Neritidae Neritasenegalensis Littorinidae Littorinapunctata
Littorinacingulifera Tectariusgranosus Patellidae Patella safiana
BIVALVIA Mytiliidae Pernaperna
Arciidae Anadarasenelis Ostreidae Crassotreatulipa
CRUSTACEA Balanuspallidus
Hermit crab
Table 20: Richness of littoral invertebrate families of the three water bodies
INVERTEBRATE GROUP
NUMBER OF FAMILIES
ESSEI BUTUAH WHIN
OLIGOCHAETA 1 1 1
POLYCHAETA 3 2
INSECTA 4 2 2
GASTROPODA 1 4
BIVALVIA 3
CRUSTACEA 2
Table 21: Richness and diversity indices for the littoral invertebrate communities of the three water bodies
Water body Margalef‘s Richness
(d)
Shannon – Wiener
diversity (H’)
Pielou‘s evenness (J’)
Essei 1.12 1.50 0.72
Butuah 0.95 1.50 0.93
Whin 2.16 2.41 0.91
Table 22: Sorensen’s similarity index for pairs of littoral invertebrate communities of the three water bodies
Essei Butuah
Butuah 0.61
Whin 0.27 0.31
Composition of littoral invertebrate fauna
The Essei community was dominated by Oligochaeta, Capitellidae and
Chironomidae (19.3 %, 29.2 % and 36.9 % respectively) while the Butuah community
was dominated by Oligochaeta, Chironomidae and Potamididae (Tympanotonus fuscata)
with compositions of 24.2 %, 31.8 % and 21.2 % respectively, with Ceratopogonidae also
constituting 16.6 % (Fig. 19). Whin was dominated by Oligochaeta (18.3 %), Capitellidae
(12.4 %) and Littorinidae (Littorina punctata) (14.2 %). The composition of the other
Figure 19: Percentage composition of littoral invertebrate groups in the three water bodies
Littoral fauna diversity at various stations of the wetlands
In the Essei Lagoon, Station A had the lowest richness and diversity of littoral
fauna (d = 0.42, H’ = 0.35) while Station B had the highest ((d = 1.06, H’ = 01.35) (Fig.
20). Diversity and richness seem uniform at the other stations. Diversity and richness of
the littoral community in Butuah is higher at Stations A (d = 1.21, H’ = 1.39) and C (d =
1.13, H’ = 1.44) than the other stations. The highest richess and diversity of littoral
invertebrates in the Whin Estuary was recorded at Station A (d = 1.64, H’ = 2.09) while
Station B recorded the lowest (d = 0.48, H’ = 0.14). Very little variations occurred among
4.6 The Fish Community Occurrence of fish species
A total of 26 species of shellfishes and finfishes from 18 families comprising
freshwater, brackishwater and marine fishes were collected from the three water bodies
(Table 23-25). The lagoon tilapia Sarotherodon melanotheron, the mudskipper
Periopthalmus barbarus, the sickle fin mullet Liza falcipinnis, the swimcrab Callinectes
amnicola and the land crab Goniopsis cruentata were present in all the three wetlands.
The other species occurred in one or two of the water bodies.
The 8 species recorded from Essei comprised 5 and 3 crabs. The fish community
in Butuah was made up of 14 species, of which 10 were fishes and 4 were crabs. From
Whin, 20 species were collected with 16 being fishes; most of which were marine
species, and the remaining 4 being crabs.
As shown in Table 27, Whin had the most rich and diverse fish community (d =
3.21, H’ = 1.62), followed by Butuah (d = 1.54, H’ = 1.56), with Essei having the least (d
= 0.99, H’ = 1.02). Distribution of the individuals among the various species was more
even in Butuah (J’ = 0.68) than the other two (J’ = 0.57). Like the littoral communities,
the fish communities of the two lagoons were also highly similar (Cs > 0.6), but the
communities were not much similar to the Whin community (Table 28).
Table 23: List of fish species of the Essei Lagoon in the Sekondi – Takoradi Metropolis
Family Species
Mugilidae Liza falcipinnis
Cichlidae Sarotherodonmelanotheron
Serranidae Serranusaccraensis Portunidae Callinectesamnicola* Gecarcinidae Cardiosomaarmatum**
Grapsidae Goniopsiscruentata**
* = Marine crab ** = Land crab
Table 24: List of fish species of the Butuah Lagoon in the Sekondi – Takoradi Metropolis
Family Species
Mugilidae Liza dumerilii
Liza falcipinnis
Mugilbananensis
Mugilcurema
Clupeidae Odaxothrissamento
Cichlidae Oreochromisniloticus
Sarotherodonmelanotheron
Gobiidae Periopthalmusbarbarus
Clariidae Clariasgariepinus
Heterobranchuslongifilis
Portunidae Callinectesamnicola* Gecarcinidae Cardiosomaarmatum**
Grapsidae Goniopsiscruentata**
Sesarmidae Sesarmaharzudii**
Table 25: List of fish species of the Whin Estuary in the Sekondi – Takoradi Metropolis
Family Species
Mugilidae Liza dumerilii
Liza falcipinnis
Mugilbananensis
Mugilcephalus
Mugilcurema
Clupeidae Sardinellamaderensis
Cichlidae Sarotherodonmelanotheron
Gobiidae Bathygobiussoporator
Periopthalmusbarbarus
Acanthuridae Acanthurusmonroviae
Labridae Xyrichthysnovacula
Bothidae Scyaciummicrurum
Haemulidae Plectorhynhusmediterraneus Lutjanidae Lutjanusgoreensis
Eleotridae Eleotrissenegalensis
Gerreidae Eucinostomusmelanopterus
Portunidae Callinectesamnicola*
Ocypodidae Ucatangeri**
Grapsidae Goniopsiscruentata**
Sesarmidae Sesarmaharzudii**
Table 26: Species richness of fish communities of the three water bodies
Water Body No. of
Families
No. of fish
species
No. of crab
species
Total no of
species
Essei 8 5 3 8
Butuah 9 10 4 14
Whin 15 16 4 20
Table 27: Richness and diversity indices for the fish communities of the three water bodies
Water body Margalef‘s Richness
(d)
Shannon – Wiener
diversity (H’)
Pielou‘s evenness
(J’)
Essei 0.99 1.02 0.57
Butuah 1.54 1.56 0.68
Whin 3.21 1.62 0.57
Table 28: Sorensen’s similarity index for pairs of fish communities of the three water bodies
Composition of fish communities
The two main species which dominated the Essei fish community were Periophthalmus barbarus (51.3 %) and Liza falcipinnis (34.3%) while Odaxothrissa mento dominated the Butuah community (49.1 %), followed by Sarotherodon melanotheron (16.3 %) (Fig. 21). The Whin community was dominated by S. melanotheron (26.5 %)and the snapper
Essei Butuah Butuah 0.64
Lutjanus goreensis (Lutjanidae) (13 %). Compositions of the remaining species varied between 0.5 % and 8.5 % in the communities in which they occurred.
Size range of some common species