DESCRIPTION AND ANALYSIS OF THE GAMBIA SOLE STOCK
ASSESSMENT 2013
2
The work herein was supported by the USAID funded Gambia-Senegal Sustainable Fisheries Project (BaNafaa). The BaNafaa project is implemented by the Coastal Resources Center of the University of Rhode Island and the World Wide Fund for Nature-West Africa Marine Program Office (WWF-WAMPO) in partnership with the Department of Fisheries and the Ministry of Fisheries and Water Resources. Data collected by the Gibril Gabis and Geoffrey Kibler from the USAID/BaNaffa project. Analysis conducted by Amadou Jallow and Salifu Ceesay and from The Gambian Department of Fisheries and Kathleen Castro from the University of Rhode Island.
Citation: Jallow, A Cessay, S. and K. Castro. 2013.Description and analysis of the Gambia sole stock assessment- 2013. pp 8
Disclaimer: This report was made possible by the generous support of the American people through the United States Agency for International Development (USAID). The contents are the responsibility of the authors and do not necessarily reflect the views of USAID or the United States Government. Cooperative Agreement # 624-A-00-09- 00033-00.
Cover Photo: USAID/BaNafaa project/World Wide Fund for Nature-West Africa Marine Program Office (WWF-WAMPO).
3
Table of Contents
INTRODUCTION ... 4
LENGTH WEIGHT RELATIONSHIP ... 4
ESTIMATION OF THE LEVEL OF EXPLOITATION ... 4
REFERENCE POINTS ... 6
SUMMARY, CONCLUSION AND RECOMMENDATIONS ... 7
REFERENCES ... 8
List of Figures
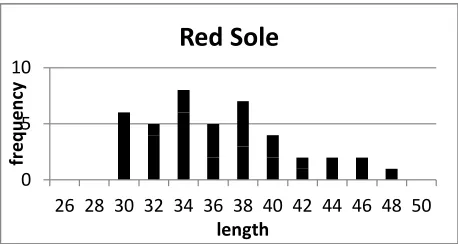
Figure 1: Length frequency of Red sole ... 4Figure 2: Length frequency of Black sole ... 4
Figure 3: Results of LCCA for red sole... 5
Figure 4: Results of LCCA for black sole ... 5
Figure 5: Reference points for red sole. Fmax = 0.87 and F30% = 0.51. ... 6
4
INTRODUCTION
This report presents the stock assessment of the Gambian sole fishery for 2013. Although several species of sole fish are reported to inhabit the coastal waters of the Gambia, two species
predominate the catch and landings: Red sole (Cynoglossus senegalensis) and Black sole
(Synaptura cadenati). The purpose of this report is to summarize what is known for the resource in the Gambia in 2013.
LENGTH WEIGHT RELATIONSHIP
The parameters used for the length weight relationship were from the last stock assessment (Ceesay et al., 2012.
Table 1: Parameter values for Red and Black sole using non-linear methods
ESTIMATION OF THE LEVEL OF EXPLOITATION
For this analysis the only data available was from a research project conducted in May-June 2013. A total of 84 Black sole and 41 Red sole were captured (Figures 1 and 2). Using a length converted catch curve, F was obtained and compared that a reference point. Reference points from the 2012 analyses were used.
5
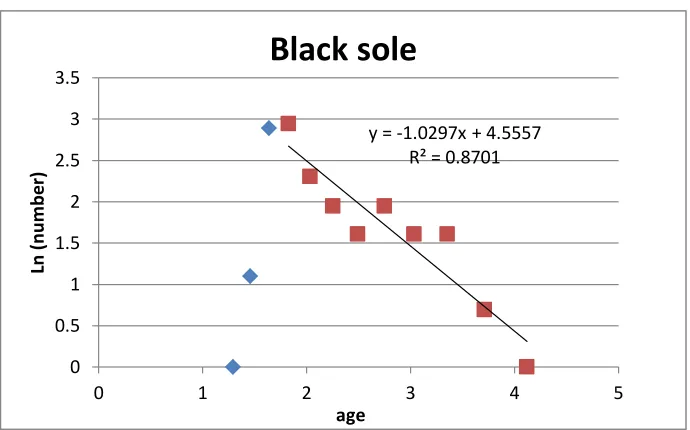
The Length-based Catch Curve Analysis (LCCA) was conducted on length frequency
distribution. The lengths of the fish length were converted to mean age using a von Bertalanffy growth equation, using a specific value of Linf and K, the growth coefficient. To determine the total mortality (Z), the natural log of the numbers captured was plotted versus the estimated age at mean length.
The natural log of numbers captured was plotted versus the estimated age at mean length; the regression slope was estimated on fish which were fully recruited to fishery.
Figure 3: Results of LCCA for red sole
Figure 4: Results of LCCA for black sole
6
The results of the length-based Catch Curve Analysis of the red and black sole indicated that the slope of the linear regression of the natural log of numbers versus the age, the total mortality was 1.15 for red sole and 1.03 for black sole.
Using the value for M=0.4, F is calculated as: Red sole = 0.75 and black sole 0.63. This analysis was based on the following parameters for the life history characteristics: Linf= 65 cm, K= 0.35 and M= 0.4 for red sole and Linf= 55 cm, k=0.35 and M=0.4 for black sole.
REFERENCE POINTS
Using the estimates of M= 0.4 and a larger Linf for red sole, the new YPR and SSBPR reference points are shown below (Figures 3 and 4). F30% and F 20% were estimated for comparison purposes.
7
Figure 6: Reference points for black sole. Fmax=0.61 and F30%=0.46.
SUMMARY, CONCLUSION AND RECOMMENDATIONS
The following results indicate levels of overfishing for the Gambian sole using new life history parameters.
Species F
calculated
F max F30% F20% Conclusion
Red sole 0.75 0.87 0.51 0.80 Recruitment overfishing; no growth overfishing Black
sole
0.63 0.61 0.46 0.68 Both recruitment and growth overfishing
Based on these results, it is recommended that fishing mortality be reduced, so that the stock can begin to recover. To reduce fishing mortality the following measures are recommended:
• Mesh size control: Larger mesh sizes need to be used to reduce catch of small fish.
• Fishing effort must be reduced: this can be achieved through limiting the number of fishing days, nets or fishing boats.
• Closed season or closed areas should continue.
8
REFERENCES
Cessay, S., Jallow, A.,Sanyang, L, Parkins, C and K. Castro. 2013. Description and analysis of the Gambia sole stock assessment- 2012. Coastal Resources Center. University of Rhode Island.
DeAlteris, J. Cessay, S. and A. Jallow. 2012. Final report: the Gambian Sole Stock Assessment. CRC, URI. Pps 20.