The Study of Visitor’s Saisfacion at Gunung Kidul Regency
Tourist Desinaions:
An Applicaion of Holiday Saisfacion (HOLSAT) Model
Popi Irawan
Universitas Gadjah Mada Email: [email protected]AbSTRAcT
This study focuses its analysis on tourist satisfactions in various tourist destinations in the area of Gunung Kidul Regency of Yogyakarta Special Region. Analysis on tourist satisfaction in this
research utilizes the Holiday Satisfaction (HOLSAT) model, irst proposed by Tribe and Snaith. Its primary principle in evaluating tourist satisfactions is determined by comparing tourist perceptions
on their holiday activities prior to doing activities (expectation) and after (experience) they do the activities. Survey is the primary research method applied in this study, in which questionnaire is
designed based on the HOLSAT model itself. Analyses reveal that as a new, developing tourist
destination in Yogyakarta, the tourist holiday satisfaction level in various tourist attractions in the area
of Gunung Kidul Regency is notably high for attraction attributes. The average mean of expectation and experience using the HOLSAT model in this research shows that attributes categorized as attraction and activities components are those that are highly perceived by the respondents. This means that in these two elements the tourists are satisied. On the other hand, attributes categorized in accessibilities and amenities components receive the least score by the respondents, which means that the tourist are not satisied in these items.
Key words: holiday satisfaction, tourists, HOLSAT model, expectation, experience.
InTRODucTIOn
Yogyakarta Special Region, shortened as Yogyakarta, is a provincial region rich in tourist attractions, where cultural tourist spots and events have long been the primary attraction for tourists. Following the trend, the provision of accommodation facilities has substantially increased to 26% for room availability in the period of 2009 – 2013 or from 3,510 to 4,743 (Yogyakarta Ofice of Tourism, 2014). The number of tourists visiting the province has also been recorded to reach 2,837,967 in 2013, increasing up to 16.8% from the previous year of about 2,360,172 (Yogyakarta Ofice of Tourism, 2014).
under 3.0, and this situation has occurred for years (Yogyakarta Ofice of Tourism, 2014). It is obvious that the length of stay is one of indicators of tourism development in a region.
The regency of Gunung Kidul, geographically largest regency in Yogyakarta, has gained its new popularity as a tourist destination in the last ive years. White sandy beaches stretching along its southern coast are main attraction, and have become new coastal tourist spots, besides those beaches located in neighboring regency of Bantul, where the previously most popular beach of Parangtritis is located. In addition to beaches, the regency has also other natural attractions that are not found in other regencies like caves. They are new natural tourist spots in Gunung Kidul, popular among local visitors. Some of these caves are Pidul and Jomblang caves. In addition to caves, it also has a huge natural volcanic remnant known as Nglanggeran Ancient Volcano, a range of hills formatted from ancient volcanic activities.
In 2013, the number of tourist visits to Gunung Kidul Regency was recorded up to 1,822,250 people, or increasing for 76.5% from 2008, which was about 427,071 (Yogyakarta Ofice of Tourism, 2004). This signiicant increase was partly caused by the development of new attractions that are gaining popularity among other attractions that have been promoted before in such regencies as Bantul, Sleman, and Yogyakarta municipalities. This phenomenon could be a sign that the regency of Gunung Kidul has great tourist attraction potentials to be further developed in the future as alternative destination to existing attraction available in other regencies. Another impact to be clearly noted is that this situation can be a great opportunity for the regency to make its people more prosperous by optimizing tourism-related activities and businesses as one of its economic sectors.
Further, the study of visitors has played a vital role in that they are the so-called ‘end user’ of a tourism product development. Their level of satisfaction and perception towards particular tourism product they consume revealed in a systematic study could be used as a reference for a better planning. In addition, it is also a useful tool for mapping the market segmentation of a particular destination. Once a market segment
is determined, a more focused planning can be arranged for overall tourism development.
Compared to other, neighboring regencies, Gunung Kidul, as a tourist destination, has a number of limitations, particularly in the provision of infrastructure and systematic and targeted marketing efforts. However, the local bureau of statistics revealed that tourist visits to the region creased substantially to 70% for the period of 2008 to 2015 (Yogyakarta Ofice of Tourism, 2014). This is an undeniable evidence that this regency is gaining its popularity as a tourist destination. For this reason, therefore, this research is focused to answer the following questions: First, by utilizing
the Holiday Satisfaction (HOLSAT) model, how is the level of satisfaction of tourist who visit attractions in Gunung Kidul regency? Second, how is the tourist market segmentation for destinations in the regency?
To begin with, it is important to trace and review previous studies related to the subject matter of this research. In their study on “Tourist Market Analysis of Yogyakarta Municipality in 2008” (Yogyakarta Municipality Ofice of Tourism, Arts and Culture & Center for Tourism Studies, Universitas Gadjah Mada, 2008), it is revealed that there are several characteristics of tourist market of Yogyakarta:
a. tourists visiting Yogyakarta were those who repeat their visit
b. information on destinations in Yogyakarta was mainly obtained from colleague and relatives c. their visit to the city was self-arranged, and not
by a travel agent
d. there was a difference on the expenditure per day of domestic and international visitors, in which local tourists spent approximately Rp 500,000 while the foreign tourists spent around US $ 26 – 50 and above US $ 100
e. average length of stay was relatively low, which was only 1 – 3 days
f. they positively perceived cultural attractions, and negatively perceived night entertainment attraction, such as night clubs and cafés g. generally the they complained on order and
cleanliness in the destinations they visit h. Yogyakarta was the main destination, and they
Additionally, the study of special interest tourism has also been a consideration in this research with regards to the fact that destinations in Gunung Kidul Regency are categorized mainly as special interest attractions (Yogyakarta Ofice of Tourism & Center for Tourism Studies, Universitas Gadjah Mada, 1998).
In addition, studies upon special interest tourism are also taken into account in this research, regarding that the tourisms’ potential and attractiveness in Gunung Kidul Regency are more focused on the attractiveness of this special interest tourism. In a research on the development of special interest tourism (Yogyakarta Ofice of Tourism & Center for Tourism Studies, Universitas Gadjah Mada, 1998), it is revealed that the potential of special interest tourism in Gunung Kidul Regency could be categorized into three groups, namely the developed special interest tourism attractions, the developing one, and the potential attractions. The developed special interest tourism object is, for instance, Wanagama Forest, and the developing special interest tourism objects are Sundak Beach and Goa Seropan. With regards to recent tourism development in Gunung Kidul Regency, it is obvious that the potential of the special interest tourism object is increasing and has more varied attraction choices for the visitors.
The potential and the various kinds of special interest tourism objects offered by Gunung Kidul Regency need to be designed in an attractive tourism package which suits the targeted market. In a research report entitled “The Arrangements of Special Interest Tourism Package in Yogyakarta” (Yogyakarta Ofice of Tourism, 2009), it is suggested that special interest tourism should be arranged in more varied packages, which can be in the form of general and special retail tourism packages focusing on the objects around Yogyakarta Palace and karst area in Gunung Kidul Regency. The result of this study recommends segmentation and targeting tourism market in the form of nature and cultural tourism package which is targeted to the local tourists, and cultural tourism package targeted to the foreign tourists.
Meanwhile, in the context of the study of satisfaction—as well as dissatisfaction—among the tourists, it is important to note what Alegre and Garau (2010) has found in their article entitled
“Tourist Satisfaction and Dissatisfaction”. Their study suggests that some tourists’ disappointments or dissatisfaction, which are expressed into a negative judgment upon a research variable, must be evaluated further and be placed in a particular evaluation context. This research traces the relation between the evaluation of satisfaction-dissatisfaction in tourism and the urge to revisit particular objects. The result of the study indicates to restructure the survey method that has been used to measure the tourists’ satisfaction-dissatisfaction level.
In order to answer the research questions, it is also important to analyze a number of criteria such as the tourists’ proile and satisfaction as well as the evaluation model of the tourists’ satisfaction in tourism more theoretically. In the discourse of tourism satisfaction, the focus of study on the tourists plays an essential role concerning that tourists’ behavior in buying the tourism products has also become an important part in the study about the tourists’ behavior. Attitudes of tourists in their purchases on tourism-related products and packages have been the center of the study of tourist behavior. Tourism market segmentation is, therefore, determined by the characteristics and the typology of the tourists. The different proile among the tourists also inluences the management and the development of a tourism destination. According to Mill and Morrison (2009), the segmentation of tourism market based on the tourists’ proile include: the social-economic variables, demographic variables, and the variables that are correlated to products, geographic variable, and psychographic ones.
Based socio-economic and demographic variable, for instance, it includes age, gender, salary, the amount of the family, social status, house ownership, and job. Variables related to products are among the kinds of tool and equipment used, the loyalty to a brand, the beneit expectation, and the length of stay. Meanwhile, the geographic variable involves the place of origin, the category of the place of origin (village, city, sub-urban), and the population density.
characteristics. According to Plog, the tourists can be divided into ive large groups, those are: psychocentric, near psychocentric, mid-centric, near allocentric, and allocentric. Psychocentric is a kind of ‘conservative’ tourists who tend to visit popular destination, which guarantees its security and comfort, and who tend to revisit the similar destination (Cooper et al, 1998). In this case, the term ‘conservative’ means that the tourists who are included in psychocentric are more preferable in hiring tourism agent while they are on trip, and also does not prefer exploring undeveloped tourism destinations. The adventure and challenging aspects no longer become their priority.
On the other hand, allocentric tourist is a typology of tourists who prefer doing non-conventional trip to more challenging destinations, which enable them to experience the more adventurous aspects compared to the conventional destinations. They are motivated to visit new tourism destinations, and rarely visit a similar destination more than once. If it is possible, even they tend to avoid to hire travel agents during their trips.
A study of satisfaction and dissatisfaction has become one research attentions in many levels, including the experts in tourism. Satisfaction levels of tourists in doing their activities in a destination—which actually means buying the tourism products—highly determines the desire to revisit it in the future. This is substantially inluenced by the judgment of the tourists upon the attributes owned by the tourism object they visited (Alegre and Garau, 2010). This has made satisfaction levels of the tourists to have direct connection to the destination image. In the case of business, the high level of customer satisfaction will contribute to the improvement of customer loyalty, the decreasing of price elasticity, and the addition of targeted market (Song et al, 2012). Similarly, in tourism it is expected that this will inluence the destination image, increasing the number of the length of stay, as well as to inluence visitors to revisit the destination in the future.
Oliver (1997, cited by Moital et al, 2013) deines satisfaction as an evaluation of a consumption event or its constituent parts. A study about customer’s satisfaction involves two important aspects, namely how the judgment of
satisfaction formulated, and what components are evaluated (Moital et al, 2013). The judgment over satisfaction is determined by understanding the customer’s psychological process in determining and evaluating a buying experience. As for what elements are evaluated in the determination of satisfaction level is correlated with the formulated value as the most inluential variable in determining the tourists’ satisfaction level. It can be in the form of functional value, emotional value, overall value, as well as social and novelty values (Moital et al, 2013).
Studies about tourists and their behavior while they are on trip are always interesting to be discussed further. The satisfaction level in tourism has also become one particular object of study. The Holiday Satisfaction (HOLSAT) model, which is developed by Tribe and Snaith in 1998, is one among the important contributions in tourism satisfaction study (Truong and Gebbie, 2007). This HOLSAT model is developed by investigating the tourists’ expectation prior to doing activities at a destination and comparing it with their satisfaction level after inishing their tour.
population and sample population. The targeted population in this research was the entire amount of tourists visiting all tourism destinations in Gunung Kidul Regency in 2012, which was recorded up to 1.279.065 people. The targeted population has the characteristics that tends to be homogeneous, except for the foreign tourists. On the other hand, the sample frame population was taken from the data of some visits in several tourism destination in Gunung Kidul Regency. Tourists visits to tourism destination as a population was classiied into three groups, those are nature, cultural, and man-made attractions. The data were taken from those three groups of destinations.
Samples of this research, on the other hand, were determined by using particular method, which is non-probability sampling technique. This method implies that the probability of someone to be a respondent is different (Effendi and Singarimbun Ed., 2006). Speciically the
non-probability sampling technique used in this study is purposive sampling technique, a method of taking samples customizing the objectives of the research (Kusmayadi and Sugiarto, 2000). The total samples in this research were determined by a formula developed by Slovin (Kusmayadi and Sugiarto, 2000). With the determined population and the method of determining sample which is not random by using Slovin’s formula, it was therefore obtained 156 amount of samples. The questionnaires were then spread out to those number of respondents to be illed.
The Structure and Design of the
Quesionnaire
The research questionnaire was designed by focusing on questions or statements into three attributes, those were attraction attribute, activity, accessibility, and amenity (abbreviated as the ‘4As’). This is in line with what Cooper et al
(1998) mentioned as the basic requirement of an attraction and tourism destination. The irst part of questionnaire was designed to reveal the respondents’ socio-demographic and their trip characteristics. These data would be the fundamental interpretation and the proile determination as well as the tourists’ market segmentation in Gunung Kidul regency.
The second part contains questions or statements of the ‘4As’ variables which were arranged randomly. The research questionnaire consists of positive and negative statements, which were also randomly arranged. The random arrangement of the statements is the essential part of HOLSAT instrument (Truong and Gebbie, 2007). The questions in questionnaire were classiied into two groups: questions related to expectations and reality experienced by the respondents. The testing and the determination of satisfaction level were counted based on the mean (X) of the expectation score subtracted by the mean (X) of the reality score as an important part in deining the satisfaction in HOLSAT model (Tribe and Snaith, 1998). Respondents illed up the questions and statements of the questionnaire in 5-range Likert scale (Effendi and Singarimbun
Ed, 2006).
Data Analysis
The obtained data in this research was classiied according to its importance level. The result of questionnaires was recapitulated in tables and matrix, which is, then, interpreted to reveal the satisfaction level of the respondents during the tour. By using HOLSAT model the data were classiied to ind out its expectation score and the tourists experience for each variables in tables and matrix. As explained in the previous section, the tour satisfaction level was counted from the result of the questionnaire (part B) by comparing the mean of expectation and reality or experience scores. These scores were obtained by giving numbers to each category of the respondents’ answer, each with range 5 to 1 for answer of these categories: ‘completely agree’, ‘agree’, ‘neutral’, ‘disagree’, and completely disagree (Likert scale). To deine the tourists proile and the interpretation of tourism market segmentation, the result of questionnaire in part A is presented in the form of table and/or chart.
ReSuLTS AnD DIScuSSIOn
the data found in the ield and interpretation of questionnaire result that had been illed by respondents. In the irst section, the data are interpreted from questionnaire recapitulation result that shows tourist satisfaction result. The next section shows local tourists’ proile and market segmentation prediction of tourists in the observed area.
Tourist Saisfacion of HOLSAT Model
Summary
The research shows that as a newly developed and recently known tourist destination, especially among local tourists, the satisfaction level is relatively high for attraction attributes (tourist attraction). Each of those attractions is perceived
No Statement
Expectation Experience
Expectation-Experience
X SD n X SD n
1 The tourist attraction is unique compared to other
attractions in the area 3.99 0.84 153 4.04 0.78 155 -0.05
2 The weather in the tourist attraction is clement 3.99 0.86 157 3.94 0.82 157 0.05
3 I can relax at the tourist attraction 4.43 0.88 141 4.12 0.72 154 0.31
4 The price of food, beverages, and souvenirs in
the tourist attraction is fair 3.47 0.94 158 3.63 0.86 156 -0.16
5 These tourist attraction is secure from crime 4.03 0.88 154 3.54 0.75 157 0.49
6 Sport activities can be done at this tourist
attraction 3.54 0.91 153 3.54 0.92 154 0.00
7 Traditional art performances are provided in this
tourist attraction 2.84 0.89 150 2.75 0.99 157 0.09
8 Tour activity comply with the safety standards 3.88 0.86 157 3.81 0.63 157 0.07
9 This tourist attraction can be easily found and
visited 3.78 0.93 155 3.64 0.88 154 0.14
10 Access to this tourist attraction is reined 3.83 0.93 157 3.69 0.96 159 0.14
11 Large parking lot can be easily found 3.76 0.87 153 3.79 0.84 154 -0.03
12 Local/street food with affordable price can be
easily found 3.37 0.99 156 3.29 0.82 154 0.08
13 Public facilities can be easily found 3.67 0.91 155 3.74 0.82 153 -0.07
14 Rental place that supports my tour activity can be
easily found 3.53 0.92 157 3.46 0.87 153 0.07
15 Interaction with friendly local people can be done 3.67 0.84 155 3.69 0.88 150 -0.02
16 Souvenir shops with affordable price can be
easily found 4.14 0.86 155 3.14 0.89 150 1.00
17 I expect to see beautiful scenery in this tourist
attraction 4.33 0.88 156 4.15 0.75 145 0.18
Table 1
well by the tourists, especially for natural tourism that includes beaches, cave tours, and adventures.
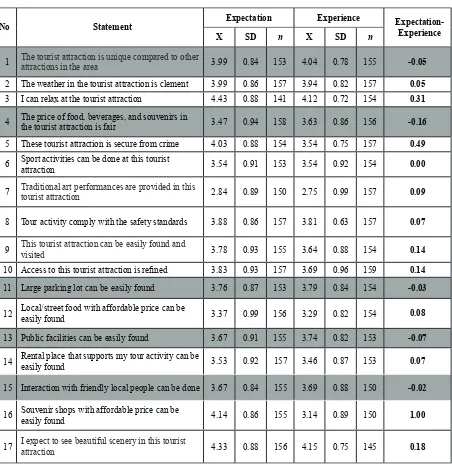
Table 1 and 2 above show a summary of questionnaire recapitulation result that reveals tourist satisfaction level using HOLSAT model:
Table 1 and 2 above summarize research questionnaire recapitulation results that are used to reveal tourist satisfaction levels. Table 1 is a summary of tourist satisfaction level result for the positive attributes, while Table 2 is the result of recapitulation over negative attributes (statements). The interpretations of the tables are explained as follows:
• For positive attributes: if the score differences between mean of expectation and experience are negative, then the attributes will also be considered as negative attributes by tourists. This means there is no satisfaction of local tourists during their activities. Instead, if the score differences between mean of expectation and experience are positive, it means tourist satisfaction level during tour is reached. • For negative attributes, it applies vice versa.
If the score differences between mean of expectation and experience are negative, there is an increase of tourist satisfaction level. However, if the score differences between mean of expectation and experience are positive, there is a decrease in the satisfaction level.
a) Positive Attributes
Table 1 indicates the overall assessment of the positive attributes on the HOLSAT model as a result of research questionnaire recapitulation. In this table, the shaded rows indicate that attributes with score difference of expectations and experience is negative, which means there is no any satisfaction on the attributes assessed. As already explained in the positive attributes assessment criteria above, there are some attributes which gets negative average mean, while the majority of other attributes are negative.
Positive attributes number 1, 4, 11, 13, and 15 are negative, and the remaining are positive. The difference between average score of expectation and experience on attribute number 1, the uniqueness of tourism attraction being visited compared to other attractions, show the negative score (-0.05), which means that the respondents perceive this attribute negatively. This signiies that in terms of uniqueness of the tourist attraction, there is no any increasing satisfaction. Local tourists perceived the uniqueness of the attraction lower than their expectations prior to their visit to the destinations in the observed research area.
Another attribute shown in Table 1 is number 4, the attribute associated with the price in tourist attraction, which is also negative (-0.16). This also means that local tourists perceive the price in the
No Statement Expectation Experience
Expectation-Experience
X SD N X SD N
1 This tourist attraction is dirty 2.96 1.05 157 2.97 0.94 156 0.01
2 This tourist attraction is full of tourists 3.97 0.95 156 3.91 0.86 153 -0.06
3 Public transportations heading to the tourist
attraction are hard to ind 3.4 1.05 156 3.39 0.98 154 -0.01
4 Public facilities such as restroom and toilet are
dirty 2.97 0.92 153 3.11 0.96 157 0.14
5 The quality of restaurants or food stalls is low 3.15 0.78 156 3.09 0.79 153 -0.06
6 There are many disturbing street vendors 2.89 0.89 155 2.67 0.92 153 - 0.22
Table 2
tourist attractions they visit is not in line with their expectations. Their perception to price that they have to pay is not clariied after they have inished doing activities in the destination. For price attribute, therefore, tourists’ expectations do not correspond to reality they have experienced in the tourist attraction, which indicates dissatisfaction to price variable.
In one of the most famous tourist spots in Gunung Kidul, Pindul Cave, sophisticated, hard competition among providers of tourist services has led to unreasonable price. This has been perceived negatively by respondents. Similar things happen in several beaches located in one line. Tourists who want to visit the beaches should pay a single tariff to visit all 10 beaches. However, if they only want to visit one or two beaches, they are still required to pay for all beaches fee entry. This also affects the perception of tourists to price variable.
Another example is attribute number 11 on the availability of parking space. The majority of tourists who visit Gunung Kidul are domestic tourists who come by private or rental vehicle. Availability of parking spaces becomes an important concern. Based on the results of the study, respondents perceive availability of parking area with negative (-0.03), which can be interpreted that for this attribute tourists feel dissatisied. This should be a concern for local governments to pay more attention on the availability of suficient parking space.
Similar thing also applies to attribute numbers 13 and 15 on the availability of amenity and interaction with local residents. Both of these attributes show negative scores (-0.07 and -0.02 respectively), which indicate dissatisfaction. Adequate available amenity is indeed still an important issue in the development of tourism in the region. As a popular destination in the province, it has a quite high attraction quality for visitors. However, the availability of infrastructures, facilities and amenities in this region is still inadequate.
b) Negative Attributes
In contrast to the positive attributes, a negative attribute is interpreted in a different way, that is, if the difference of the experience and expectation average (mean) is negative, it is concluded that
tourists are satisied with the variables assessed. Otherwise, if the score showed a negative number, then the tourists perceive their satisfaction in the tour.
In Table 2, the attribute number 1 and 4 on tourist attraction cleanliness, the mean (X) difference value on experience and expectation are positive (0.01). This indicates that tourists are satisied with the attributes assessed. In attribute number 1, the difference score of experience and expectation is 0.01 which can be interpreted that the majority of respondents perceive cleanliness in the tourist attractions are relatively well. A positive score indicates dissatisfaction with the attributes assessed. Since this attribute is negative attribute (‘This tourist attraction is dirty’), the positive value (X = 0:01) indicates the opposite, namely that ‘This tourist attraction is clean’.
Similar thing also applies to attribute number 4 on the cleanliness of the restroom in the tourist attraction. The result of HOLSAT analysis shows that the substitution average (mean) of experience and expectation is positive value (X = 0.14), which is equal to dissatisfaction of the attributes assessed. Therefore, the attribute number 4 stating that ‘Public facilities such as restroom and toilet are dirty ‘ is interpreted conversely, in which the respondents perceive that ‘Public facilities, such as restroom and toilet are clean’. Apart from the imperfect amenity (e.g. parking lots, restrooms, toilets and signposts to the tourist attractions), perception of tourists toward the cleanliness of tourist attractions and amenity provided is still relatively ine.
number 6 (disturbing street vendors) with negative scores (-0.06; -0.01 ; -0.06; and -0.22 respectively). Assessments to the three attributes, therefore, indicate satisfaction.
Tourists’ Proile
This part indicates the recapitulation result of the research’s questionnairewhich portrays the tourists’ proile, who visited the tourism objects in Gunung Kidul regency. This proile is displayed in the following chart:
Chart 1 Respondents’ Gender
Chart 1 shows the gender of the respondents, which is mostly male (55%). Some tourism objects in Gunung Kidul are quite popular among male tourists because of its adventurous activities.
Chart 2 Respondents’ Age
Chart 2 shows the age of the respondents, which is mostly dominated by youngsters from 15 to 25 years old. Tourism destination in the
observed area are more popular among the young tourists. This is probably because most of tourism objects in Gunung Kidul are adventurous, such as beach with high waves and cave tubing activities.
Chart 3 Place of Origin
Chart 3 shows that majority of the tourists is still dominated by tourists from the Island of Java. The number of tourists who come from outside Java is relatively small, only 5% from the total respondents. It can be concluded that the popularity of tourism destinations in Gunung Kidul is still around Java. In the future, promoting the regency as a tourism destination in Yogyakarta to outside Java and abroad must be carried on in order to develop the market potential.
Chart 4 Occupations
are indeed well known among the young tourists which are dominated by students. This fact is possibly caused by the popularity of Yogyakarta, the nearest tourism center to Gunung Kidul, as the city of students.
Chart 5
Income (in Million Rupiah)
Meanwhile, chart 5 displays that the respondents who have income in range of Rp 1 – 3 million hit the percentage by 47% followed by the respondents with income of Rp 5 – 8 million (29%). If it is connected with the respondents’ job, it can be assumed that most respondents are students who has income rate Rp 1-3 million, followed by respondents who already have jobs with income rate of Rp 5-8 million. Seen from the tourists’ job proile, the regency is very potential to be developed by targeting to average income tourism market.
Chart 6 Education
Along with respondents’ proile in age, job, and income categories, Chart 6 explains the education level of the research’s respondents
which is dominated by the undergraduate students or graduated students by 55%. This education also inluences the characteristic of tourism journey which tends to be more adventurous and challenging. This is correlated with the types of tourism objects in the destinations, which are adventurous and more preferred by youngsters, educated, and average income tourists.
Chart 7
Source of Information on Destinations
Meanwhile, the source of information about tourism objects which the tourists got is mostly from their colleagues and/or relatives with 75% in percentage, followed by electronic media (television, internet, and ilm) as the information sources by 19%. This can be assumed that the most effective promotion is by ‘word of mouth’. In fact, the local government has not conducted a well-planned promotion regarding to the tourism objects. The popularity of tourism objects such as Pindul Cave is due to by the intensive report of the mass media, both electronic and printed. These media reports are the ones which increase the popularity of the regency as a potential destination in the Special Region of Yogyakarta.
Chart 8
As seen from its accessibility, most respondents mentioned that the types of transportation which they used to access tourism objects in Gunung Kidul Regency are dominated by private transportation (61%) and rented transportation (32%). This result is possible since the public transport facilities to the tourism objects is still limited. Developing the public transport facilities to the tourism objects is one of the local government’s uninished responsibility, which needs to be solved immediately.
Chart 9 Travel Intensity
Chart 9 shows the travelling intensity of research’s respondents. Approximately 45% respondents said that they have never visited the tourism objects in Gunung Kidul, and 25% mentioned that they have visited the destinations at least once. This can be assumed that majority the tourists are the people who have ever visited the tourism objects at most once. This also means that destinations in the region are still developing and popular among tourists. Maintaining the satisfaction and good impression of the tourists becomes important things to the local government.
Chart 10
Number of Companion in Travel
In this research, it is revealed that in visiting tourist destinations, the respondents came in small and large group. There is only 1% of the respondents who visited destinations alone. This fact can be taken as a base to improve the tourism in the future. Arranging tourism packages with travel agents can also be an option to improve it, considering the travelling characteristics which is more likely to be in group.
cOncLuSIOn
The customer satisfaction, a concept which is widely known in economics and business study, can actually be applied to review the travelling satisfaction. In this research, the travelling satisfaction survey is conducted by using Holiday Satisfaction (HOLSAT) approach which was developed by Tribe and Snaith (1998). This method is claimed by the developer to be better and lexible rather than the similar approaches such as SERVQUAL or SERVPERF.
The result of HOLSAT approach in revealing the travelling satisfaction of tourists in destinations in Gunung Kidul Regency shows that generally the tourists feels satisied with the activities, attractions, accessibility, and amenity which are offered in the region. The result of mean of expectation and experience by using HOLSAT approach in this research reveals that the attraction component and activities are perceived to be the best elements and have resulted in satisfaction for the visitors. Meanwhile, accessibility and amenity are two components which frequently get low grade, which means the tourist get minimum satisfaction for these components.
Meanwhile, tourists’ proile which are revealed in this research can be used as a base in mapping the tourism market segmentation of Gunung Kidul Regency. Facts which are brought
up in this research can also contribute to a better marketing planning as the means of improving the tourists visit. Adventurous activities, supported by beautiful landscape, and varied attractions, the popularity of the destinations for youngsters, active, average class, and educated tourists are things which can be the base of planning the development of tourism market.
in Gunung Kidul Regency, and in Yogyakarta as a whole. This research has not covered the tourists’ segmentation picture in more speciic details such as group tourists and individual tourists also how the satisfaction level differs among those different group of tourists. This research also still generalizes satisfaction as something which can be evaluated in all destinations by neglecting the complex travelling motivation aspects. Thus, the following researches are likely needed in order to reveal the tourism satisfaction complexity in a tourist destination.
AcKnOwLeDGeMenT
The writer would like to express his sincere gratitude to the Dean of the Faculty of Cultural Sciences, Universitas Gadjah Mada, for the grant provided to him for a ield research in the regency of Gunung Kidul, Yogyakarta, for the period of April to November 2014.
ReFeRenceS
Alegre, Joaquin & Garau, Jaume (2010). “Tourist
Satisfaction and Dissatisfaction”. Annals of Tourism Research. Vol. 37 No. 1 52-73.
Elsevier Ltd.
Cooper, Chris., Fletcher, John., Gilbert, David., Shepherd, Rebecca., & Wanhill, Stephen
(1998). Tourism Principles and Practice.
Essex: Prentice Hall.
Ecthner, Charlotte M. & J.R. Brent Ritchie (2003). “The
Meaning and Measurement of Destination
Image” dalam The Journal of Tourism Studies
Vol. 14 (1).
Gunn, C. (1988). Vacationscapes: Designing Tourist Regions. New York: Van Nostrand Reinhold. Kusmayadi & Endar Sugiarto (2000). Metodologi
Penelitian dalam Bidang Kepariwisataan.
Jakarta: Gramedia Pustaka Utama. Mill, Robert Christie & Alastair Morrison (2009). The
Tourism System. Dubuque: Kendall Hunt
Publishing Company.
Moital, Miguel., Dias, Nuno Ricardo., Machado, Danielle FC. (2013). “A Cross National Study of Golf Tourist Satisfaction”. Journal of Destination Marketing and Management. Vol.
2 Issue 1 39-45. Elsevier Ltd.
Song, H, van der Veen, R, Li, G and Chen, JL. (2012). “The Hong Kong Tourist Satisfaction Index”.
Annals of Tourism Research. Vol. 39 No. 1. Great Britain: Elsevier Ltd.
Tribe, John. & Snaith, Tim (1998). “From SERVQUAL
to HOLSAT: Holiday Satisfaction in Varadero,
Cuba”. Tourism Management Vol. 19 No. 1
pp 25-34. Great Britain: Elsevier Science Ltd. Truong, Thuy-Huong & Gebbie, Peter John (2007).
“Market Segmentation of Australian Tourists in Vietnam: An Application of the HOLSAT Model”. Tourism Management in the 21st
Century. Chang, Peter R. (Ed). New York:
Nova Science Publishers, Inc.
Yogyakarta Municipality Ofice of Tourism, Arts
and Culture & Center for Tourism Studies, Universitas Gadjah Mada (2008). “Analisis
Pasar Pariwisata Kota Yogyakarta 2008”. Unpublished research report.
Yogyakarta Ofice of Tourism & Center for Tourism
Studies, Universitas Gadjah Mada (1998).
“Studi Pengembangan Wisata Minat Khusus”. Unpublished research report.
Yogyakarta Ofice of Tourism (2009). “Penyusunan Paket Wisata Unggulan D.I. Yogyakarta”. Unpublished research report.
Yogyakarta Ofice of Tourism (2014). Statistik Kepariwisataan 2013. Yogyakarta: Ofice of