LANDSLIDE SUSCEPTIBILITY ASSESSMENT OF
KOKAP AREA USING MULTIPLE LOGISTIC
REGRESSION
Somyot Makealoun*1, Doni Prakasa Eka Putra2, and Wahyu Wilopo2
1Water Resources Department, Faculty of Engineering, National University of Laos. 2Geological Engineering Department, Gadjah Mada University, Indonesia.
Abstract
A number of landslides have occured in Kokap Sub-District, Kulon Progo Regency, Yogyakarta Special Province, Indonesia, which have influenced the com-munities. The natural disaster is commonly asso-ciated with a few days of heavy rainfall events. To mitigate the impact of landslides in this area, a land-slide susceptibility assessment needs to be carried out. The main objective of this research is to develop a landslide susceptibility zonation in the research area by applying a logistic regression (LR) method. Field observation was conducted at 68 locations in the research area, in which 46 landslides occured. Data of slope angle, lithology, geologic structure and groundwater conditions were collected. The rela-tionship between landslide occurrence and the slope angle, lithology, geologic structure and groundwa-ter conditions was analysed using the LR method. The analysis results showed a 0.984 standard er-ror, implying a good-fit model. The study area was classified into very low, low, moderate, high and very high landslide susceptibility zones with 0–20%, 20–40%, 40–60%, 60–80%, and 80–100%, respec-tively, probabilities of occurrence. A 60% area of the total study area was classified as a moderate to very high susceptibility to landslide. From 47 landslides, 80% landslides occured in high and very high land-slide susceptibility zones, 17% landland-slides occured in the moderate susceptibility zone and 2% landslides
*Corresponding author: S. MAKEALOUN,
Wa-ter Resources Department, Faculty of Engineer-ing, National University of Laos. E-mail: makeal-oun.somyot@gmail.com
occured in the low susceptible zone. None of land-slides occured in the very low landslide susceptibil-ity zone. The analysis results show that LR method is a very useful method for landslide prediction.
Keywords: landslide susceptibility, multiple logis-tic regression, Kokap Kulon Progo-Indonesia
1 Introduction
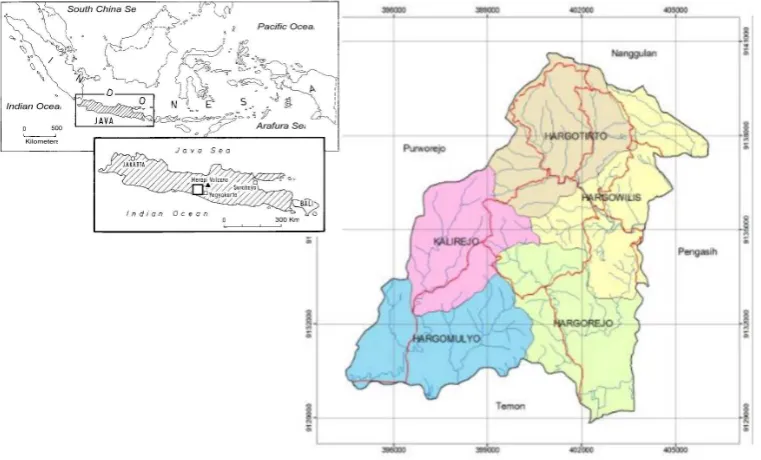
Figure 1: Location of the study area.
is used to represent the propensity of an area to undergo a landslide.
According to Van Westen et al. (1999), there are two methods of landslide susceptibility zonation, which are direct and indirect meth-ods. The direct method is determined by ex-perience and knowledge of the terrain and the indirect method is determined based on statisti-cal method, such as LR analysis or deterministic method or other indirect approaches. A num-ber of applications of LR method in landslide susceptibility assessment has been reported by Rupert et.al. (2002), Chau and Chan (2005), Das
et al. (2010) and Bai et al. (2010). Chau and Chan (2005) explicitly mentioned that accord-ing to Rowlotham and Dudycha (1998), the LR method was the most useful method for land-slide susceptibility assessment. The LR method is therefore applied in this study to assess the susceptibility of the research area to landslide.
2 Geological condition
Kulon Progo mountains are composed of vol-canic rocks, which are dominated by volvol-canic clastic materials and andesite intrusion (Syafri
et al., 2013). Rahardjo et al. (1995) named this volcanic rocks as the Old Andesite Formation. Below the volcanic rocks of the Old Andesite
Formation, the oldest stratigraphic unit in the area is known as Nanggulan Formation, con-sisting of sandstones with lignite, sandy marl, mudstone with limonite, marl, sandstone, tuff (Rahardjo et al., 1995). The whole succession was overlain by sandy tuff and limestone and the youngest rock found in the area is quater-nary alluvial deposits. The morphology of Ku-lon Progo mountains forms an elliptical-shape dome (Syafri et al., 2013). The slope with a number of radially pattern faults can be recog-nized in the Geological Map of Yogyakarta (Ra-hardjo et al., 1995). The study area has an un-dulating to steep hilly morphology with min-imum and maxmin-imum elevations of about 6 m and 850 m above the sea level, respectively (Fig-ure 2a–c). The slopes in the study area range from about 3 to 50°. The exposed lithologies in the study area (i.e., andesite breccias, sand-stone, limestone) are mostly weathered (Figure 2d–f).
3 Logistic regression
Figure 2: (a–c) Steep hilly to undulating morphology in the study area; (d) Andesite breccia; (e) Tufaceous sandstone, and (f) Limestone, which are exposed in the study area.
method that predicts a probability of occur-rence. It is similar to a linear regression model but it is suited to models where the dependent variable is dichotomous or binary (Hosmer et al., 2013). In term of landslide, binary variable will be “0” for “no landslide” and “1” for “yes there is a landslide occurrence” on an observed locations. The equation of multiple logistic regression is shown in Eq. 1 below:
Py= e
α+β1X1+β2X2+···+βiXi
1+eα+β1X1+β2X2+···+βiXi (1)
where: Py= probability of occurrence (0 to 1);
X= independent variable;α= statistically con-stant coefficient;β= statistically derived coeffi-cient.
The equation of LR analysis is called a LR model. The performance of LR model can be evaluated using several statistical measures. In-dividual regression coefficients are considered to be statistically significant if the p-value of the Wald statistic is less than or equal to 0.05 (95-percent confidence or greater). The Wald statistic follows a chi-squared distribution and is used to indicate where the model coefficients are significantly different from zero. A simple
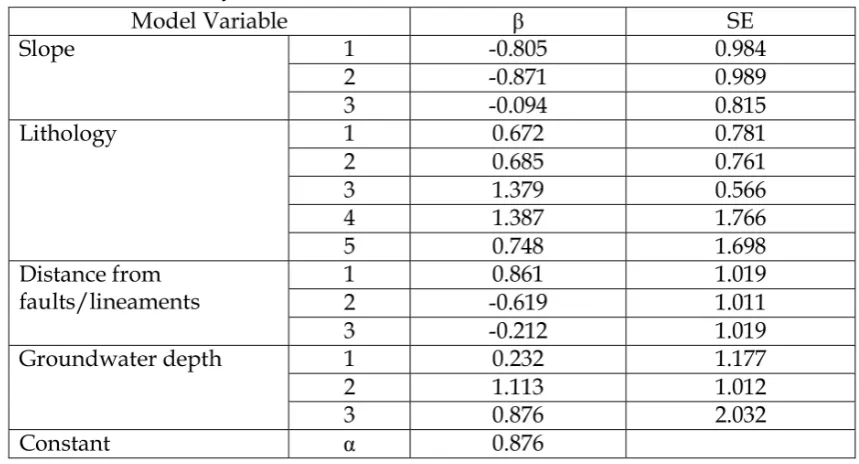
but sometimes subjective technique to evalu-ate if the model is statistically stable is to in-spect the magnitude of the standard error (SE) of each variable. According to Chan (2004), the acceptable magnitude of the SE is around 0.001– 5.0. However, there are no fixed criteria on how small the SE should be but a matter of judg-ment.
4 Landslide causative factors
conjunction with local slope condition must be well examined to obtain reliable landslide pre-dictions.
5 Methodology
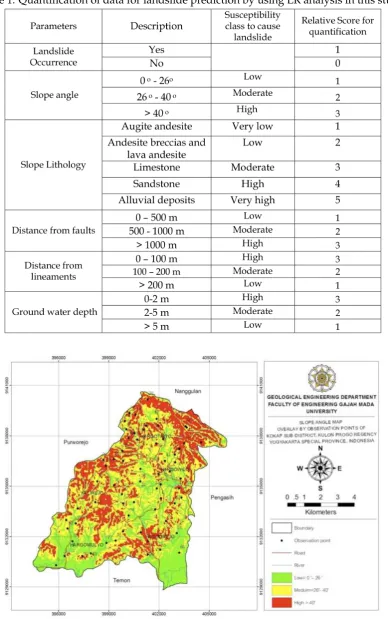
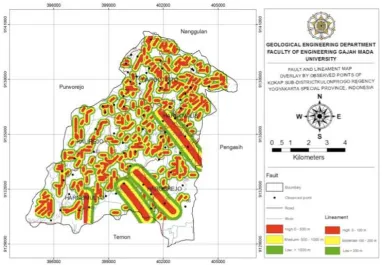
In this study, the causative factors of land-slide used to predict a landland-slide in the study area are slope angle, lithology, distance from faults or lineaments and groundwater condi-tion. Slope angle and distance from lineaments were assessed from evaluation of Digital El-evation Model (DEM) in GIS and were also checked in the field. Data of lithologies and faults were obtained from field observation and literature. Data of groundwater condition were obtained from field measurements of ground-water depth.
The landslide susceptibility assessment was performed by quantifying each of the causative factors of landslide at 68 random observation locations. The quantification of the causative factors of landslide is shown in Table 1. All of the 68 data were then analysed by multiple LR to obtain the LR model of landslide pre-diction in the study area by applying the land-slide occurrence as dependent variable and the causative factors of landslide (i.e., slope angle, slope lithology, distance from faults or linea-ments and groundwater depth) as independent variables. The data of each causative factors are shown in Figure 3 to Figure 6. The LR equa-tions obtained from this analysis were used to develop a landslide susceptibility map of the study area using the Geographical Information System (GIS).
6 Results and discussion
The LR analysis results are presented in Table 2. From this table, it can be seen that the SE of the multiple logistic regression is between 0.001 and 5.0, meaning that the LR model is accept-able. Based on the value of constant and de-rived coefficient from Table 3, the final equation of logistic regression of landslide occurrences versus landslide causative factors (i.e., lithology type, slope angle, distance from faults and
lin-tained.
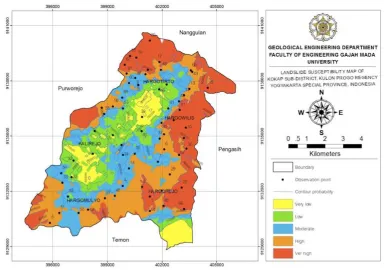
By applying these coefficients of LR equation to the GIS, a final map of landslide susceptibil-ity of the study area can be produced, as shown in Figure 7. The LR analyses show that proba-bilities of landslide occurrence in the study area are from 0% (no landslide will be occurred in this area) to 100% (absolute occurrence of land-slide in this area). Based on the probability, the study area can be classified into very low, low, moderate, high and very high landslide suscep-tibility zones with 0–20%, 20–40%, 40–60%, 60– 80%, and 80–100%, respectively, probabilities of occurrence. Based on the landslide susceptibil-ity map, the moderate to very high landslide susceptibility zones occupied 60% area of the whole study area.
Comparison between the number of land-slide occurrence and landland-slide susceptibility can be used to investigate the reliability of the developed susceptibility map. Table 3 shows the comparison between the numbers of land-slide and the class of landland-slide susceptibility. It can be concluded that the occurrence of land-slides matches with the class of susceptibility. From 47 landslides occurred in the study area, a 38% of the landslides occurred in the very high susceptibility class, a 43% of the landslides oc-curred in the high susceptibility class, a 17% of the landslides occurred in the moderate suscep-tibility class, one landslide occurred in the low susceptibility class and no landslide occurred in the very low susceptibility class.
Although the ratio of landslide occurrence appears to match with the susceptibility class, predictions of landslide occurrence in the high and very high landslide susceptibility classes were not too precise. Both classes of suscepti-bility show almost similar percentages of land-slide occurrence. This may occur due to differ-ent local conditions, such as amount of rainfall, sunshine, and vegetation cover, that have not been examined in this study.
7 Conclusion
sus-Table 1: Quantification of data for landslide prediction by using LR analysis in this study.
Figure 4: Lithology distribution in the study area.
Figure 6: Groundwater depth distribution in the study area.
Figure 7: The LR landslide susceptibility map of the study area.
ceptibility classes, the LR method has been proven to be a reliable method for the devel-opment of landslide susceptibility map in the study area. Satisfactorily prediction may be ob-tained if more landslide causative factors are taken into account in the analyses, particularly factors related to the local conditions.
Aknowledgement
The authors wish to express gratitude to JICA AUN/SEED-Net for the financial support un-der the research umbrella of “Landslide Sus-ceptibility Mapping”. The first author would personally express also his gratitude to JICA AUN/SEED-Net for the scholarship to study in the master degree program of Geological Engi-neering, Gadjah Mada University, Indonesia.
References
Bai, S., Wang, J., Lu, G., Zhou, P., Hou, S., Xu, S. (2010) GIS-based Logistic Regression for Landslide Susceptibility Mapping of the Zhongxian Segment in Three Gorges Area, China., Geomorphology, vol. 115, p. 23–31. Chan, Y.H. (2004) Biostatistic 202: Logistic
Re-gression Analyses, Singapore Medical Jour-nal, vol. 45(4), p. 149–153.
Chau, K.T. and Chan, J.E. (2005) Regional Bias of Landslide in Generating Suceptibility Maps using Logistic Regression: Case of Hong Kong Island, Landslides, vol. 2, p. 280–290.
Das, I., Sahoo, S., Van Westen, C., Stein, A.,
and Hack, R. (2010), Landslide susceptibil-ity assessment using logistic regression and its comparison with a rock mass classification system, along a road section in the northern Himalayas (India), Geomorphology, vol. 114, p. 627–637.
Hosmer, Jr., D.W., Lemeshow, S., and Sturdi-vant, R.X. (2013) Applied Logistic Regres-sion, 3rd, John Wiley & Sons, 500p.
Karnawati, D. (2005) Bencana Alam Ger-akan Massa Tanah di Indonesia dan Upaya Penanggulangannya. Yogyakarta, Jurusan Teknik Geologi, UGM.
Rahardjo, W, Sukandarrumidi and Rosidi, H.M.D. (1977) Geological map of Yogyakarta Quadrangle, Geological Survey of Indonesia, Bandung.
Rupert, M.G., Cannon, S.H., and Gartner, J.E. (2002) Using Logistic Regression to Predict the Probability of Debris Flows Occuring in Areas Recently Burned By Wildland Fires, Open-File Report of 03-500, USGS.
Syafri, I., Budiadi, E., and Sudradjat, A. (2013) Geotectonic Configuration of Kulon Progo Area, Yogyakarta, Indonesian Journal of Ge-ology, vol. 8(4), p. 185–190.
Van Westen, C.J., Seijmonsbergen, A.C., and Mantovani, F. (1999) Comparing Landslide Hazard Maps, Natural Hazards, vol. 20, p. 137–158.