ORCHARD OF
Willd
AT CENTRAL JAVA, INDONESIA : IMPLICATIONS FOR INCREASING
GENETIC GAIN AND SEED PRODUCTION
Acacia mangium
.
Arif Nirsatmanto
As part of multiple-population breeding scheme using sub-lining system, a composite seedling seed orchard of was established at Central Java, Indonesia. The orchard comprises a combination of the best 40 plus tree families selected from four sub-lines in the first-generation of progeny trial. The design of orchard is randomized complete block laid-out as four line tree-plot of six replications with a spacing of 2 x 4 meter. Variation among sub-lines and families within sub-line, and genetic parameters for height, dbh and volume were investigated at age of 24 months. The aim of this study was to investigate genetic variation for growth traits in a composite seedling seed orchard and to discuss the implication for increasing genetic gain and seed production. In general, trees derived from two sub-lines of Papua New Guinea (PNG) provenance showed better growth than those from Far-North Queensland, Australia (FNQ). Analysis of variance revealed significant differences among sub-lines and families within sub-line for height, dbh and volume. Variation of the traits among families within sub-line accounted for 1.1% to 5.0%, and trees within family 43.8% to 65.8%. Heritability varied from 0.044 to 0.201 for individual, 0.060 to 0.229 for within-family and 0.098 to 0.383 for family. Within-family selection promoted high genetic gain for all traits, ranging from 1.3% to 4.4%. In order to increase genetic gain and seed productivity, it is recommended that:(1) the best plus trees included in the orchard should be selected based on their progeny test, (2) the design of plot size should be single tree-plot, (3) the final density of seed trees should be twice greater than the number of trees intended for seed collection, which is about 300 trees per hectare.
Keywords: , sub-lining system, composite seedling seed orchard, seed production 1), 2)
ABSTRACT
Received : 27 April 2012, Accepted : 15 September 2012
Acacia mangium
Acacia mangium
1
Center for Forest Biotechnology and Tree Improvement Research, Yogyakarta
Corresponding author: [email protected] 2
inbreeding (McKeand and Beineke, 1980; Zobel and Talbert, 1984). Completely outbreed offspring can be maintained more precise by selecting a few best seed parent in each sub-line. The selected seeds were then planted together with those from other sub-lines in the same orchard, hereinafter referred as a composite seeding seed orchard. Thus, this type of seed orchard is used specifically to produce improved seed for plantation (McKeand and Beineke, 1980), and not intentionally for breeding population.
is a suitable species for sub-lining system due to several reasons, such as fast growing, difficult to control-pollinate and wide range of natural distribution. The Center for Forest Biotechnology and Tree Improvement
Acacia mangium I. INTRODUCTION
and AM004-sub-line D, with 10 plus trees families for each sub-line (Table 1). Four sub-line populations of first-generation progeny trial were established in two locations: South Sumatera and South Kalimantan, using family originated from Papua New Guinea and Queensland-Australia provenances (Hashimoto ., 1996).
The design of composite seedling seed orchard was randomized complete block with four line tree-plot of six replications, and a spacing of 2 x 4 m. Progressive within-plot thinning will be practiced in the orchard, retaining one the best tree per-plot as a final density for seed production. To promote optimal out-crossing rate and aiming for final density of around 300 seed trees per hectare, no family selection was practiced in the orchard.
Measurements of height, diameter at breast height (dbh), and individual tree volume were conducted at age 24 months after planting. Individual tree volume was calculated with the volume equation (Inose ., 1992); =
0.000058806 x x .
Analysis of variance was made using individual tree data ( ) with the following linear model:
= + + + + * + ….…….… (1)
where: , , , , * , are population mean, the th replication effect, the th sub-line effect, the th family within the th sub-line effect, the interaction effect of the th replication and the th family, and experimental error associated with
, respectively.
et al
et al v
D H
y
y µ R S F(S) R F e µ R S F(S) R F e
i j
k j
i k
y
B. Measurement and Data Analysis
1.71772 1.0809
ijk
ijk i j jk ik ijk
i j jk ik ijk
ijk
(CFTBI), Yogyakarta, Indonesia has started a series of breeding program for using sub-linig system since 1994. Four sub-lines of
covering the range of natural distribution of Papua New Guinea and Queensland-Australia were used in this program, and currently two generations breeding program has progressed. To capture the benefit of sub-lining system, some composite seedling seed orchards of
were established in several locations such as in Central Java, South Kalimantan and Riau.
Principally, composite seedling seed orchard is designed to produce highly improved seed by combining high productive seed trees from some unrelated sources in an orchard. However, establishment of this type of orchard for
is relatively new experience and still many probabilities for improving the method. Therefore, this study was done to investigate some aspects related to genetic variation for growth traits in composite seedling seed orchard and their implication for increasing genetic gain and seed production.
The composite seedling seed orchard used in this study was established in Wonogiri Central Java, Indonesia. The orchard consists of 40 families in a combination of the best selected plus tree families from four sub-line populations of first-generation progeny trial: namely AM005-sub-line A, AM002-AM005-sub-line B, AM006-AM005-sub-line C
A. mangium A. mangium
A. mangium
A. mangium
II. MATERIAL AND METHOD
A. Composite Seedling Seed Orchard
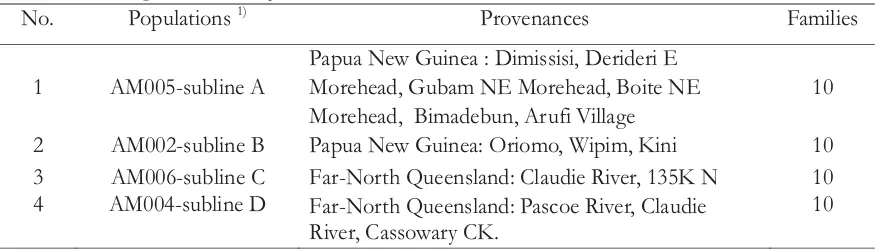
Table 1. Details of population and number of families planted in composite seedling seed orchard of in Central Java, Indonesia
A. Mangium
No. Populations1) Provenances Families
1 AM005-subline A
Papua New Guinea : Dimissisi, Derideri E Morehead, Gubam NE Morehead, Boite NE Morehead, Bimadebun, Arufi Village
10
2 AM002-subline B Papua New Guinea: Oriomo, Wipim, Kini 10
3 AM006-subline C Far-North Queensland: Claudie River, 135K N 10
4 AM004-subline D Far-North Queensland: Pascoe River, Claudie
River, Cassowary CK.
10
Additive genetic variances for each trait were calculated as four times the family variance component (4 ), with assumption that open pollinated families analyzed here were half sibs (Falconer, 1981). Phenotypic variances were calculated as the sum of family variance component , interaction family x replication variance component , and that of within plot error variance .
Individual tree heritability ( ), family mean heritability ( ) and within-family heritability ( ) were then estimated by (Namkoong, 1981, Falconer and Mackay, 1998) :
... ... ... (2)
... (3)
... (4)
where, = number of trees per plot and = number of replications.
Absolut gain as respon to within-family s2
selection ( ), and the relative gain [ (%)]were estimated by (Falconer and Mackay, 1998) :
)
(6)
In this purpose study, three different selection ratios (75%, 50% and 25%) were simulated to observe the effectiveness of two plot sizes design (four line tree-plot and single tree-plot) for increasing genetic gain and seed production in composite seedling seed orchard.
Trees planted in the composite seedling seed
orchard of showed good growth,
averaging 5.35 m for height, 4.97 cm for dbh and 0.00658 m for tree volume, with survival rate more than 90% (Table 2) . Trees derived from plus trees in two sub-line populations originated from Papua New Guinea (PNG) provenances (Am005-sub-line A and AM002-sub-line B)
R R
A. mangium
... (5
...
III. RESULT AND DISCUSSION
A. Growth and Genetic Parameters
3
Table 2. Mean of growth traits and survival rate at age 24 months in composite seedling seed orchard of in Central Java, Indonesia
A. mangium
Populations Observation number
Height (m) d.b.h (cm) Volume/tree x 10-3m3)
Survival (%)
AM005-subline A 213 5.48 5.06 7.00 88.8
AM002-subline B 221 5.55 5.11 7.03 92.1
AM006-subline C 218 5.11 4.87 6.10 90.1
AM004-subline D 215 5.27 4.85 6.20 89.6
Grand mean 867 5.35 4.97 6.58 90.3
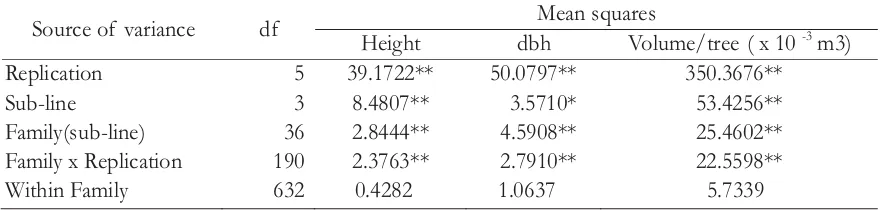
Table 3. Mean squares forthe three measured traits at age 24 months in composite seedling seed orchard ofA. mangiumin Central Java, Indonesia
Source of variance df Mean squares
Height dbh Volume/tree ( x 10-3m3)
Replication 5 39.1722** 50.0797** 350.3676**
Sub-line 3 8.4807** 3.5710* 53.4256**
Family(sub-line) 36 2.8444** 4.5908** 25.4602**
Family x Replication 190 2.3763** 2.7910** 22.5598**
Within Family 632 0.4282 1.0637 5.7339
showed better growth than those from Far-North Queensland Australia (FNQ). The superiority of PNG provenance for growth trait in this study was in agreement with the report of previous provenance trials (Harwood and Williams, 1991, Kari ., 1996). The best growth was found in trees derived from AM002-sub-line B, which consisted of seedlot from Oriomo region, that was recognized as being productive PNG provenance. Regarding the wood properties analysis, previous study using the same population has found that the PNG provenance showed higher wood density than that of FNQ provenances (BBPBPTH, 2007).
Significant differences were found in the analysis of variance among sub-lines and families within sub-line for all the traits (Table 3). Despite the composite seedling seed orchard consisted of a combination of the best 10 selected plus tree families from each of four sub-lines, the differences between sub-lines and families within sub-line appeared to be large, indicating an evident variation and strong genetic effect. It means that the provenances superiority of
as mentioned in preceding paragraph was clearly confirmed in the composite seedling seed orchard.
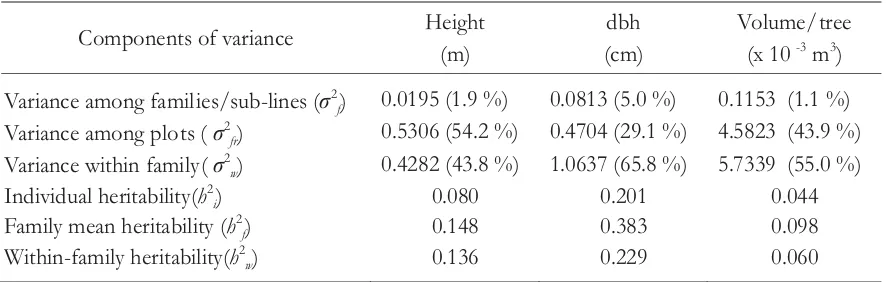
Regarding total variance in the three traits, that is sum of variance among families, plot and trees within family, the family accounted for 1.1% to 5.0%, plot accounted for 29.1% to 54.2%, and trees within family 43.8% to 63.8%. Larger genetic variance among trees within family indicates that the orchard is potential for within
et al
A. mangium
family selection. Dbh provided higher variance among families and within family than height and volume. On the other hand, dbh also provided lower variance among plots than the other two traits.
Among the three types of heritability estimates, family mean heritability was the highest value for all the traits, ranging from 0.098 to 0.383, followed by within family and individual (Table 4). The moderate within family heritability (0.060 to 0.229) indicates that genetic gains could be obtained by practicing within family selection, especially for height and dbh. Within family selection is the only type of selection which was designed for composite seedling seed orchard to promote out-crossing rate among families within sub-line and among sub-lines. Despite, the additional gain can also be obtained from family selection, 4 sub-lines of 10 families each, where was limited in entries number will probably result in less effective number of seed trees to promote the out-crossing rate if family culling is practiced in the orchard. This is because the final density for seed production was considered at around 300 trees per hectare. In this case, the orchard with total area of 0.75 hectares need at least 240 trees. Thus, all 40 families across six replications with one the best tree for each plot should be retained in the orchard for the purpose of seed production. The final density used in this study is higher than that was reported in previous study by Hardiyanto (2004) and Hendrati (2000) which were reported around 100 - 200 trees per hectare retained for seed production of A. mangium.
Table 4. Component of variance, percentage of relative distribution (number in parentheses) of family/sub-line, among plots and within family to total variance, and estimated heritability in composite seedling seed orchard ofA. mangiumin Central Java, Indonesia
Components of variance Height
(m)
dbh (cm)
Volume/tree
(x 10-3m3)
Variance among families/sub-lines (σ2
f) 0.0195 (1.9 %) 0.0813 (5.0 %) 0.1153 (1.1 %)
Variance among plots (σ2
fr) 0.5306 (54.2 %) 0.4704 (29.1 %) 4.5823 (43.9 %)
Variance within family(σ2w) 0.4282 (43.8 %) 1.0637 (65.8 %) 5.7339 (55.0 %)
Individual heritability(h2i) 0.080 0.201 0.044
Family mean heritability (h2f) 0.148 0.383 0.098
Figure 1. Relative gain as response to within-family selection for three different selection ratios in two type of plot size design (four tree-plot and single tree-plot) in composite seedling seed orchard ofA. mangiumin Central Java, Indonesia.
Height dbh Volume/tree
Gains
(%)
Selection Ratio Selection Ratio Selection Ratio
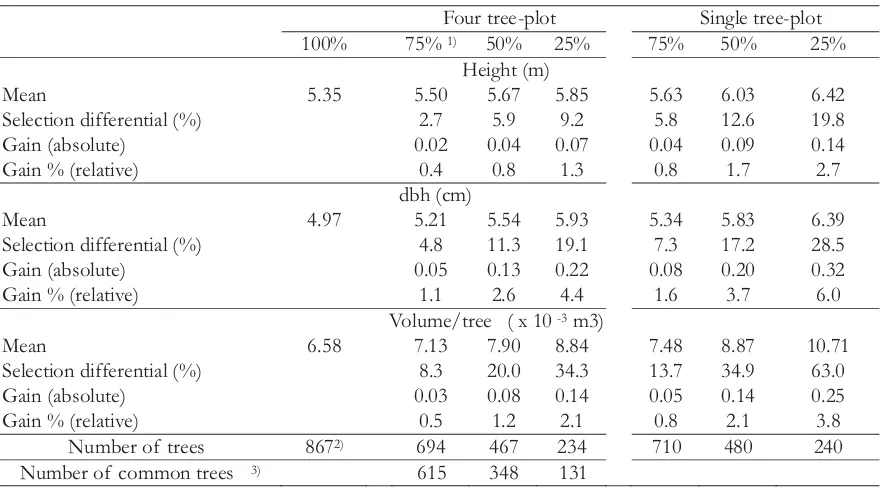
Table 5. Mean, selection differential, number of trees and gain as response to within family selection for three different selection ratio in the two types of plot size (four plot and single tree-plot) in composite seedling seed orchard ofA. mangiumin Central Java, Indonesia
Four tree-plot Single tree-plot
100% 75%1) 50% 25% 75% 50% 25%
Height (m)
Mean 5.35 5.50 5.67 5.85 5.63 6.03 6.42
Selection differential (%) 2.7 5.9 9.2 5.8 12.6 19.8
Gain (absolute) 0.02 0.04 0.07 0.04 0.09 0.14
Gain % (relative) 0.4 0.8 1.3 0.8 1.7 2.7
dbh (cm)
Mean 4.97 5.21 5.54 5.93 5.34 5.83 6.39
Selection differential (%) 4.8 11.3 19.1 7.3 17.2 28.5
Gain (absolute) 0.05 0.13 0.22 0.08 0.20 0.32
Gain % (relative) 1.1 2.6 4.4 1.6 3.7 6.0
Volume/tree ( x 10-3m3)
Mean 6.58 7.13 7.90 8.84 7.48 8.87 10.71
Selection differential (%) 8.3 20.0 34.3 13.7 34.9 63.0
Gain (absolute) 0.03 0.08 0.14 0.05 0.14 0.25
Gain % (relative) 0.5 1.2 2.1 0.8 2.1 3.8
Number of trees 8672) 694 467 234 710 480 240
Number of common trees 3) 615 348 131
Note : 1) ratio number of selected individual trees to the initial number of trees 2) number of survived individual trees at 24 months age measurement
3) number of the same selected individual trees among the two types of plot size (four plot and single tree-plot)
Among the three traits, dbh was found to be the trait with the highest heritability, ranging from 0.201 to 0383, followed by height and tree volume. This confirms the effects of variance, where among the measured traits, dbh accounted for the highest value variance among families and within family, but lowest value variance among the plots, as mentioned in preceding paragraph. The estimated heritability indicates that dbh has a
possibility to provide greater gain than another two traits in the three levels of selections, namely: individual, within-family and family selection.
Gain estimated in the three selection ratios basically represents the progressive within-plot selection, which is mostly practiced to reduce over competition among the trees within plot before converting to the function of operational seed production. Dbh provided the greatest genetic gain in all selection ratios, followed by volume and height. The relative order of the gain among the traits is consistent with the magnitude of their heritability value. This was also confirmed with the results in the previous study, where realized genetic gain observed in second-generation seedling seed orchard of was most obvious for dbh, then followed by height and stem straightness (Nirsatmanto ., 2004).
In selection ratio of 50%, genetic gain for volume accounted for 1.2%. This is similar as those reported in the first-generation seedling seed orchards, where the gain for volume after culling the two poorer tree out of four trees per plot accounted for 0.4% to 1.3% (Nirsatmanto and Kurinobu, 2002). While in the selection ratio of 25%, the final selection of one best tree within-plot, the genetic gain for volume estimated in this study was higher than that reported in the previous study after leaving one best tree out of the two remaining trees. The relative gain for volume in this study was 2.1%, while the corresponding gain in previous study was around 0.5%. The primary reasons for this discrepancy is owing partly to the additional selection intensity that had been allocated at the time of plus trees selection, where only the best 10 selected plus trees from each of four sub-lines in first-generation selection included for establishing the composite seedling seed orchard.
There are several problems involved with establishing composite seedling seed orchard. First is the difficulty of selecting the true best plus tree from each sub-line since mating between relatives have occurred (Zobel and Talbert, 1984). The best plus trees included in composite seedling seed orchard of here was selected mostly based on growth and form traits, with less information on their
(GCA). As the results, some plus trees selected within sub-line might produce some inbreed trees
A. mangium et al
A. mangium
general combining ability B. Implication for Increasing Genetic Gain
and Seed Production
that performed slower growth. This indication might be confirmed with a highly significant differences of families within sub-line, despite only small number of the best selected plus trees (10 trees) from each sub-line included in the orchard (Table 3). In addition, some trees recorded as the best plus tree was not always producing seed, therefore, it will be replaced by another plus trees in lower rank.
Second problem is the potential of reducing selection differential and number of potential seed trees from using multiple tree-plot design, where if any more than one best trees within a plot, they should be culled by leaving only one best tree per plot to avoid inbreeding. Consequently, the loss of potential seed trees due to this within-plot selection will reduce the productivity of orchard both in quality and quantity. Third is the possibility of increasing inbreed seed due to un-synchronizing flowering among sub-lines in the composite seedling seed orchard. This is because the sub-lines were determined mainly based on their provenances distribution which is geographically different each other with potentially performing different time of flowering.
To overcome the first problem, selected plus trees included in the composite seedling seed orchard is suggested to be determined based on the performance of their progeny test, followed by backward selection. One of the reasons to apply this method is due to the low of estimated family mean heritability (Table 4), which indicates a less reflection of individual plus trees phenotypic performances to their progeny. Consequently, composite seedling seed orchard establishment will be delayed two or three years until the progeny trial progressed. However, under this way, selection of true best plus trees could be done more precisely with more complete genetic information, such as GCA, magnitude and type of GxE interaction.
more precise selected true best plus trees from each sub-line could significantly increase and maximize either gains or seed production in the composite seedling seed orchard, despite delayed a few years in the establishment.
Regarding the solution for second problem, simulation among two plot sizes design, that is four tree-plot and single tree-plot, were compared in this study using three different selection ratio scenarios (75%, 50% and 25%). The three selection ratios represent the progressive within family selection up to final density for operational seed production. In respective selection ratio, despite both plot sizes showing the same relative order of the gain among the traits, single tree-plot provided larger genetic gain than four tree-plot in all traits (Table 5 and Figure 1). The superiority of single tree-plot to four tree-plot was most evident in selection ratio 25%, in which the final density for operational seed production set up. In this ratio, selection differential in single tree-plot increased almost doubled to four-tree plot. This indicates that the possibility to obtain better seed trees in single tree-plot is higher than that in four tree-plot. This is because the loss of high potential seed trees due to within family selection could be avoided in single tree-plot by the planting of no related trees in adjacent plot. Increasing the difference of selection differential was also confirmed with reducing the number of common trees among the two types of plot size at the rate of around 15 % with decreasing selection ratio.
Single tree-plot also could potentially provide higher number of available retained trees than four tree-plot, despite the differences was reduced with decreasing selection ratio (Table 5). Reducing number of trees in four tree-plot is due to the impact of using multiple tree-plot, where plot to plot was managed independently and in the beginning within family selection will be practiced based on the performance of trees within each plot only. Thus, if any missing trees within a plot, it could not be replaced by the survived trees in another plot, despite the number of trees in a plot containing missing trees passed over the target of selection. As a result, total number of retained trees in four tree-plot were reduced as compared to single tree-plot. In this study, with the density of 867 trees before selection, retained trees in single tree-plot were 710 trees, 480 trees and 240 trees for selection ratio 75%, 50%, and 25%,
respectively. The corresponding retained trees in four tree-plot were 694 trees for 75%, 467 trees for 50%, and 234 for 25%.
Another interesting result in this study was that single tree-plot could also provide more an effective number of retained seed trees than four tree-plot. As shown in Table 5, the amounts of gains reached by four tree-plot at selection ratio 25% (234 retained trees) could be attained by single tree-plot at selection ratio 50% (480 retained trees). The significant increasing number of potential seed trees by using single tree-plot design would bring some amount of increasing seed production in composite seedling seed orchard. The advantages of using single tree-plot design for increasing of out-crossing rate, seed production, reducing cost and time of breeding
in has been also reported by
Balmelli (2000). Another study reported by Stanger , (2007) showed that single tree-plot could potentially increase tree growth higher than both line and square tree-plots in clonal test of Eucalyptus hybrid.
For the solution in the third problem, final density of seed trees in the phase of seed production should be increased up to around 300 trees per hectare. By considering the fact that composite seedling seed orchard consisted of the best selected plus tree from several sub-lines, the using of higher final density is intended to increase number of pollen contribution trees for promoting out-crossing rate among families and sub-lines. Nevertheless, the number of seed trees intended for seed harvesting will be only around 50% out of the final density, which is basically same as reported in previous study at around 150 trees. However, the number of pollen contribution trees as proposed in this study will be twice greater. Thus, the retained trees will be classified into two purposes: trees for pollen contribution and trees for seed collection.
Such kind of proposed method as mentioned in preceding paragraph seemed to be an appropriate strategy to maintain the quality and quantity of seed produced from a composite seedling seed orchard which having the possibility of varied flowering time among sub-lines. This is because four sub-lines used in this study were originated from Papua New Guinea and Far North Queensland-Australia (Table 1), the two regions which was clearly different geographically
as indicated by the significant difference of variance among sub-lines (Table 3). Consequently, possibility of out-crossing among trees occurred only in the same provenances or sub-lines would be high. Therefore, it is suggested to retain trees with twice greater density over the number of trees intended for seed collection. The final density of 300 trees per hectare seemed to an optimal density for establishing of
composite seedling seed orchard. Yamada, ., (2000) reported that the significant difference in flowering strength among families and provenances was found in seedling seed orchard in Wonogiri, Central Java. The phenomenon of the varied flowering time and reproductive system among provenances when planted in out of original range has been also reported in many species, such as
(O'Brien ., 2007), Norway spruce (Danusevicius and Gediminas, 2011), Teak (Vasudeva and Gunaga, 2012). Appearing any variation in flowering phenology within a seed orchard can potentially alter the quantity as well as genetic quality of fruits (Sedgley and Griffin, 1989).
Based on the results described above, implication for maximizing genetic gain and seed production in composite seedling seed orchard establishment could be achieved through three improved methods. First, the best plus trees included in composite seedling seed orchard should be selected based on their progeny test. Second, the design of composite seedling seed orchard should be laid-out using single tree-plot, and third, final density of seed trees for seed production should be twice greater than the number of trees intended for seed collection, which is about 300 trees per hectare.
1. The significant differences among four sub-lines and families within sub-line for height, dbh and volume was revealed in 24 months age
of composite seedling seed
orchard . Variation among family within sub-line accounted for 1.1% to 5.0%, and trees within family 43.8% to 65.8%. Heritability varied from 0.044 to 0.201 for individual, 0.060 A. mangium et al
A. mangium
Eucalyptus marginata et al
A. mangium IV. CONCLUSION
to 0.229 for within-family and 0.098 to 0.383 for family.
2. Within-family selection promoted high genetic gain in composite seedling seed orchard of , accounted for 1.3%, 4.4% and 2.1% for height, dbh and volume, respectively.
3. To improve the method for establishing composite seedling orchard of to increase genetic gain and seed production, three recommendations are as follows: the best plus trees included in the orchard should be selected based on their progeny test, the design of plot size should be laid-out using single tree-plot, and the final density of seed trees should be twice greater than the number of trees for seed collection, about 300 trees per hectare.
Balmelli, G. 2000. Genetic parameter estimates
for growth traits in : some
implications for breeding and commercial seed production. : Proceeding of IUFRO 2.08.01 Conference on Forest Genetics for the Next Millennium. Durban, South Africa. pp65-68.
BBPBPTH (Balai Besar Penelitian Bioteknologi dan Pemuliaan Tanaman Hutan). 2007. Laporan Hasil Penelitian Litbang Pemulia-an Acacia dPemulia-an Eucalyptus: penelitiPemulia-an variasi sifat-sifat kayu. Yogyakarta.
Danusevicius, D. and B. Gediminas. 2011. Effect of provenance on early flowering of Norway spruce. The fifth international scientific conference, 24-25 November, 2011, Akademija : proceedings. Akademija :AleksandrasStulginskis University. Vol. 5.pp30-33.
Falconer, D.S. 1981. Introduction to Quantitative Genetics. 2 Ed. Longman House, London, UK. 340p.
Falconer, D.S and Mackay T.F.C. 1998. Introduction to Quantitative Genetics. 4 Ed. Longman House, UK. 480p.
A. mangium
A. mangium
Eucalyptus grandis In
REFERENCES
(in Indonesian, not published)
nd
Hardiyanto, E.B. 2004. Silviculture and Tree
Improvement of .
Hardiyanto, E.B., and A. Hardjono (eds) plantation establishment: the experience from PT. Musi Hutan Persada, South Sumatera. PT. Musi Hutan Persada, South Sumatera. ( ). pp.207-281.
Harwood, C.E. and E.R. Williams.1991. A review of provenance variation in growth of . : Carron, L.T. and K.M. Aken ( ) Breeding Technologies for Tropical Acacias. Proceeding of a Workshop held in Tawau, Sabah, Malaysia, 1-4 July 1991. ACIAR Proceeding No. 37:22-30.
Hashimoto K, S. Kurinobu and H. Suhaendi. 1996. Establishment of seed sources of tropical tree species in Indonesia. : Dieters, M.J., A.C. Matheson, D.G. Nikles, C.E. Harwood, S.M. Walker ( ) Tree improvement for sustainable tropical forestry. Proceeding of the QFRI-IUFRO Conference, Caloundra, Australia. 27 October 1 November 1996. pp370-371. Hendrati, R.L. 2000. Study on flowering and
fruiting of Willd., for seed orchard management to increase seed quality and quantity. (in Indonesian). Thesis
( ). Graduate School of
GadjahMada University.Yogyakarta. 162p. Inose, M., Z.Saridi and T. Nakamura. 1992.
Growth analysis of . No.2,
Hoppo Ringyo vol. 2, pp17-19.
Kari T., A. Otsamo, J. Kuusipalo, R. Vuokko and G. Nikles. 1996. Effect of provenance variation and singling and pruning on early
growth of Willd. Plantation
on (L.)Beauv., dominated
grassland. Forest Ecol Manage 84:241 249. Matheson A.C. 1990.Breeding strategies for MPTs. Glover N and Adams N ( ) Tree improvement of multi-purpose species. Winrock Int. Inst. For Agric. Development, USA. pp67-99.
McKeand S.E. and W.F. Beineke. 1980.Sublining for half-sib breeding populations of forest trees. Silvae Genet 29:14-17.
Acacia mangium In:
Namkoong G. 1981. Introduction to quantitative g enetics in forestr y.Castle House Publications. London. 342p.
Nirsatmanto A., S. Kurinobu. 2002. Trend of within plot selection practiced in two seedling seed orchards of in Indonesia. J For Res 7:49-52.
Nirsatmanto A., B. Leksono, S. Kurinobu and S. Shiraishi. 2004. Realized genetic gain observed in second-generation seedling seed orchards
of in South Kalimantan,
Indonesia. J For Res 9:265-269.
O'Brien, E.K., R.A. Mazanecand S. Krauss. 2007. Provenance variation of ecologically important traits of forest trees: implications for restoration. Journal of Applied Ecology 44(3):583-593.
Sedgley, M. and A.R. Griffin. 1989. Sexual reproduction of tree crops. Academic Press. London. 378p.
Stanger, T.K., G.M. Galloway and E.C.L. Retief. 2007. Final results from a trial to test the effect of plot size on Eucalyptus hybrid clonal rangking in Coastal Sululand, South Africa. : Proceeding Australasian Forest Genetic Conference : Breeding for wood quality. 11-14 April 2007, Hobart, Tasmania, Australia.
Vasudeva, R., and R.P. Gunaga. 2012. Flowering phenology in Teak seed orchard-genetic variation, measurement and implications to seed orchard fertility. Phenology and Climate Change. Xiaoyang Zhang (ed.). ISBN: 978-953-51-0336-3. InTech. http://www.intechopen.com/books/phen olog y-and-climate-change/flowering- phenology-in-teak-seed-orchards-genetic- variation-measurement-and-implications-to-seed-orc. Downloaded in 20 April 2012. Yamada, H., R. L. Hendrati, P. Tambunan and H.
Kawasaki.2000. Preliminary observation of flowering strength in seedling seed orchard of in Wonogiri, Central Java. Bulletin of the Forest Tree Breeding Center. No. 17, pp1-8. Ibaraki, Japan. Zobel, B.J. and J. Talbert. 1984. Applied Forest
Tree Improvement. John Wiley & Sons. New York. 505p.
Acacia mangium
Acacia mangium
In