____________________________ * Corresponding author
A USER-DRIVEN SELECTION OF VGI BASED ON MINIMUM ACCEPTABLE
QUALITY LEVELS
G. Bordogna *, P. Carrara b, L. Criscuolo b,*, M. Pepe b, A. Rampini b a
Institute for the Dynamics of Environmental Processes, National Research Council of Italy, Via Pasubio, I-24044 Dalmine (BG), Italy - [email protected]
b
Institute for Remote Sensing of the Environment, National Research Council of Italy, Via Bassini 15, I-20133 Milano, Italy – (carrara.p, criscuolo.l, pepe.m, rampini.a)@irea.cnr.it
Commission II, WG II/4
KEY WORDS: Information Quality, Spatial Data Quality, VGI, Quality Assessment, Quality Criteria, Aggregation Operators,
Citizen Science.
ABSTRACT:
Despite Volunteered Geographic Information (VGI) activities are now extremely helpful in a number of scientific applications, researchers and decision makers oppose some resistance to the usage of volunteered contributions, due to quality issues. Several methods and workflows have been proposed to face quality issues in different VGI projects, usually built ad-hoc for specific datasets, thus resulting neither extensible nor transferable. In order to overcome this weakness, the authors propose to perform an user-driven assessment on VGI items in order to filter only those that satisfy minimally acceptable quality levels defined according to their specific quality requirements and project goals. In the present work the users, i.e., information consumers, are seen as decision makers and are allowed to set the minimum acceptable quality levels Thus the approach proposes a user driven assessment of the fitness for use of VGI items. The paper first briefly presents a view on VGI components and suitable quality indices, then it describes a logic architecture for managing them and for enabling a querying mechanism to the datasets. The approach is finally exemplified with a case study simulation.
INTRODUCTION
Volunteered Geographic lnformation (VGI) (Goodchild, 2007) is becoming more and more popular, with the diffusion of smart mobile devices and geo-applications installed on them (Heipke, 2010). Such information can be collected in the form of free texts, pictures, categories and measurements, associated with the geo-reference, which is generally detected by the GPS sensor of the smart device.
VGI is currently being exploited in many scientific projects. Nevertheless, researchers are often sceptical about the usability of VGI due to its quality issues: heterogeneity, unpredictability, credibility, ambiguity, inaccuracy, incompleteness (Flanagin and Metzger, 2008; Kuhn, 2007). In order to use VGI and minimize the possible creation of weak VGI items it is necessary to analyse the possible causes of the quality degradation, and define and adopt policies for both regulating and constraining the data entry by volunteers.
In fact, VGI quality assessment implies the consideration of several factors with respect to the content of VGI items, both extrinsic and intrinsic. Extrinsic factors are difficult to be precisely quantified since they mainly depend on the characteristics and reputation of the sources of information, i.e. the volunteers, who may be unknown. Intrinsic factors depend on VGI contents and may be different for textual notes, images, measurements, etc. Finally, quality is also dependent on pragmatic factors, which are related to the purposes for which VGI is used and thus can vary from application to application, and, within the same application, can depend on user needs and expectations.
Usually the quality issues are faced in each GI project by adopting methods and workflows that are built ad-hoc. They rely sometimes on the standard ISO 19113-15 definitions for internal and external quality of geographic information. In ISO 19113-15 internal quality relates to intrinsic characteristics of information such as its temporal, spatial and semantic accuracy while external quality relates to its fitness for use. These methods perform most of the times a validation of the whole dataset of VGI items (by a team of expert or by a community) (Vandecasteele and Devillers , 2013), mainly by applying geo-statistical filtering of the data collection, or by comparison with official and authoritative datasets (Haklay, 2010). On the other hand, other approaches exploit specific properties of VGI that relate to the characteristics of the volunteers, regarded as information sources, like the number of the contributors , their frequency of updating, their motivation and credibility in creating information (Haklay, 2010; Domnez, 2009; Flanagin and Metzger, 2008), which are not covered by the ISO standard internal and external quality. Most of these methods are usually designed and customized for single datasets, applying specific assessment criteria of the quality for a given purpose, and are then often neither extensible nor transferable (examples in Jackson et al., 2013; Keßler et al., 2013; Spinsanti and Ostermann, 2013).
In this paper, we try to overcome this weakness by proposing a flexible approach to VGI items selection that can be applied ex.post on a collection of VGI items in order to filter only those items that satisfy customizable quality criteria (see Figure 1). Since distinct VGI consumers, in the following named users, typically have distinct application needs, demanding distinct quality of VGI items, we conceived the quality assessment based on the specification of users’ queries, expressing
minimally acceptable quality levels on the VGI items. These queries are submitted to a database of VGI metadata, containing several quality indicators. These quality indicators represent all the main declinations of quality for VGI: there are indicators of both the internal quality, that we rename intrinsic quality, which is dependent on the content of VGI items, and the extrinsic quality, that identifies the quality of the VGI observations, i.e., it depends basically on the volunteers’ characteristics. Thus in this process the user queries express pragmatic quality criteria (corresponding to the ISO external quality) that the VGI intrinsic and extrinsic quality indicators must satisfy in order to select the correspondent VGI items.
Figure 1: ontology representing the proposed user’s driven quality-based selection of VGI items
In (Bordogna et al., 2014a) we proposed a linguistic approach, based on the possibility for consumers of a VGI collection to express their selection criteria of VGI items. Some quality indicators are associated with the VGI elementary components, describing both intrinsic and extrinsic aspects of VGI. A user willing to filter a set of VGI items within the collection could for example specify that only VGI items created by volunteers with high expertise in the project, and with complete information - i.e. all fields of VGI items should be filled in - are selected. The quality assessment performed this way is pragmatic, user and application dependent, and extremely flexible and customizable.
In the present proposal first we briefly explain our view on VGI components, then we build upon the cited quality model by simplifying the user interaction: the user is enabled not only to select preferred sources of VGI, but also to set minimum acceptable quality levels for the specific VGI items.
Section 1 describes the newly proposed approach; section 2 simulates its application in the case study of VGI about glaciology; section 3 offers an overview of related works; finally section 4 briefly summarizes the advantages obtained.
1. DESCRIPTION OF THE APPROACH
In our approach we name by VGI item a piece of VGI created by a single volunteer to describe some entity of the real world, that can be either a Point Of Interest such as a cultural or natural place, or a measurement of a physical or chemical property of a site. VGI items created in distinct applications are heterogeneous by nature and often consist of distinct types of intrinsic and extrinsic components. While the intrinsic components pertain to the content aspects of the entities and describe textually or numerically what is the entity, and where the entity is located on Earth, i.e., its geographic footprint, the extrinsic components describe the observation of the entity: the authorship of the item, where on Earth the author has created the VGI item (which can be the same or different with respect to the entity geographic footprint) and the date or the time span of the creation. Both the intrinsic and the extrinsic components may comprise pieces of information of distinct nature such as
textual descriptions and annotations, numerical values, categories, pictures and other specific attributes.
Depending on the type and nature of the components of the VGI items we assume that distinct elementary quality indicators can be computed or associated to quantify the levels of the quality of the specific VGI item components. We will name intrinsic and extrinsic quality indicators those associated with the intrinsic and extrinsic components of the VGI items respectively. While the intrinsic quality represents the validity of the VGI item, the extrinsic quality represents the validity of the observation.
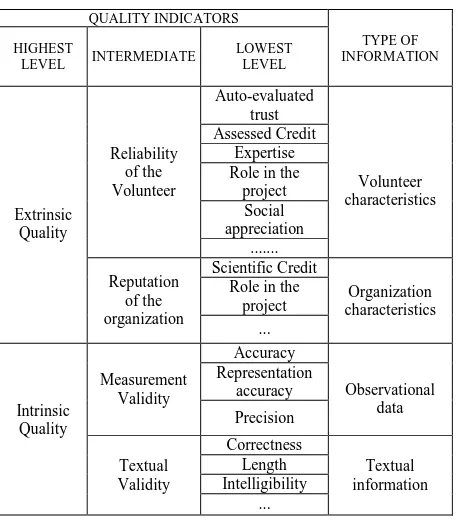
The overall intrinsic, and extrinsic quality of VGI items are compositions of the corresponding elementary quality indicators (see Table 1 as an example of composition). The third column of Table 1 represents some elementary intrinsic and extrinsic quality indicators, in relation with the different pieces of information composing a VGI item; for example the quality of the information on the organization of the volunteer falls into indicators) which may be combined again to define the overall extrinsic and intrinsic quality of VGI items (the highest level quality indicators in the first column of Table 1).
Given the elementary quality indicators, the definition of both the hierarchy of intermediate and highest level indicators and of the rules for their combination at each node depend on the fitness for use and thus on the user.
QUALITY INDICATORS
Table 1: hierarchy of quality indicators for different components of a VGI item; from (Bordogna et al., 2014a).
We name by pragmatic quality the combination - based on user’s specified criteria - of the elementary intrinsic and extrinsic quality indicators.
(Bordogna et al., 2014a) has proposed an approach aimed at assessing VGI quality based on a decision making approach so
as to allow its feasible use for scientific purposes. That work has conceived the assessment of the pragmatic quality of VGI items as a linguistic decision making process, in which first each VGI item is an alternative, a possible solution, that must be evaluated on the basis of each single criterion expressed linguistically by the decision maker; then the alternatives must be ranked on the basis of the global satisfaction degrees of the criteria, aggregated at distinct levels as specified by an evaluation schema. Finally, the VGI items must be filtered by selecting only those which appear in the top k positions of the ranked list. Query makers, i.e., users, play the role of decision makers, and can specify their subjective criteria for filtering the VGI items by the instantiation of a quality evaluation schema, having a hierarchical structure, in which the quality indicators are defined with distinct granularity. This is done by expressing the desired linguistic values of the quality indicators, and by specifying through linguistic quantifiers the way these values must be aggregated at each node.
Based on this schema one can for example express a query tolerating low intrinsic quality of VGI items, and at the same time a high volunteer’s assessed credit and a very high organization reputation. The terms low and high are defined as soft constraints on the values of the lowest level quality indicators. A soft constraint is a tolerant condition that admits degrees of satisfaction in [0,1].
Characteristics of this previous proposal are:
Definition of elementary indicators of the quality of distinct components of information;
a paradigm to represent the overall quality of VGI items by a hierarchical composition of the indicators based on user needs;
a flexible approach to represent and assess the VGI quality.
Nevertheless, the expression of users’ needs by means of linguistic terms can be laborious and it requires a good users’ knowledge of the VGI structure. In many real cases it is simpler letting users specify selection conditions expressed by minimum acceptable levels of quality that the elementary quality indicators must overcome.
This is the reason why, in this paper, we present an evolution of the approach in (Bordogna et al., 2014a) that offers a simplified interpretation of users’ requirements to define the pragmatic quality: in the present approach users are allowed to express minimum acceptable values for the quality indicators of VGI components.
For the application of the approach a logic architecture and some processing steps have been defined. They are described hereafter.
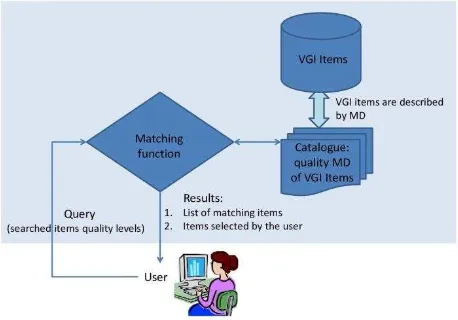
In fact, the proposed paradigm assumes that in a preliminary off-line phase each VGI item has been stored in a database and has been represented by a quality metadata unit also stored in a quality meta-database or quality catalogue (both shown in figure 2). A big arrow in the Figure 2 underlines that a one to one bi-univocal relationship exists between a VGI item and a metadata unit so that when retrieving a metadata unit the correspondent VGI item can be easily accessed and vice versa.
A metadata unit is a semi-structured document, encoded into an XML document, composed by a hierarchy of tags identifying semantically homogeneous elements and relative sub-elements. These metadata elements and sub-elements describe the quality of a VGI elementary components according to a predefined schema. Single elementary components may have different data types, such as free texts, terms from controlled vocabularies or
ontologies, pictures, videos, numerical values.
Distinct quality indicators, both elementary and intermediate level indicators, can be either manually associated or automatically computed, depending on both the nature and type of the VGI items single components. For example, a VGI item composed by a textual description and a picture is associated with a metadata unit consisting of an XML document structured into two elements describing the intrinsic quality of both the textual component and the pictorial component of the VGI item. The sub-element describing the quality of the textual part can be structured into further elementary sub-elements representing distinct quality characteristic of the text, i.e., by distinct elementary quality indicators such as length, correctness, and intelligibility (see Table 1), while the quality characteristics of the pictorial part can be defined in terms of other elementary quality indicators such as the framing, contrast, sharpness, dynamic range, etc. Finally, the whole VGI item is associated with a field describing its overall extrinsic quality characteristic in terms of the reliability of the volunteer who created it and of his/her organization reputation (see again Table 1).
The framework is depicted in Figure 2: the user expresses her/his query that specifies the searched items’ quality selection conditions, which are used to filter quality metadata of VGI items satisfying the quality conditions to a minimum level.
Figure 2: high level sketch of the user driven VGI items selection based on querying quality indicators User queries can be expressed by specifying one or more selection conditions combined by aggregation operators, and are evaluated bottom up, starting with the selection conditions evaluation defined on the elementary quality indicators and then proceeding with the evaluation of their aggregation operator. Intermediate evaluation results are stored in temporary retrieved lists in which the identifiers (IDs) of the matching VGI items are associated with their intermediate satisfaction degrees, which are scored in [0,1]. A zero score means that the VGI item does not satisfy the query at all, while one corresponds to the full satisfaction. The whole query evaluation process returns a final list containing the IDs of the VGI items with relative overall scores that can be used to rank the items in decreasing order of their query satisfaction. VGI items that do not match the query are not returned to the user.
Notice that the evaluation schema of the pragmatic quality of VGI items is predefined, i.e., the hierarchy of the quality indicators is the same to all users since it depends on the availability of procedures and resources to compute the elementary quality indicators, while both the soft constrains on
the values of the indicators defining the minimum acceptable levels and the combinations of their satisfaction degrees by means of aggregation operators at each node are specified by the user, and are computed real time during a query evaluation. In this newly simplified approach the user expresses a possibly tolerant selection condition on a quality indicator of a component of the VGI item, by simply stating the minimum acceptance level (threshold) for the specific quality indicator; this is sufficient to gain an appropriate quality of the correspondent VGI item. This way a VGI item whose quality indicator, contained in the quality catalogue, satisfies the minimum threshold gets a score 1, and its ID is stored in the temporary list of retrieved items. VGI items that do not overcome the threshold, although close to it, get a value close to 1, while those that are far below the threshold get a 0 score and are not included in the list.
Once all the selection conditions are evaluated, the temporary retrieved lists are combined following the criteria specified by the aggregation operator. Users can propose different aggregation operators, for example, by selecting the minimum of all the scores of a VGI item yielded by its selection conditions; this corresponds to require that all selection conditions are satisfied in order to retrieve the VGI item. By proposing a maximum as aggregation operator, the user states that the satisfaction of any of the selection condition is sufficient to retrieve the VGI item. This way the user query can be either the most selective, whereas the minimum is specified, or the most tolerant, when the maximum is specified, likewise an intermediate solution can be achieved by selecting an average operator.
VGI items must be ranked on the basis of the global satisfaction degrees of the criteria expressed by the aggregation operator selected. Finally, the VGI items shall be filtered out, by selecting only those in the top k positions of the rank list. In other words the users (i.e. decision makers) express their subjective selection conditions by specifying for a set of quality indicators of VGI items their expected minimum acceptance values . These conditions are combined by aggregation operators to define a flexible query to the database of quality metadata of VGI items, which contains the quality indicators as computed offline during a pre-processing phase of the VGI
2. A CASE STUDY IN A GLACIOLOGICAL APPLICATION
As an example, we propose the application of the proposed approach in a project related to the collection of glaciological information on European Alps (Criscuolo et al., 2013), a context where information from volunteers is exploited with success since many years to monitor the glaciers’ fluctuations.
In this case study the typical volunteers involved are amateur glaciologists; their commitment is to collect periodical observations on some alpine glaciers, which comprehend field measurements, pictures and textual notes. Some usual hikers, or even occasional tourists, can likely take part to the collection of information by contributing their own observations (typically
photos or textual comments). The time span in which the field data are collected is crucial since the observations are scientifically more relevant if captured at the climax of the melting of ice. The information contributed is variable both in extrinsic and intrinsic quality. The extrinsic components such as time span, geographical footprint of the author (i.e., view point of observation of the glacier), azimuth for both length measurements and photos and snow conditions are necessary in order to evaluate the validity of the observations. Tables 2a and 2b provide some examples of VGI items with VGI components, and their related elementary quality indicators.
VGI
Photo settings Length, correctness, ... Observation date Temporal validity Shot position Spatial precision, accuracy Shot azimuth Spatial validity
Author Assessed credit, reputation
Table 2a: an example of VGI elementary components and correspondent elementary quality indicators for a picture item.
VGI
Table 2b: an example of VGI elementary components and correspondent elementary quality indicators for a measurement
item.
Let us assume that we have a VGI database containing observations of glaciological interest created by both occasional contributors and committed volunteers, the last ones being trained in glaciological measurements collection and having a good knowledge of the purposes for which the data are collected. These expert volunteers are generally known to the leaders of the monitoring campaigns and thus their VGI items can be easily identified based on the information specified in the author field of the VGI items themselves. This is particularly relevant to evaluate the reliability of each volunteer’s contribution.
As a simulation of the user driven quality based selection process, we assume to have in the VGI database the items listed in Table 3, relative to a single glacier (thus for sake of simplicity we omit the information on the glacier identifier that is assumed the same for all the items in the table)
Associated with the VGI items in table 3 we have in the quality database the correspondent elementary quality indicators that are depicted in table 4.
We recall that the process that computes the elementary quality indicators and that stores their values in the quality metadata is run off line before any user can select VGI items by formulating queries containing quality based selection conditions.
VGI
ID picture
Front measure
observation date
observation view point
(long, lat)
Author ID
01 attached 100 mt 30/08/2014 1621825,
5140670 expert_1
02 attached 35 mt 13/09/2014 1621680,
5140630 hiker_3
03 null 96 mt 15/08/2014 1621620,
5140480 expert_2
04 attached null 30/08/2014 1621750,
5140240 hiker_2
05 attached null 15/09/2014 1621325,
5141637 hiker_1
Table 3: list of plausible VGI items used in the simulation. This process is similar to an indexing process of an information retrieval system. It can be completely automatic, computing a quality indicator on the basis of codified functions for evaluating properties of the content of the VGI item components. This can be the case of the sharpness indicator taking values in [0, 1] that can be computed for the picture component of each VGI item by applying a function that estimates sharpness so that high values close to 1 indicate high sharpness. Conversely, for some quality indicators, a manual intervention should be necessary: for example, to assess the reliability of the authors based on personal knowledge, or the assessed credit due to previous data created by the same user, a moderator of the campaign can select a linguistic value on an ordinal scale {low, medium, high} so that the reliability degree is the index of the label, 0 for low, 0.5 for medium and 1 for high. For some other quality indicators a semiautomatic process can be applied: for example, to compute the date validity (DV) one first needs to set the optimal date for the observations, (PerfectDate) so that the estimation can be automatized by inverting the distance between the observation date (ObservationDate) and the optimal one: this way, the more far away from the optimal date, the smaller the date validity index. As mentioned above, the optimal date for measuring the glacier front position is at the exact end of the ablation season, corresponding to the day preceding the first seasonal snowfall event. The observations predating the first autumnal snow have a decreasing representativeness as they diverge from that optimal date. On the contrary the observations postdating that snowfall event are not usable at all. Let’s assume that the end of the ablation season in 2014 occurred on September the 15th. In table 4 DV indicators were computed by applying the following function:
DV = (PerfectDate > ObservationDate) * 1/[1+( |PerfectDate – ObservationDate|)]
with PerfectDate set to 2014/09/15.
The same semi-automatic process can be applied to determine the measurement validity (MV) that is inversely proportional to the distance of the observation point (which can be automatically detected by the GPS sensor of the smart device the author was using when recording the measurement) from the closest optimal observation point, corresponding to an official landmark, i.e., a point of observation that is defined by the leaders of the project as the best point of view for taking the measurements. In table 4 MV was computed by the following
function:
MV= 1 /[ 1 + (Distance ((lon, lat), (lonP, latP)) ]
where (lonP, latP) are the geographic coordinates of the observation station closest to the author observation point (lon, lat) and Distance is the Euclidean distance between the pairs of points.
VGI ID
ShaRpness (SR)
Measurement Validity
(MV)
Date Validity (DV)
Reliability (R)
01 1 1 0. 0625 1
02 0.2 0.047 0.3333 0.5
03 0 0.9 0.0322 1
04 0.4 0 0.0625 0.5
05 0.8 0 1 0.5
Table 4: computation of quality indicators for the simulated VGI items depicted in Table 3.
Let us simulate a user driven quality assessment process based on the formulation and evaluation of a query.
Let us assume that the user is a tour operator interested in filtering VGI items related to Alpine glaciers to get nice pictures, which can be used in his travel brochure to illustrate trekking and walking tours' trails.
This user may specify a query to filter the VGI items with sharp pictures, while he completely disregards other quality characteristics of items.
The query is very simple. It is composed of a single selection condition specifying the desired minimum level that the sharpness indicator must exceed, e.g.:
q = SR > 0.5
The VGI items that satisfy the query can be ranked in decreasing value to their relevance degree:
Rel(SR)= max (0, SR - 0.5 )
Whenever the value of sharpness is below the minimum acceptance level specified in the query, i.e., 0.5, the relevance degree Rel(SR)=0 and the VGI item is not returned.
As a result of this query evaluation on the quality indicators in Table 4 we obtain the ordered list of VGI items identified by the IDs: 01, 05.
To illustrate the flexibility of the proposed approach let us make another example of user driven quality assessment considering as another user the leader of a citizen science project on Alpine glaciers monitoring.
This user is interested mainly in the measurements of the glacier front position, (as mentioned above, measured as a distance from a landmark). So his query will specify selection conditions on the minimal acceptable levels of the quality indicators related with the validity of the measurement, the validity of the observation date and also the reliability of the author of the measurement who must be the greatest.
The query can be a compensative combination of three selection
conditions:
MV > 0.8 with Rel (MV) = max (0, MV - 0.8) DV > 0,7 with Rel (DV) = max (0, DV - 0.7) R > 0 .5 with Rel (R) = max (0, R – 0.5 )
In order to express a compensation between MV and DV, while Reliability is the most important condition, the following aggregations can be specified:
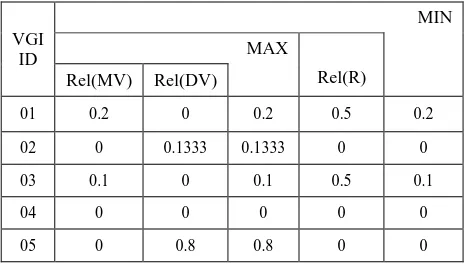
q = MIN (Rel (R), MAX (Rel (MV), Rel (DV))) (1) Let us illustrate the intermediate and final results of the evaluation of this compound query on the quality indicators in Table 5.
VGI ID
MIN MAX
Rel(R)
Rel(MV) Rel(DV)
01 0.2 0 0.2 0.5 0.2
02 0 0.1333 0.1333 0 0
03 0.1 0 0.1 0.5 0.1
04 0 0 0 0 0
05 0 0.8 0.8 0 0
Table 5: partial and final ranks of the VGI items in Table 3 with elementary quality indicators in Table 4 with respect to the
simulated query defined by formula (1)
In this case the first ranked VGI item has ID =01 while item ID=03 is in the second and last position of the list of selected items. Notice that item with ID=05 is not returned since the author is not enough reliable according to the minimum acceptance level of reliability, even if the date validity minimum level is exceeded.
3. RELATED WORKS
A survey of 30 years of research on spatial data quality achievements can be found in Devillers and Jeansoulin (2006). VGI quality is characterized by a greater heterogeneity and inaccuracies than traditional geographic data produced by authoritative sources (Ostermann and Spinsanti, 2013). Critical points that impact on VGI quality are the heterogeneity of expertise and commitment of the users, the media formats of the various social media platforms, which lead to a variety of data structures, the lack of syntactical control on the users’ contributions, the redundancy of users’ generated contents, and the reliability of authors depending on several factors such as their commitment, skill, and motivation. The literature of VGI quality assessment is quite recent (Goodchild and Li, 2012; Ostermann and Spinsanti, 2011).
Depending on user needs, quality assessment methods are aimed either at assessing the quality of a VGI dataset as a whole, or at punctually selecting or filtering only the VGI items that satisfy some requirements.
In (Bordogna et al., 2014b) a schema for classifying VGI projects to predict the quality characteristics of their created VGI is proposed. This schema can provide a guideline for adopting a specific quality assessment approach, more suitable for the given situation.
It is possible to distinguish the quality assessment methods also by considering the time of their application as related to the time of VGI item creation:
• ex ante approaches, when the improvement actions are taken before VGI activity;
• ex post approaches, when volunteer information is improved after collection.
An evaluation of the quality assessment methods was carried out in Wiggins et al. (2011) where the authors analyzed the policy of data validation and quality assessment in around 300 Citizen Science projects. They found out that the most common way for data validation is ex post based on experts’ reviews by trusted individuals or moderators (more than 77% of the sample).
Finally another way to classify quality assessment methods is related to the target of the assessment, which can be the VGI itself (intrinsic information related to the intrinsic quality in our ontology in fig.1), or the author of the VGI (extrinsic information, related to the extrinsic quality in our ontology in fig.1).
Many ex ante approaches taking care of the intrinsic quality of VGI use external knowledge such as metadata standards for interoperability, controlled vocabularies, geographic gazetteers and ontologies in the specific scientific domain, and even templates with automatic error checking capabilities to make it easier the adoption of better data creation practices. Another ex ante strategy is to encourage the use of sensors to acquire data automatically.
Methods for assessing the extrinsic quality as based on several approaches among which inquiring the volunteers about their own confidence in performing the task; categorizing the contributors with respect to their skills, motivations and commitment to define the reputation of the information (Ostermann and Spinsanti, 2011). It is interesting to consider the study of Crall et al. (2011), in which the quality of VGI is characterized in comparison with projects carried out by professionals. It was found that volunteers perform almost as well as professionals in some areas.
Another approach is based on automatically assessing the volunteers’ reputation as depending on the comparison of their data to the rest of the submitted data. Statistics makes it possible to track the contributions of each individual volunteer and then to assess his/her level of commitment and reliability that may provide an automatic way to set the trust of his/her entered items.
In some projects the reputation of participants decreases if their data differ too much from the larger body of submissions to the system. This sometimes allows identifying malicious volunteers creating spamming.
Among ex post approaches, which do not require external knowledge, the application of automatic learning techniques and data mining are deemed useful to perform data validation by identifying outliers, and removing them (Huang, Kanhere and Hu, 2010). Also the identification and fusion of redundant VGI, i.e. co-referent VGI or aliases, can be useful both to remove uncertainty, and to confirm and improve the quality of VGI items (De Tré et al., 2010).
Among the ex post approaches using external data to confirm VGI, the most common ones are those cross-referencing VGI with other authoritative information from administrative and commercial datasets such as land cover, land use, etc. (Haklay, 2010). Nevertheless, the approaches based on comparison with reference data are nowadays difficult to trust, due to the fact that VGI may be even more accurate than the best available authoritative data (Goodchild and Li, 2012).
Devillers et al. (2007) were the first to suggest to define tools in order to manipulate quality information stored in a structured
way, in the form of indicators of the VGI quality, both manually created and automatically extracted from VGI analysis itself. Such quality indicators, besides considering the quality dimensions of geographic information, as defined in the ISO 19113-15 standards, should comprise also some specific indicators of the VGI quality to represent: the amount of conflicting, redundant and completeness of information; the sources’ trust; the evenlydistribution of the users’ contributions over the entire collection; the lineage of reviewing processes. Is by taking this ideas that we defined our user driven quality assessment approach.
4. CONCLUSIONS
In this work we proposed a user-driven approach to assess the quality in VGI items and to select those that meet the user requirements. In this approach the VGI consumers are seen as decision makers who may select the quality level of VGI items according to their specific requirements and goals. The methodology is based on:
the storage of both the VGI items and their metadata, representing the quality of VGI elementary components by quality indicators, which are computed in different ways; the expression of the user’s conditions on the quality of
VGI items as both minimum acceptance levels on the values of the elementary quality indicators and aggregation operator of the selection conditions.
In this newly proposed approach users express a selection condition on a quality indicator of a component of the VGI item, by simply stating the minimum acceptance level (threshold) for the specific quality indicator; this is a simple task, which does not require a deep knowledge of the VGI item structure but is sufficient to gain an appropriate quality of the correspondent VGI item.
The main advantages of this paradigm are the flexibility to users' requirements - as connected to the objective they have while searching for VGI contents - and the possibility to control multiple aspects of the quality - i.e. intrinsic, extrinsic and pragmatic. Such aspects are modelled as separated features, for which different validity criteria and thresholds can be expressed, and variously aggregated. The generality of quality descriptors and the decision-making model make the paradigm to be easily adaptable to different themes and scopes, and to a variety of data types and data collections.
In this paper we have illustrated the methodology by an example, a use case on Alpine glacier monitoring, for which the proposed approach proved to be able to adapt to the users’ needs and to assess quality of VGI in a pragmatic perspective.
ACKNOWLEDGEMENTS
This research has been partially founded by the Italian Flagship Project RITMARE.
REFERENCES
Bordogna G., Carrara P., Criscuolo L., Pepe M. and Rampini A., 2014a. A linguistic decision making approach to assess the quality of volunteer geographic information for citizen science. Information Sciences 258, 312-327.
Bordogna G., Carrara P., Criscuolo L., Pepe M. and Rampini A., 2014b. On predicting and improving the quality of VGI projects. Int. J. Of International Journal of Digital Earth, November 2014, 1-22.
Crall, A. W., Newman, G.J, Stohlgren, T.J, Holfelder, K.A, Graham, J., and Waller, D. M. 2011. Assessing Citizen Science Data Quality: An Invasive Species Case Study. Conservation Letters 4 (6). Blackwell Publishing Inc, 433–42.
Criscuolo L., Pepe M., Seppi R., Bordogna G., Carrara P. and Zucca F., 2013. Alpine Glaciology: an historical collaboration between volunteers and scientists and the challenge presented by an integrated approach. ISPRS Int. J. Geo-Inf. 2(3), 680-703. De Tré, Guy, Antoon Bronselaer, Tom Matthé, Nico Van de Weghe, and Philippe De Maeyer. 2010. Consistently Handling Geographical User Data Context-Dependent Detection of Co-Located POIs. Communications in Computer and Information Science, Springer 81 (1). Dortmund, Germany, 85–94.
Devillers, R., Jeansoulin, R. Eds. 2006. Fundamentals of Spatial Data Quality. London. ISTE Ltd.
Devillers, R., Y. Bédard, R. Jeansoulin, and B. Moulin. 2007. Towards Spatial Data Quality Information Analysis Tools for Experts Assessing the Fitness for Use of Spatial Data. International Journal of Geographical Information Science 21 (3), 261–82.
Donmez, P., Carbonell, J. G., & Schneider, J. 2009. Efficiently learning the accuracy of labeling sources for selective sampling. In Proceedings of the 15th ACM SIGKDD international conference on Knowledge discovery and data mining, 259-268. ACM.
Flanagin, A.J., and Metzger, M.J., 2008. The credibility of volunteered geographic information. GeoJournal, v. 72, no. 3-4, 137–148.
Goodchild, M.F., 2007. Citizens as sensors: the world of volunteered geography. GeoJournal, v. 69, no. 4, 211–221. Goodchild, M. F., and Li, L.. 2012. Assuring the Quality of Volunteered Geographic Information. Spatial Statistics, 1 (May). Elsevier Ltd, 110–20.
Haklay, M. 2010. How good is volunteered geographical information? A comparative study of OpenStreetMap and Ordnance Survey dataset. Environment and Planning B: Planning and Design, v. 37, 682-703.
Heipke, C., 2010. Crowdsourcing geospatial data. ISPRS Journal of Photogrammetry and Remote Sensing, v. 65, no. 6, 550–557.
Huang, K.L., Kanhere, S.S., and Hu, W., 2010, Are You Contributing Trustworthy Data ? The Case for a Reputation System in Participatory Sensing. In Proceedings of the 13th ACM international conference on Modeling, analysis, and simulation of wireless and mobile systems, ACM New York, NY, USA ©2010, 14–22.
Jackson, S., Mullen, W., Agouris, P., Crooks, A., Croitoru, A., and Stefanidis, A., 2013. Assessing Completeness and Spatial Error of Features in Volunteered Geographic Information. ISPRS International Journal of Geo-Information, v. 2, no. 2, 507–530.
Keßler, C., Theodore, R., and Groot, A. De, 2013. Trust as a Proxy Measure for the Quality of Volunteered Geographic Information in the Case of OpenStreetMap, in Vandenbroucke, D., Bucher, B., and Crompvoets, J. eds., Geographic Information Science at the Heart of Europe, Lecture Notes in Geoinformation and Cartography, Springer International Publishing, Cham, 21–37.
Kuhn, W., 2007. Volunteered geographic information and GIScience, in NCGIA, UC Santa Barbara, CA, December 13-14, 2007.
Ostermann, F.O., and Spinsanti. L., 2011. A Conceptual Workflow for Automatically Assessing the Quality of Volunteered Geographic Information for Crisis Management. In Proceedings of the 14th AGILE International Conference on Geographic Information Science.
Spinsanti, L., and Ostermann, F., 2013. Automated geographic context analysis for volunteered information. Applied Geography, v. 43, 36–44.
Vandecasteele, A. and Devillers, R. 2013. Improving Volunteered Geographic Data Quality Using Semantic Similarity Measurements. International Archives of the Photogrammetry, Remote Sensing and Spatial Information Sciences, Volume XL-2/W1, 2013 8th Int. Symposium on Spatial Data Quality , 30 May - 1 June 2013, Hong Kong. Wiggins, A., Newman, G., Stevenson, R.D. and Crowston, K. 2011. Mechanisms for Data Quality and Validation in Citizen Science. In Proceedings of the 2011 IEEE Seventh International Conference on E-Science Workshops, 14–19.