BEYOND FLOOD HAZARD MAPS: DETAILED FLOOD CHARACTERIZATION WITH
REMOTE SENSING, GIS AND 2D MODELLING
J. R. Santillan, J. T. Marqueso, M. Makinano-Santillan and J. L. Serviano
CSU Phil-LIDAR 1 Project, Caraga Center for Geo-informatics, College of Engineering and Information Technology, Caraga State University, Ampayon, Butuan City, Agusan del Norte, Philippines – [email protected],
[email protected], [email protected], [email protected]
KEY WORDS: Flood, Hazards, LiDAR, Flood Simulation, HEC RAS, 2D Modelling
ABSTRACT:
Flooding is considered to be one of the most destructive among many natural disasters such that understanding floods and assessing the risks associated to it are becoming more important nowadays. In the Philippines, Remote Sensing (RS) and Geographic Information System (GIS) are two main technologies used in the nationwide modelling and mapping of flood hazards. Although the currently available high resolution flood hazard maps have become very valuable, their use for flood preparedness and mitigation can be maximized by enhancing the layers of information these maps portrays. In this paper, we present an approach based on RS, GIS and two-dimensional (2D) flood modelling to generate new flood layers (in addition to the usual flood depths and hazard layers) that are also very useful in flood disaster management such as flood arrival times, flood velocities, flood duration, flood recession times, and the percentage within a given flood event period a particular location is inundated. The availability of these new layers of flood information are crucial for better decision making before, during, and after occurrence of a flood disaster. The generation of these new flood characteristic layers is illustrated using the Cabadbaran River Basin in Mindanao, Philippines as case study area. It is envisioned that these detailed maps can be considered as additional inputs in flood disaster risk reduction and management in the Philippines.
1. INTRODUCTION
1.1 Background
Flooding is considered to be one of the most destructive among many natural disasters, bringing catastrophic and costly damages to human lives, infrastructure and the environment all over the world. As the most frequently occurring natural disaster impacting more people worldwide than any other natural disasters (Banks et al., 2014), understanding floods and assessing the risks associated to it, including the development of forecasting and warning systems, and preparation and implementation of flood mitigation and adaptation measures, have become more and more important nowadays (Banks et al., 2014; Dale et al., 2012; dos Santos and Tavares, 2015; Son et al., 2015; Adams and Pagano, 2016).
Remote Sensing (RS) and Geographic Information System (GIS) have become effective geospatial tools for assessing hazards and risks associated with flood disasters (Manfré et al., 2012), most especially for the simulation of flood characteristics, and for the assessment of its social, economic and environmental consequences (Albano et al., 2015). These technologies have been used, either on their own or in a synergistic manner, to develop numerical flood simulation models that can aid in reconstructing past flood events for the purpose of mapping inundation levels and extents as well as to identify elements at risks (e.g., Amora et al., 2015; Makinano-Santillan et al., 2015; Makinano-Santillan et al., 2016); in identifying flood-prone areas for the purpose of planning for disaster mitigation and preparedness (Asare-Kyei et al., 2015; Gashaw and Legesse, 2011; Pradhan, 2010; Samuel et al., 2014); and most especially in flood forecasting and early warning (Mioc et al., 2008; Sharif and Hashmi, 2006), among many other uses
and applications. In these applications, RS has become an important source of data/information necessary to build flood models and conduct assessment of flood risks such as topography, land-cover, location of built-up areas and other elements that are at risk to flooding (e.g., roads, buildings, and bridges). On the other hand, GIS allows easier handling and integration of various spatial and non-spatial datasets, automates the development of the flood models, facilitates risk analyses (e.g., identification of communities, roads and cultivated lands that may be endangered in different levels of flooding), and efficient generation of inundation maps and statistics that can be used as bases in various stages of flood disaster management (e.g., from preparedness to mitigation).
Light Detection and Ranging (LiDAR) data, in particular, has been widely used for flood hazard mapping studies due to its highly-accurate depiction of features within the landscape (Turner et al., 2013). The accuracy and spatial resolution of the LiDAR data also allow the identification of subtle but important topographic variations that influence flow paths (French, 2003). In the US, the increasing affordability of LiDAR data have made more feasible the updating of flood studies and large-scale mapping efforts (Gilles et al., 2012).
1.2 Flood Hazard Mapping in the Philippines
its people for such natural disasters, the Disaster Risk and Exposure Assessment for Mitigation (DREAM) Program was formed in 2011 to produce up-to-date, detailed, and high-resolution flood hazard maps for the 18 critical major river basins in the Philippines (UP TCAGP, 2015). Its follow-up program called Phil-LiDAR 1 (Flood Hazard Mapping of the Philippines using LiDAR) continues to generate these maps for the remaining 257 minor river basins (UP DREAM, 2016).
The UP DREAM and Phil-LiDAR 1 Programs’ flood mapping methodology includes the development of watershed hydrologic model for each river basin based on the Hydrologic Engineering Center Hydrologic Modelling System (HEC HMS) and using this model to compute the discharge values that quantifies the amount of water entering the floodplain, and then using these discharge values as inputs in two-dimensional flood simulations using FLO-2D GDS Pro to generate static flood hazard and depth maps of the flood plains (e.g., UP TCAGP, 2015). The major data inputs in these simulations and flood maps generations are 1 m x 1 m spatial resolution elevation datasets which were acquired through the use of state-of-the-art airborne LiDAR technology, and appended with Synthetic-aperture radar (SAR) in some areas (UP TCAGP, 2015). The flood maps generated by the programs are accessible in open and GIS-ready formats through the LiDAR Portal for Archiving and Distribution (LiPAD; http://lipad.dream.upd.edu.ph), for use by Local Government Units (LGUs), National Government Agencies (NGAs), members of the academe, and researchers, among others.
At present, the flood mapping methodology implemented by the Programs is limited to the generation of flood depth and hazard maps. These maps show the maximum flood depths and flood hazard level that can be expected for 24-hour duration rainfall events of varying return period (e.g., 5-, 25-, and 100-year return period). The flood hazard maps, in particular, show the level of flood hazard which are categorized into three: low (for flood depths of 0.5 m and below), medium (flood depths greater than 0.5 m to 1.5 m), and high (for flood depths greater than 1.5 m). Maps of some basic flood characteristics that are also useful in flood disaster management are currently not being generated and published, although the 2D model used is capable of producing such layers. These additional layers include flood velocities, flood arrival times, flood duration, flood recession times, and the percentage within a given period of flood event a particular location is inundated. Although flood depth is often the primary input for evaluation of flood impacts, other flooding characteristics should not be ignored because they are also important for an extensive understanding of the flood influences. For example, high velocity and long duration floods can lead to harmful consequences like destruction of man-made structures, river bank and bed erosions and water pollution. All of these may lead to economic loss, people affected, environmental degradation and ecological imbalance (Ahmadisharaf et al., 2015). In Japan, information on flood characteristics such as the flow rate of flood waters, speed of propagation to downstream areas, inundation duration, and increase rate of inundation depth at water storage areas are added to flood hazard maps as an effective way to encourage residents to take evacuation actions on an appropriate timing (MLIT, 2005). In the Netherlands, flood probabilities and flood characteristics such as flow velocity, rising rate, maximum water depth, flood duration, and their combinations are used to calculate two objective measures of flood hazards namely, the flood fatality hazard and the flood damage hazard (de Bruijn et al., 2015).
1.3 Motivations and Objectives
High resolution flood hazard maps available for the Philippines are undeniably becoming very valuable in identifying areas/localities that can be flooded and the communities (and structures) that can be affected if rainfall events of varying volume and intensity (i.e., varying rain return periods) will fall over a river basin. Their use for flood preparedness and mitigation can be maximized by supplementing and enhancing the currently available information these maps portrays.
In this paper, we present and applied an approach based on RS, GIS and two-dimensional (2D) flood modelling to generate new flood layers in addition to the usual flood depths and hazard maps. The availability of these new layers of flood information are crucial for better decision making before, during, and after occurrence of a flood disaster. The need for these layers of information is also becoming urgent in the context of climate change impact, adaptation and mitigation. As a changing climate leads to changes in the frequency, intensity, spatial extent, duration, and timing of extreme weather and climate events, a better characterization of flooding event caused by these extreme rainfall scenarios is very critical. For example, having a map showing flood arrival times for a particular rainfall event is very critical for early warning of communities, particularly for identifying households that needs to be evacuated within an allowable period of time. Combined information on flood depths and velocities will help communities to be prepared for the degree of hazard they are expected to encounter. Information on flood duration and recession times will also be helpful in formulating decisions on how much time evacuated communities needs to stay in evacuation centers.
2. DESCRIPTION OF THE APPROACH
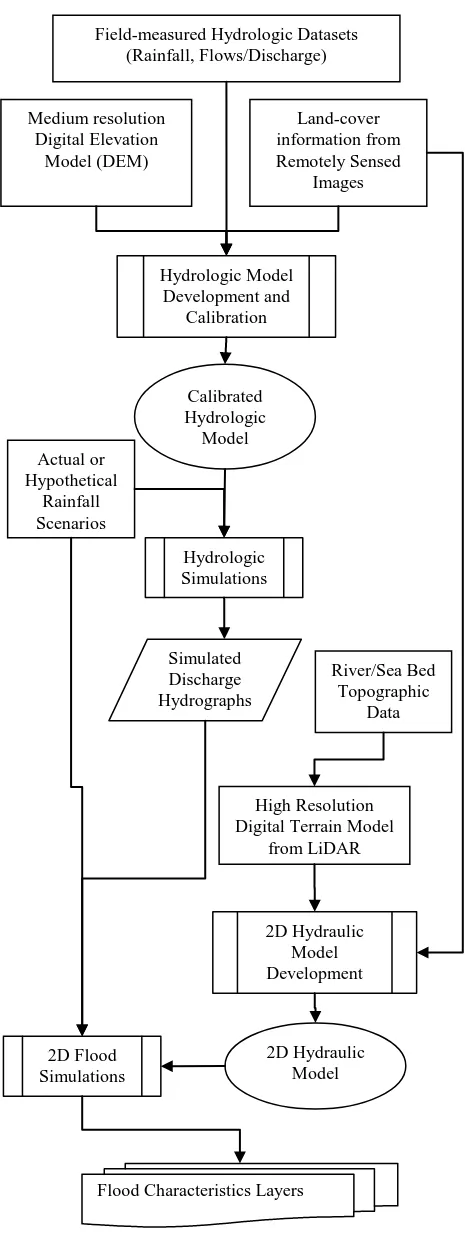
The development of the hydrologic model requires a Digital Elevation Model (DEM) for sub-basin delineations and for derivation of topography-related parameters of the model such slope and elevation; and a landcover map from remotely-sensed images for the derivation of land-cover-related model parameters such as Manning’s surface roughness coefficient, and Curve Number for runoff volume computation. The model development and parameter maps generation can be done using GIS software (e.g., USACE HEC, 2003). To ensure that the hydrologic model can accurately simulate discharge coming from the upstream watersheds, it is subjected to calibration where the model’s parameters are adjusted such that it simulates the observed discharge within acceptable levels of accuracy (Moriasi et al., 2007). Once calibrated, the model can then be used to simulate discharge hydrographs that would result from various rainfall scenarios (which can be actual rainfall events or hypothetical ones like 24-hour duration rainfall events of varying return periods).
The development of the 2D hydraulic model requires as major inputs the high resolution Digital Terrain Model (DTM) derived from LiDAR and integrated with river and sea bed topographic information, and the same land-cover map initially used in hydrologic model development. Using a bed-integrated DTM as source of topographic information would ensure that the 2D model can accurately calculate how water will flow along the river and in the flood plains (in case there is an overflow). A 2D hydraulic model was chosen due to the many advantages that this type of model has over a 1D model. 1D’s suitability in flood simulation and mapping is hindered by a number of factors: the flow path (direction of flow) must be defined beforehand, a description that is not always realistic e.g. on flat areas with large variations in water levels; a 1D model does not provide details on velocity distribution, for instance across flood plains; and 1D models may falsify reality especially in the case when flooding waters leave the main channels, reaching floodplains, with none returning to the rivers, having their own ways over the watershed or the floodplain. These limitations can be very well addressed by 2D models. In fact, aside from spatially-distributed flood depths and velocities, only 2D hydraulic models can output other important flood characteristics such as flood arrival times, flood duration, flood duration, flood recession times, and percentage time inundated (USACE HEC, 2016a).
With the availability of a calibrated hydrologic model and a fully-configured 2D hydraulic model, flood events can now be simulated. First, the calibrated hydrologic model will generate the discharge hydrographs using actual or hypothetical rainfall data as inputs. The output hydrographs will then be used as input (i.e., boundary conditions) to the 2D hydraulic model. Rainfall information can also be used as additional boundary condition of the model so that not only the overflowing of the river can be simulated but also on how rain falling on the ground will get infiltrated, or get stagnant (e.g., in a depression), or continue to flow toward areas of lower elevation. Tidal effects (especially if the area is near the sea) can also be accounted by the 2D model by inputting tidal data as additional boundary condition.
From a successful simulation, the 2D hydraulic model can generate highly detailed maps showing flood depths, flood velocities, flood arrival times, flood duration, flood recession times, and the percentage within a given flood event period a particular location is inundated.
Medium resolution
Figure 1. An illustration of the approach to generate detailed flood characteristics.
River/Sea Bed Topographic
3. APPLICATION OF THE APPROACH
3.1 Case Study Area
To illustrate the application of the approach, we selected as case study area the Cabadbaran River Basin (CRB) and the nearby Pandanon River and Caasinan River Watersheds in Agusan del Norte, Caraga Region, Mindanao, Philippines (Figure 2). With a total area of 238 km2, these river basins and watersheds cover a major portion of Cabadbaran City which was reported to be one of those affected by flooding caused by tropical storm
Seniang (International name: Jangmi) in the December 2014.
TS Seniang made landfall, and the heavy to torrential rains associated with it triggered massive flooding and caused fatalities in many localities (NDRRMC, 2015). In the upstream watersheds of Cabadbaran River Basin, Seniang brought a total rainfall of 356 mm. Rainfall intensity peaked on December 29 where 259 mm where recorded. In the downstream portion, 123
mm were recorded at the Cabadbaran City Hall station, of which 80 mm were recorded on December 29 (Santillan and Makinano-Santillan, 2015).
3.2 Hydrologic and 2D Hydraulic Models Used
We utilized two popular hydrologic and hydraulic modelling systems for flood-related studies which are the HEC HMS and HEC RAS (River Analysis System), respectively. These two software suites are free. HEC HMS is a generalized modelling system designed to simulate the precipitation-runoff processes of watershed systems with a wide range of applicability including large river basin water supply and flood hydrology, and small urban or natural watershed runoff (USACE HEC, 2010). For this study, we used HEC HMS Version 3.5.
Figure 2. Series of maps showing the study area which consists of Cabadbaran River Basin and the watersheds of Pandanon and Caasinan Rivers in Agusan del Norte, Caraga Region, Mindanao, Philippines, including the track of TS Seniang when it made land
On other hand, HEC RAS is an integrated system of software designed to perform one-dimensional (1D), 2D or combined 1D-2D hydraulic calculations for a full network of natural and constructed channels (USACE HEC, 2016b). One of the most common uses of HEC RAS is flood inundation mapping provided that inflow data is available (e.g., from hydrological simulations or actual flow measurements) to serve as the model’s boundary conditions (Hicks and Peacock, 2005). Before Version 5 was released in 2016, HEC RAS can only do 1D hydraulic calculations, and would require river cross-sections and Manning’s roughness coefficients as its geometric parameters. With the release of Version 5, these limitations can now be addressed because of the availability of a 2D module in HEC RAS which can generate spatially-distributed flood depths, velocities, flood arrival times, flood duration, flood recession times, and percentage time inundated (USACE HEC, 2016a). Because of the very recent release of HEC RAS 5, there is a great opportunity to explore its potential as hydraulic model in generating spatially-distributed flood characteristics.
3.3 HEC HMS Hydrologic Model Development and Calibration
The hydrologic model based on HEC HMS Version 3.5 has four sub-models to simulate the basic hydrologic processes of runoff generation from rainfall, its transformation and combination with baseflow, and its routing towards the outlet (USACE, 2000). These four components are (i) infiltration loss using the SCS Curve Number method, (ii) direct runoff using the SCS Unit Hydrograph method, (iii) baseflow using the Exponential Baseflow Recession method, and (iv) channel routing using the Muskingum-Cunge method. Modelling in HEC-HMS relies in three specific components: a basin model, a meteorological model, and a set of control specifications. The basin model is the physical representation of watersheds (termed as “sub-basin” in HEC HMS) and river systems into hydrological elements, each one configured with its proper method for the simulation of hydrologic processes. A meteorological model consists of a time series data of rainfall used for the simulation. The set of control specifications determines the simulation time step and period or duration.
HEC-HMS’s pre-processor, HEC-GeoHMS (version 1.1), was used to prepare the basin model file. HEC-GeoHMS is an extension of ArcView GIS software that allows users to visualize spatial information, document watershed characteristics, perform spatial analysis, delineate watershed boundaries, and construct inputs to hydrologic models (USACE HEC, 2003). A 10-m SAR DEM was used for sub-basin delineations and for derivation of topography-related parameters of the model. Images acquired by the Landsat 8 satellite were also utilized to derive a landcover map using Maximum Likelihood classification. The landcover map is necessary for the derivation of land-cover-related model parameters such as surface roughness coefficient, and runoff/infiltration capacities. River width and cross-section data obtained from field surveys as well as those extracted from 1-m resolution LiDAR-derived Digital Terrain Model (DTM) were also used to estimate the channel routing parameters of the model. The basin model file was imported into HEC HMS 3.5 for further model development (e.g., for the setup of a meteorological model, and control specifications), and for hydrologic simulations.
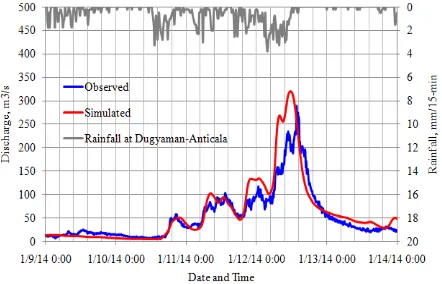
The HEC HMS model was calibrated using observed flow data for the January 9-14, 2014 at Cabadbaran Bridge and using
rainfall data recorded by a rain gauge located in Dugyaman-Anticala which is the nearest station that can best represent the rain falling in the upstream portions of the river basin. As shown in Figure 3, it can be said that the hydrologic model performed satisfactorily, although the simulated hydrograph overestimated peak discharge and the time of peak is simulated earlier than the observed time of peak. The comparison between the observed and simulated hydrographs revealed a Nash-Sutcliffe Model of Efficiency of 0.72 indicating that the hydrologic model can simulate discharge hydrographs within acceptable levels of accuracy (Moriasi et al., 2007).
After a successful calibration, the model was used to simulate discharge hydrographs for the December 29-30, 2014 period which corresponds to the occurrence of TS Seniang. The data recorded by Dugyaman-Anticala rainfall station was utilized in the hydrologic simulations. The discharge hydrographs (Figure 4) computed by the model for Cabadabaran Cabadbaran Upstream, and Pandanon Upstream (see Figure 2 for their locations) were then used in the analysis and as inputs into the 2D hydraulic model.
Figure 3. Graph showing the observed and HEC HMS hydrologic model simulated discharge hydrographs at Cabadbaran Bridge for the January 9-14, 2014 simulation
period.
Figure 4. Discharge hydrographs simulated by the HEC HMS model for Cabadbaran Upstream and Pandanon Upstream for
3.4 HEC RAS Hydraulic Model Development
For the 2D hydraulic model, river bed topography (obtained from bathymetric surveys), sea bed topography (obtained from a NAMRIA topographic map), LiDAR DTM, building footprints (with top elevation) extracted from LiDAR Digital Surface Model (DSM), and the same landcover map derived from Landsat 8 OLI satellite image were used as major inputs into HEC RAS 5. The river and sea bed topographic datasets and building footprints were integrated into the LiDAR DTM to ensure that the 2D model can account for the effects of river and sea bed topography as well as for the presence of buildings in flow simulation (e.g., in computing depth, speed and direction of flow). In the absence of observed tidal data, predicted tidal data at Butuan Bay was also used as boundary condition input into the 2D model to account for the effects of tide.
The 2D model was developed by creating first the 2D flow area (i.e., 2D model domain) that defines the boundary for which the 2D computation will be done. It has an approximate area of 45.54 km2 and was discretized into 15 m by 15 m mesh/cell size. The computational domain consists of 201,852 cells. The 2D hydraulic model has 4 boundary conditions, in which 2 are inflows from the upstream of the rivers (using HEC HMS-simulated discharge hydrographs), 1 tidal boundary condition at the sea, and 1 precipitation condition (rainfall recorded at Cabadbaran City Hall). The model was run from December 29, 2016 00:00 to December 30, 2016 12:00 (total of 36 hours of simulation period), with a computation interval (time step) of 30 seconds. Model outputs were generated at 5-minute intervals. Although the mesh size was set at 15x15-m, the 2D module of HEC RAS 5 can produce various flood characteristic layers at the same resolution of the input DTM which is 1x1 m using a “sloping water surface” interpolation method (USACE HEC, 2016a).
4. DETAILED FLOOD CHARACTERSTICS FROM 2D SIMULATIONS
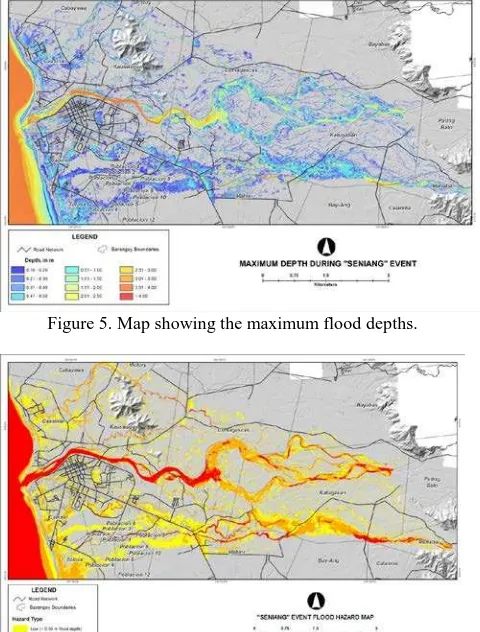
4.1 Maximum Flood Depths
The maximum flood depth map generated by the 2D model for the Seniang event is shown in Figure 5. This map was derived by getting the maximum depth in each cell regardless of the time when that depth was reached during the simulation period. For the Seniang event, it can be observed that majority of the flooded areas were computed by the 2D model to have depths ranging from 10 cm to 1 m. This map is useful in flood preparedness in case a rainfall event similar to Seniang is expected to occur. With this map, the community can be informed on which areas needs to be alerted and prepared for evacuation, or which areas to be avoided.
4.2 Flood Hazard Based on Maximum Depths
A flood hazard map based on maximum flood depths is shown in Figure 6. In this map, the level of flood hazard are categorized into three: low (for flood depths of 0.5 m and below), medium (flood depths greater than 0.5 m to 1.5 m), and high (for flood depths greater than 1.5 m). This type of map is an example of the flood hazard maps that are currently available for the Philippines.
Figure 5. Map showing the maximum flood depths.
Figure 6. Map of flood hazard based on maximum flood depths.
4.3 Maximum Flood Velocities
Another one of the most important outputs of 2D flood modelling is the generation of a maximum velocity map (Figure 7). This map would tell us how fast the water is traveling at a particular location. In the case of Seniang event, higher velocities are found along the rivers and streams, with the maximum velocities located in areas of inflows. In the floodplain, velocities range from almost 0 to 1 m/s. Flood velocity maps, in addition to flood depth maps, are vital in flood risk management because they indicate the level of harm the community is exposed to.
4.4 Flood Arrival Time
Flood arrival time maps represent the computed time (in hours or days) from a specified time in the simulation when the water depth reaches a specified inundation depth (USACE HEC, 2016a). For the case of the Seniang event, we were able to generate two flood arrival time maps, one showing the number of hours a particular location gets inundated by at least 0.10 m from the start of the simulation period (Figure 8), and another one from the time of peak flow at Cabadbaran Upstream (Figure 9). It can be observed that for the Seniang event, many areas get flooded within 24 hours (Figure 8). The areas that will get flooded first (small arrival times) can also be easily identified. Another important information that we can get from this map, especially from Figure 9, is that many areas are already flooded even before peak flow was reached at the Cabadbaran Upstream.
Figure 8. Map showing flood arrival times from the start of the simulation period of the Seniang event.
Figure 9. Map showing flood arrival times from the start of the simulation period of the Seniang event.
4.5 Flood Duration
The flood duration map shown in Figure 10 provides the estimated time a particular location will remain flooded with a flood depth of at least 0.10 m. This information is useful, for example, in estimating how much time is needed for an evacuated community to return back to their respective houses, or for estimating the damage to flooded agricultural areas.
4.6 Flood Recession Time
The flood recession map shown in Figure 11 indicates the number of hours flood water will recede at various locations.
Based on the 2D model computations, it can be observed that flood waters due to the Seniang event will take more than 24 hours to recede. It has the same importance as to that of the flood duration map.
4.7 Percent Time Inundated
The percentage time inundated map show in Figure 12 indicates the percentage of time within the simulation period that a particular location is flooded. For the case of the Seniang event where the simulation period was 36 hours, a 100% value would mean that for the whole 36 hours, that particular location is flooded by at least 0.10 m depth.
Figure 10. Map of flood duration for the Seniang event.
Figure 11. Map of flood recession for the Seniang event.
5. CONCLUDING REMARKS
We have shown in this paper that beyond the usual flood depth and hazard maps, there are other flood characteristics that can be generated through an integrated RS, GIS and HEC RAS 2D numerical modelling approach. Using the Cabadbaran River Basin as case study area, several high resolution flood characteristic map were produced that included flood velocities, arrival times, recession times, inundation duration, and percent time inundated.
The approach we presented in this work may be considered as a potential extension of the current methodology being adopted by the Philippines in its flood hazard mapping initiatives, particularly through the UP DREAM/Phil-LiDAR 1 Programs. The generation of additional flood characteristics layers through the use of high spatial resolution LiDAR datasets and 2D modelling can expand the utility of the currently available flood hazard maps. These layers have important implications in various levels of flood disaster and risk management, especially in formulating preparedness, evacuation as well as mitigation strategies.
ACKNOWLEDGEMENTS
This work is an output of the Caraga State University (CSU) Phil-LiDAR 1.B.14 project under the “Phil-LiDAR 1. Hazard Mapping of the Philippines using LiDAR” program funded by the Department of Science and Technology (DOST) and monitored by the Philippine Council for Industry, Energy and Emerging Technology Research and Development (PCIEERD). The SAR DEM and the LiDAR DTM and DSM including the river bathymetric data used in this work were provided by the University of the Philippines Disaster Risk and Exposure for Mitigation (UP DREAM)/Phil- LIDAR 1 Program. The assistance extended by the CSU-Phil-LIDAR 1 personnel and the Local Government Units in the Cabadbaran River Basin during the conduct of hydrological measurements are also acknowledged. We thank two anonymous reviewers for their insightful comments and suggestions, which helped us to improve the clarity of this paper.
REFERENCES
Abon, C. C., Kneis, D., Crisologo, I., Bronstert, A., David, C. P. C., Heistermann, M., 2015. Evaluating the potential of radar-based rainfall estimates for streamflow and flood simulations in the Philippines. Geomatics, Natural Hazards and Risk, pp. 1– 16.
Adams, T. E., Pagano, T. C., 2016. Flood Forecasting: A
Global Perspective. Elsevier, United Kingdom.
Ahmadisharaf, E., Kalyanapu A. J., Chung E., 2015. Evaluating the effects of inundation duration and velocity on selection of flood management alternatives using multi-criteria decision making. Water Resources Management, 29, pp. 2543– 2561.
Albano, R., Mancusi, L., Sole, A., Adamowski, J., 2015. Collaborative strategies for sustainable EU flood risk management: FOSS and geospatial tools – challenges and
opportunities for operative risk management. ISPRS
International Journal of GeoInformation, 4(4), pp. 2704-2727.
Amora, A., Santillan, J. R., Makinano-Santillan, M., Marqueso, J. T., 2015. Flood hazard mapping of Mainit-Tubay River Basin, Mindanao, Philippines using LiDAR and numerical models. In: 36th Asian Conference on Remote Sensing 2015, Quezon City, Philippines.
Asare-Kyei, D., Forkour, D., Venue, V., 2015. Modelling flood hazard zone at the sub-district level with the rational model integrated with GIS and Remote Sensing approaches. Water, 7(7), pp. 3531-3564.
Banks, J.C., Camp, J. V., Abkowitz, M. D., 2014. Adaptation planning for floods: a review of available tools. Natural
Hazards, 70(2), pp. 1327–1337.
Dale, M., Wicks, J., Mylne, K., Pappenberger, F., Laeger, S., Taylor, S., 2012. Probabilistic flood forecasting and decision-making: an innovative risk-based approach. Natural Hazards, 70(1), pp. 159–72.
de Bruijn, K. M., Klijn, F., Pas, B., Slager, C. T. J., 2015. Flood fatality hazard and flood damage hazard: combining multiple hazard characteristics into meaningful maps for spatial planning. Natural Hazards and Earth System Sciences, 15(6), pp.1297-1309.
dos Santos, P. P., Tavares, A. O., 2015. Basin flood risk management: a territorial data-driven approach to support decision-making. Water, 7(2), pp. 480–502.
DPWH, 2014. Water and Floods: A Look at Philippine Rivers
and Flood Mitigation Efforts, Department of Public Works and
Highways, Manila, Philippines.
French, J.R., 2003. Airborne LiDAR in support of geomorphological and hydraulic modelling. Earth Surface
Processes and Landforms, 28(3), pp. 321-335.
Gashaw, W., Legesse, D., 2011. Flood hazard and risk assessment using GIS and Remote Sensing in Fogera Woreda, Northwest Ethiopia. In: Nile River Basin, Springer Netherlands, pp. 179-206.
Gilles, D., Young, N., Schroeder, H., Piotrowski, J., Chang, Y. J., 2012. Inundation mapping initiatives of the Iowa flood center: Statewide coverage and detailed urban flooding analysis.
Water, 4(1), pp.85-106.
Hicks, F. E., Peacock, T., 2005. Suitability of HEC-RAS for flood forecasting. Canadian Water Resources Journal, 30, pp. 159–174.
Lagmay, A. M. F., 2012. Disseminating near real-time hazards information and flood maps in the Philippines through Web-GIS. DOST-Project NOAH Open-File Reports, 1, pp. 28-36.
Makinano-Santillan, M., Santillan, J. R., Amora, A., Marqueso, J. T., Cutamora, L. C., Serviano, J. L., Makinano, R.M., Asube, L. C. S., 2015. Assessing the impacts of flooding in Tago River Basin, Mindanao, Philippines through integration of high resolution elevation datasets, Landsat image analysis, and numerical modelling. In: 36th Asian Conference on Remote
Manfre, L. A., Hirata, E., Silva, J. B., Shinohara, E. J., Giannotti, M.A., Larocca, A. P. C., Quintanilha, J. A., 2012. An analysis of geospatial technologies for risk and natural disaster management. ISPRS International Journal of Geo-Information, 1, pp. 166-185.
Mioc, D., Nickerson, B., MacGillivray, E., Morton, A., Anton, F., Fraser, D., Tang, P., Liang, G., 2008. Early warning and
mapping for flood disasters. In: The International Archives of
the Photogrammetry, Remote Sensing and Spatial Information Sciences, Beijing, China, Vol. XXXVII, Part B4, pp.
1507-1512.
MLIT, 2005. Flood Hazard Mapping Manual in Japan. Flood Control Division, River Bureau, Ministry of Land, Infrastructure and Transport (MLIT), Japan.
Moriasi, D. N., Arnold, J. G., Van Liew, M. W., Bingner, R. L., Harmel, R. D., Veith, T. L., 2007. Model evaluation guidelines
for systematic quantification of accuracy in watershed
simulations. Transactions of the ASABE, 50, pp. 885-900.
NDRRMC, 2015. SitRep No. 22 re Effects of Tropical Storm SENIANG. National Disaster Risk Reduction and Management Council. http://www.ndrrmc.gov.ph/ (10 January 2015)
Pradhan, B., 2010. Flood susceptible mapping and risk area delineation using logistic regression, GIS and remote sensing.
Journal of Spatial Hydrology, 9(2), pp. 9-18.
Samuel, K. J., Ayeni, B., Adebayo, O. H., Adagbasa, E. G., 2014. A geospatial analysis of flood risks and vulnerability in Ogun Osun river basin, Nigeria. In: Landscape Ecology and
Water Management, pp. 307-320.
Santillan, J. R., Makinano-Santillan, M., 2015. Analyzing the impacts of tropical storm-induced flooding through numerical model simulations and geospatial data analysis. In: 36th Asian
Conference on Remote Sensing 2015, Quezon City, Philippines.
Santillan, J. R., Amora, A. M., Makinano-Santillan, M., Marqueso, J. T., Cutamora, L. C., Serviano, J. L., Makinano, R., 2016. Assessing the impacts of flooding caused by extreme rainfall events through a combined geospatial and numerical modelling approach. In: The International Archives of the
Photogrammetry, Remote Sensing and Spatial Information
Sciences, Prague, Czech Republic, Vol. XLI-B8, pp.
1271-1278.
Sharif, H., Hashmi, M. A., 2006. Use of RS & GIS in flood forecasting and early warning system for Indus Basin. In: IEEE
International Conference on Advances in Space Technologies,
pp. 21-24.
Son, C.-H., Baek, J.-I, Ban, Y.-U, Ha, S.-R, 2015. The effects of mitigation measures on flood damage prevention in Korea.
Sustainability, 7(12), pp. 16866–16884.
Turner, A. B. Colby, J. D., Csontos, R. M., Batten, M., 2013. Flood modelling using a synthesis of multi-platform LiDAR data. Water, 5, pp. 1533-1560.
UP DREAM, 2016. The UP DREAM Program, https://dream.upd.edu.ph/about/ (29July2016).
UP TCAGP, 2015. DREAM Flood Forecasting and Flood
Hazard Mapping for Iponan River Basin, Disaster Risk and
Exposure Assessment for Mitigation (DREAM) Program, DOST Grants-In-Aid Program, UP Training Center for Applied Geodesy and Photogrammetry, Quezon City, Philippines.
USACE HEC, 2000. Hydrologic Modelling System HEC-HMS
Technical Reference Manual, United States Army Corps of
Engineers, Hydrologic Engineering Center, Davis, California.
USACE HEC, 2003. Geospatial Hydrologic Modelling
Extension HEC-GeoHMS User’s Manual, Version 1.1, United
States Army Corps of Engineers, Hydrologic Engineering Center, Davis, California.
USACE HEC, 2010. Hydrologic Modelling System HEC HMS
User’s Manual Version 3.5, Hydrologic Engineering Center,
United States Corps of Engineer, Davis, California, USA.
USACE HEC, 2016a. HEC RAS River Analysis System 2D
Modelling User’s Manual Version 5.0, Hydrologic Engineering
Center, United States Corps of Engineer, Davis, California, USA.
USACE HEC, 2016b. HEC RAS River Analysis System User’s
Manual Version 5.0, Hydrologic Engineering Center, United