Clustering Analysis of Officer's Behaviours in London Police Foot Patrol Activities
J. Shena, T. Chengb
a
SpaceTimeLab for Big Data Analytics, Department of Civil, Environmental and Geomatic Engineering, University College London, Gower Street, London WC1E 6 BT, UK - [email protected]
b
SpaceTimeLab for Big Data Analytics, Department of Civil, Environmental and Geomatic Engineering, University College London,Gower Street, London WC1E 6 BT, UK - [email protected]
KEY WORDS: Clustering, Behaviour Pattern, Similarity, GPS Trajectory, Region of Interest
ABSTRACT:
In this small paper we aim at presenting a framework of conceptual representation and clustering analysis of police officers’ patrol pattern obtained from mining their raw movement trajectory data. This have been achieved by a model developed to accounts for the spatio-temporal dynamics human movements by incorporating both the behaviour features of the travellers and the semantic meaning of the environment they are moving in. Hence, the similarity metric of traveller behaviours is jointly defined according to the stay time allocation in each Spatio-temporal region of interests (ST-ROI) to support clustering analysis of patrol behaviours. The proposed framework enables the analysis of behaviour and preferences on higher level based on raw moment trajectories. The model is firstly applied to police patrol data provided by the Metropolitan Police and will be tested by other type of dataset afterwards.
1. INTRODUCTION
Thanks to the more and more ubiquitously used telecommunication and GPS technologies, large scale data collection of the ever changing position of moving objects has become technically feasible and economically affordable.
Trajectory data can be generated by service providers, social media services, life logging applications, as well as government and nongovernment organizations. In this research, the Camden Borough of London is chosen as the study area. The movement data are provided by the Metropolitan Police Automatic Personnel Location System (APLS), which records officers’ location stamps with the GPS-integrated radios on their shoulders. The dataset covers a period of 84 days and contains 241525 records including information such as call signs, device IDs, as well as the locations and times of all 745 officers active in that period. Usually, the sampling rate of the system is one update every 10 minutes. These data were collected typically for operational purpose in police patrol and fast responding activities and were not used for knowledge extraction and therefore cannot directly support better and deeper understanding of officers’ behaviours.
The approach presented in this paper aims at 1) extracting spatio-temporal regions of interests (ST-ROI) in patrol and enriching the semantic meaning of them by associating with geographic background
knowledge such as building and crime information; 2) summarising the users’ movements with ST-ROI model for similarity comparison; 3) clustering analysis on different types of officers based on the defined location-based similarity metric.
2. RELATED WORKS
In their research, the trajectories are defined as sequences of stops and moves from place to place with time tags and semantic meanings in the geographic background. Similar to Andrey’s assumption (Palma, 2009), the logic behind is that the place the user stay and the time when the user stay indicate the interest of her/him. Therefore, the regions where multiple users stop are their common regions of interests (ROI).
Several density-based methods on discovering interesting regions have been used in (Lee, 2013). Li introduced OPTICS (Li, 2008) to take the advantages of both hierarchical and density based clustering to look at ROIs in multiple scales. The density-based approach is also proposed ST-BDSCAN to extended the density based cluster methods to deal with space and time intervals comprehensively.
The similarity of movement patterns are defined in some researches by common visited places, geometric shapes or movement sequence between multiple places. A typical example of place-based similarity is proposed in GeoLife2.0 (Zheng, 2009) as the following equation:
ISPRS Annals of the Photogrammetry, Remote Sensing and Spatial Information Sciences, Volume II-4/W2, 2015 International Workshop on Spatiotemporal Computing, 13–15 July 2015, Fairfax, Virginia, USA
This contribution has been peer-reviewed. The double-blind peer-review was conducted on the basis of the full paper.
(1)
3. PROPOSED METHODOLOGY
3.1 ST-ROI Detection
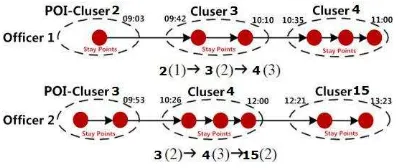
In discovering ROIs for police officers, the basic assumption in many existing works is that officers stop during the patrol, to undertake various tasks in certain circumstances. Therefore, the stopping behaviour is of more interest than the moving factor for ROI detection (Palma, 2009). To this end, the point where the officer stop moving or move slower than the pre-setted speed threshold for more than 20 minutes is considered as a stay point. In the way, the movement process is represented by the stay points and the movement parts concatenating stay points as shown in Fig. 1.
Figure 1. Individual movement history expressed by sequences of visited ST-ROIs.
Not all stops are considered as being interesting in the analysis of patrol or other pedestrian behaviours in urban environment. ST-DBSCAN (Birant, 2007) is then applied on trajectories of all officers to detect their common ROIs generated by high-density aggregation of stays in both spatial and temporal dimensions. Evolving from traditional DBSCAN, ST-DBSCAN is capable of clustering objects according to both distance and time interval thresholds and detecting noises when different densities exist. These characters enable it to detect the life span of ROIs. A shopping centre, for instance, may not be open and meaningful at midnight and hence may not attract many stays at that period. The similar situation also applies to or police patrol activities. Many POIs for officers have their own life spans and the patrols in a day are divided into 3 shifts, each lasting for about 8 hours to give each offer proper working hours. Therefore, the ST-ROIs, of which their life spans run through two different working hour shifts, are also parted as two different ST-ROIs. The activities of each officer are then captured as the movements and stays from one ST-ROI to another, as well as the stay time information of each visit (Figure 2).
With this approach, 25 clusters are detected and considered as ST-ROIs. Some of them are outside the boundary of Camden. (Fig. 2)
Figure 2. ST-ROIs detected by ST-DBSCAN in Camden across 3 shifts.
3.2 Similarity metrics
With the model simplifying the movement of officers (example in Fig.3), the distributions of the time officers spend in their ST-ROIs can be easily acquired. Here, the Jensen-Shannon Divergence (JSD), is used to measure the similarity of the time distribution profile of two officers and indicate the similarity of patrol behaviours.
Figure 3. ST-ROIs detected by ST-DBSCAN in Camden across 3 shifts.
JSD, demonstrated in equation below, is chosen to this end because: first, unlike many similarity metrics used in information theory, the JSD between two distribution P and Q is symmetric, which means the JSD(P,Q) is equal to JSD(Q,P). This character is similar as a metric of distances of objects and makes it suitable to be used as a distance metric in clustering analysis. Second, JSD enables the comparison between distribution profiles even when there are no common visit sequences with high homology, which is a major advantage against existing methods.
ISPRS Annals of the Photogrammetry, Remote Sensing and Spatial Information Sciences, Volume II-4/W2, 2015 International Workshop on Spatiotemporal Computing, 13–15 July 2015, Fairfax, Virginia, USA
This contribution has been peer-reviewed. The double-blind peer-review was conducted on the basis of the full paper.
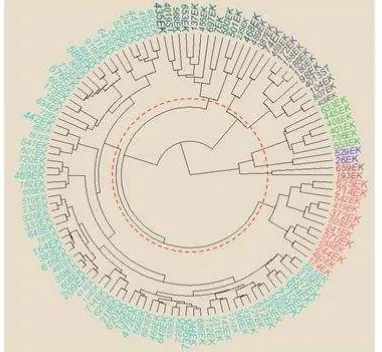
According to the method proposed by Stan (Salvador, 2003), the number of clusters in this sample dataset is set to be 7. The result of the clustering is visualised in fig.4 with the identification numbers representing each officer.
Figure 4. Clustering results of officers with different patrol patterns.
4. EXPERIMENTS
For validation of the clustering results, dunn index is chosen as the evaluation metric to compare the clustering result based on the similarity define by only spatial places and the similarity defined by spatio0temporal regions of interests. As the equation below shows, the dunn index is defined as ratio between the minimal inter-cluster distance between m clusters to the maximal intra-cluster distance in each hierarchical clustering based on two different user similarity metrics.
Figure 5. Cluster result evaluation of two different similarity metrics
The similarity based on only spatial ROIs demonstrates better segregations when the cluster number is below 4 and falls below the performance of the proposed metric based on time allocation on ST-POIs. This is partly because the number of detected spatial ROIs is much less than ST-ROIs and the distribution each user’s number of visits to each ROI is therefore much simpler and adapted to segregation of less cluster numbers. However, a small-cluster-number clustering is not appropriate for semantic explanation of behaviours since a binary or ternary segregation will separate people into groups that are too simple to make since. For instance, if the officers are only separated into one group that is active inside Camden border and another group outside, a lot of potential valuable information will be lost. Another fact that should be noticed is that the good segregation of the data does not necessarily indicate that the result will make sense in practical semantic explanation. To discover the semantic meaning of the generated cluster of time allocation profiles, additional information and further study are required. The differences of behaviour patterns can be explained by associating with data such as public points of interests and land use.
5. CONCLUSIONS AND FUTURE WORKS
In this research, the new definition of moving behaviour similarity provides us with a new approach to take the geographic background in to consideration with comparing the patrol patterns of officers. The framework includes density-based ROI clustering, movement modelling, as well as clustering of behaviours. The Camden APLS data enabled the study that others cannot proceed with due to the lack of modern GPS-enabled policing equipment. The method revealed the movement features of different officers in space and in time and enabled the exaction of higher behaviour information from low-level raw GPS trajectories. It can also be used in other time series geo-tagged data for automatic movement pattern generalisation, traveler interest and routine mining, as well as abnormal behaviour detection so on.
Further works may include using more advanced algorithm to improve the performance of clustering, proposing a new standard to compare and validate the ISPRS Annals of the Photogrammetry, Remote Sensing and Spatial Information Sciences, Volume II-4/W2, 2015
International Workshop on Spatiotemporal Computing, 13–15 July 2015, Fairfax, Virginia, USA
This contribution has been peer-reviewed. The double-blind peer-review was conducted on the basis of the full paper.
result of clustering and similarity metrics and using machine learning methods to detect abnormal and outlier behabiours.
6. ACKNOWLEDGEMENTS
This work is part of the project - Crime, Policing and Citizenship (CPC): Space-Time Interactions of Dynamic Networks (www.ucl.ac.uk/cpc), supported by the UK Engineering and Physical Sciences Research Council (EP/J004197/1). The data provided by Metropolitan Police Service (London) is highly appreciated.
7. REFERENCES
Palma, A., 2009, A clustering-based approach for discovering interesting places in a single trajectory. 2nd International Conference on Intelligent Computing Technology and Automation, (3), pp.429-432
Birant, D., 2007, ST-DBSCAN: An algorithm for clustering spatial-temporal data. Data and Knowledge Engineering, (60), pp.208-221
Lee, I., 2013, Mining points-of-interest association rules from geo-tagged photos. Proceedings of the Annual Hawaii International Conference on System Sciences, Hawaii, USA, pp.1580-1588
Li, Q., 2008, Mining user similarity based on location history. Proceedings of the 16th ACM SIGSPATIAL international conference on Advances in geographic information systems-GIS '08, Irvine, USA,
Salvador, S., 2003, Determining the number of clusters/segments in hierarchical clustering/segmentation algorithms. Florida, USA.
Zheng, Y., 2009, GeoLife2.0: A Location-Based Social Networking Service. 10th International Conference on Mobile Data Management: Systems, Services and Middleware, Taipei, Taiwan. pp.357 - 358
ISPRS Annals of the Photogrammetry, Remote Sensing and Spatial Information Sciences, Volume II-4/W2, 2015 International Workshop on Spatiotemporal Computing, 13–15 July 2015, Fairfax, Virginia, USA
This contribution has been peer-reviewed. The double-blind peer-review was conducted on the basis of the full paper.