Open Geospatial Consortium
35 Main Street, Suite 5Wayland, MA 01778 Telephone: +1-508-655-5858
Facsimile: +1-508-655-2237 Editor:
The OpenGIS
®
Abstract Specification
Topic 7: The Earth Imagery Case
Version 5
The OpenGIS® Abstract Specification
Copyright © 2004, Open Geospatial Consortium, Inc.
This document does not represent a commitment to implement any portion of this specification in any company’s products.
OGC’s Legal, IPR and Copyright Statements are found at http://www.opengeospatial.org/about/?page=ipr&view=ipr NOTICE
Permission to use, copy, and distribute this document in any medium for any purpose and without fee or royalty is hereby granted, provided that you include the above list of copyright holders and the entire text of this NOTICE. We request that authorship attribution be provided in any software, documents, or other items or products that you create pursuant to the implementation of the contents of this document, or any portion thereof.
No right to create modifications or derivatives of OGC documents is granted pursuant to this license. However, if additional requirements (as documented in the Copyright FAQ at
http://www.opengeospatial.org/about/?page=ipr&view=ipr_faq) are satisfied, the right to create modifications or derivatives is sometimes granted by the OGC to individuals complying with those requirements.
THIS DOCUMENT IS PROVIDED "AS IS," AND COPYRIGHT HOLDERS MAKE NO REPRESENTATIONS OR WARRANTIES, EXPRESS OR IMPLIED, INCLUDING, BUT NOT LIMITED TO, WARRANTIES OF
MERCHANTABILITY, FITNESS FOR A PARTICULAR PURPOSE, NON-INFRINGEMENT, OR TITLE; THAT THE CONTENTS OF THE DOCUMENT ARE SUITABLE FOR ANY PURPOSE; NOR THAT THE
IMPLEMENTATION OF SUCH CONTENTS WILL NOT INFRINGE ANY THIRD PARTY PATENTS, COPYRIGHTS, TRADEMARKS OR OTHER RIGHTS.
COPYRIGHT HOLDERS WILL NOT BE LIABLE FOR ANY DIRECT, INDIRECT, SPECIAL OR
CONSEQUENTIAL DAMAGES ARISING OUT OF ANY USE OF THE DOCUMENT OR THE PERFORMANCE OR IMPLEMENTATION OF THE CONTENTS THEREOF.
The name and trademarks of copyright holders may NOT be used in advertising or publicity pertaining to this document or its contents without specific, written prior permission. Title to copyright in this document will at all times remain with copyright holders.
The OpenGIS® Abstract Specification
Revision History
Date Description
27 September 2004
Replaced previous material in Topic 7 with ISO 19101-2, Reference Model – Geographic Information – Imagery. Version 5 of OGC Topic 7 is identical with ISO 19101-2 Working Draft #3.
Topic 7 will be updated jointly with the progress of ISO 19191-2.
Appendix A of Topic 7, version 4 contained a “White Paper on Earth Image Geometry Models.” That white paper is now separate OGC Recommendation document.
The OpenGIS® Abstract Specification
ii
ISO TC 211 N XXX
Date: 16 August 2004
ISO 19101-2 – Version WD3
ISO TS 19101-2
ISO TC 211/WG 6
Secretariat: NSF
Geographic information — Reference Model – Imagery
Information géographique —Modèle de référence – Imagerie
Error! AutoText entry not defined.
Document type: Technical Specification Document subtype:
© ISO 2002 – All rights reserved iii
Copyright notice
This ISO document is a working draft or committee draft and is copyright-protected by ISO. While the reproduction of working drafts or committee drafts in any form for use by participants in the ISO standards development process is permitted without prior permission from ISO, neither this document nor any extract from it may be reproduced, stored or transmitted in any form for any other purpose without prior written permission from ISO.
Requests for permission to reproduce this document for the purpose of selling it should be addressed as shown below or to ISO’s member body in the country of the requester:
Norwegian Technology Centre P.O. Box 7072 Majorstua NO-0306 Oslo, Norway Tel: + 47 22 59 01 00 Fax: + 47 22 59 01 29 e-mail: [email protected]
Reproduction for sales purposes may be subject to royalty payments or a licensing agreement.
© ISO 2002 – All rights reserved iv
Contents
Foreword ... x
Introduction... xi
1 Scope ... 1
2 Conformance ... 1
3 Normative references ... 1
4 Terms and definitions... 2
5 Symbols and abbreviated terms ... 6
5.1 Abbreviations ... 6
5.2 Symbols ... 6
5.3 Notation ... 7
6 Geographic Imagery Systems... 7
6.1 Geographic imagery as features... 7
6.2 Open distributed processing of geographic imagery... 9
7 Enterprise viewpoint – community objectives and policies ... 10
7.1 Introduction ... 10
7.2 Geographic imagery community objective... 10
7.3 Geographic imagery scenario... 10
7.4 Geographic imagery policies ... 11
7.4.1 Introduction to policies ... 11
7.4.2 Policy development guidelines ... 11
7.4.3 Geographic imagery policies ... 12
8 Information viewpoint – knowledge based decisions... 13
8.1 Introduction to information viewpoint... 13
8.1.1 Creating knowledge from Imagery... 13
8.1.2 General feature model ... 14
© ISO 2002 – All rights reserved v
8.2 Geographic imagery data – raw data ... 17
8.2.1 Sensors and platforms ... 17
8.2.2 IG_Sensor ... 18
8.2.3 Passive sensors... 19
8.2.4 Active sensors ... 22
8.2.5 Calibration, validation and metrology... 24
8.2.6 Position and attitude determination ... 25
8.2.7 Image acquisition request ... 26
8.3 Geographic imagery information – processed, located, gridded ... 26
8.3.1 IG_Image... 26
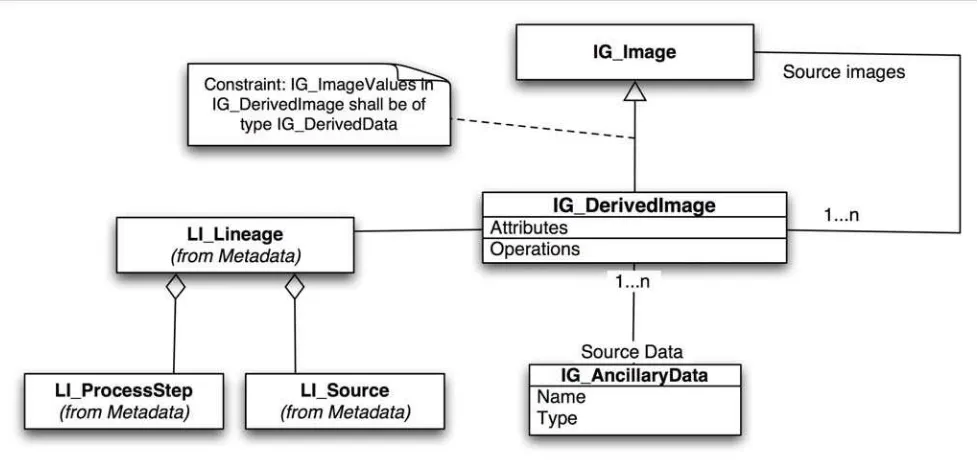
8.3.2 Derived Imagery ... 31
8.3.3 Imagery Metadata... 34
8.3.4 IG_Image application specialization ... 34
8.3.5 Encoding rules for imagery... 34
8.4 Geographic imagery knowledge – inference and interpretation ... 35
8.4.1 Knowledge from imagery... 35
8.4.2 Image understanding and classification... 35
8.4.3 IG_KnowledgeBase ... 37
8.5 Geographic imagery for decisions – application context ... 39
8.5.1 Decision Context (IG_Context)... 39
8.5.2 Decision fusion ... 41
8.5.3 Visualization ... 42
9 Computational viewpoint – services for imagery... 43
9.1 Task-oriented computation ... 43
9.2 Computational patterns ... 44
9.3 Geographic imagery services ... 46
9.3.1 Geographic imagery human interaction services ... 48
9.3.2 Geographic imagery model/information management services ... 48
9.3.3 Geographic imagery workflow/task management services ... 49
9.3.4 Geographic imagery processing services ... 49
9.3.5 Geographic communication services ... 51
9.4 Service chaining for imagery ... 51
9.5 Service metadata – extensions for imagery ... 52
10 Engineering viewpoint – deployment approaches... 52
10.1 Introduction ... 52
10.2 Distributed system for geographic imagery ... 52
10.3 Imagery collection node... 54
10.4 Sensor processing node ... 55
10.5 Image archive nodes ... 55
10.6 Value-added processing and exploitation nodes ... 57
10.7 Decision support nodes ... 58
© ISO 2002 – All rights reserved vi
10.8.1 Imagery considerations for channels ... 58
10.8.2 Space to ground communications... 59
10.8.3 Internet ... 59
10.9 Persistent implementation ... 59
Annex A – Abstract test suite... 60
Annex B – ISO Reference model for open distributed processing (RM-ODP) ... 61
Annex C – Imagery use cases ... 62
C.1 Agricultural irrigation use case ... 62
C.2 Vehicle traffic use case ... 62
C.3 Natural resources use case... 63
C.4 Hurricane evacuation use case ... 64
C.5 Commercial airborne photogrammetry ... 65
C.6 Intelligence, surveillance and reconnaissance ... 67
C.7 Controlling wildfires... 68
C.8 Digital earth ... 69
C.9 Earth science vision... 70
Annex D – Service chaining examples ... 73
Annex E – Application area decision tree... 74
Annex F – Principles relating to remote sensing of the Earth from space ... 75
© ISO 2002 – All rights reserved vii
Table of Figures
Figure 1 - Image state diagram with modifications for geographic imagery ... 8
Figure 2 – Geographic imaging scenario ... 11
Figure 3 - Information viewpoint packages ... 13
Figure 4 – Semiotic derivation of the information viewpoint... 14
Figure 5 - Feature modeling extended to imagery... 15
Figure 6 - IG_Sensor and associated classes... 18
Figure 7 - Electromagnetic spectrum ... 19
Figure 8 - IG_Image... 27
Figure 9 - IG_ImageValues ... 29
Figure 10 - IG_DerivedImage... 32
Figure 11 - Effects of atmospheric scattering... 33
Figure 12 - Multi-tiered imagery encoding... 35
Figure 13 – Image knowledge packages ... 35
Figure 14 – Image classification and understanding class diagram ... 37
Figure 15 - IG_KnowledgeBase ... 38
Figure 16 - Applications based on resolution ... 40
Figure 17 - Imagery requirements for selected applications ... 41
Figure 18 - Imagery for decision support ... 44
Figure 19 - Types of service description ... 47
Figure 20 - Geographic imagery system deployment diagram ... 53
Figure 21 - Imagery collection node deployment diagram ... 54
Figure 22 - Sensor processing node deployment diagram ... 55
© ISO 2002 – All rights reserved viii
Figure 24 - Image archive node component diagram ... 56
Figure 25 -Value-added processing node deployment diagram ... 57
Figure 26 - Decision support node deployment diagram ... 58
Figure 27 - NIIA Scope ... 68
Figure 28 - Geographic imagery processing chain – IEEE/GRSS ... 73
Figure 29 - Geographic imagery processing chain – OGC ... 73
© ISO 2002 – All rights reserved ix
Table of Tables
Table 1 — Sources of externally defined UML classes ... 7
Table 2 - Policy development guidelines ... 12
Table 3 - Sources of error in geographic imagery ... 16
Table 4 – Optical sensing wavelengths ... 20
Table 5 - Optical measurements ... 20
Table 6 - Radar band designations [IEEE Std 686-1997] ... 22
Table 7 - Radar measurements... 23
Table 8 - Positioning systems... 26
Table 9 – IG_Image Examples ... 28
Table 10 - IG_Image operations inherited from CV_Coverage... 30
Table 11 - IG_Image operations... 31
Table 12 - Image classification and understanding classes... 36
Table 13 – Applications and spatial resolution... 40
Table 14 - Application area taxonomy ... 42
Table 15 — Object factory computational pattern ... 45
Table 16 — Message-oriented computational pattern... 46
Table 17 — Geographic services taxonomy ... 48
Table 18 - Imagery collection node examples... 55
© ISO 2002 – All rights reserved x
Foreword
ISO (the International Organization for Standardization) is a worldwide federation of national standards bodies (ISO member bodies). The work of preparing International Standards is normally carried out through ISO technical committees. Each member body interested in a subject for which, a technical committee has been established has the right to be represented on that committee. International organizations, governmental and non-governmental, in liaison with ISO, also take part in the work. ISO collaborates closely with the International Electrotechnical Commission (IEC) on all matters of electrotechnical standardization.
International Standards are drafted in accordance with the rules given in the ISO/IEC Directives, Part 3.
Draft International Standards adopted by the technical committees are circulated to the member bodies for voting. Publication as an International Standard requires approval by at least 75 % of the member bodies casting a vote.
Attention is drawn to the possibility that some of the elements of this International Standard may be the subject of patent rights. ISO shall not be held responsible for identifying any or all such patent rights.
International Standard ISO 19129 was prepared by Technical Committee ISO/TC 211, Geographic information/Geomatics.
© ISO 2002 – All rights reserved xi
Introduction
This Technical Specification provides a reference model for the open distributed processing of geographic imagery. The motivating themes addressed in this reference model are:
• In terms of volume, imagery is the dominant form of geographic information.
• Stored geographic imagery volume will grow to the order of an exabyte
• National imagery archives are multiple petabytes in size; ingesting a terabyte per day
• Individual application data centers are archiving 100’s of terabytes of imagery
• Tens of thousands of datasets have been catalogued but are not yet on-line.
• Most geographic imagery will never be directly accessed by humans
• Human attention is the scarce resource, and is insufficient to view petabytes of data.
• Semantic processing will be required: automatic detection of features; mining based on geographic concepts
• Information technology allows the creation of geographic information products through processing of geographic imagery. Standards are needed to increase creation of products.
• A number of existing standards are used for the exchange of geographic imagery.
• Hurdles to moving imagery online are technical, legal, business
• Technical issues of accessibility - geocoding, geographic access standards
• Intellectual property will be stolen.
• Privacy Impact Assessment
• Standards are needed
• Governments have been the predominant suppliers of remote sensed data in the past. This is changing with the commercialization of remote sensed data acquisition.
• Geographic imagery is a key input to support policy makers in decision support.
© ISO 2001 All rights reserved 1
Geographic information — Reference model – Imagery
1 Scope
This Technical Specification defines a reference model for standardization in the field of geographic imagery. This reference model identifies the scope of the standardization activity being undertaken and the context in which it takes place. The scope will include gridded data with an emphasis on imagery. Although structured in the context of information technology and information technology standards, this Technical Specification will be independent of any application development method or technology implementation approach..
2 Conformance
Any imagery-handling system claiming conformance with the reference model established in this Technical Specification shall pass the requirements described in the abstract test suite presented in Annex A.
3 Normative
references
The following normative documents contain provisions, which through reference in this text constitute provisions of this Technical Specification. At the time of publication, the editions indicated were valid. All standards are subject to revision, and parties involved in agreements based on this Technical Specification are encouraged to investigate the possibility of applying the most recent editions of the normative documents indicated below. For undated references, the latest edition of the normative document referred to applies. Members of IEC and ISO maintain registers of currently valid International Standards.
ISO 31-0:1992, Quantities and units – General principles
ISO 31-6:1992, Quantities and units - Light and related electromagnetic radiations
ISO 2382-1:1993, Information technology - Vocabulary - Part 1: Fundamental terms
ISO 2382-13:1996, Information technology - Vocabulary - Part 13: Computer graphics
ISO/IEC 10746-1:1998, Information technology — Open Distributed Processing — Reference model: Overview
ISO/IEC 10746-2:1996, Information technology — Open Distributed Processing — Reference model: Foundations
ISO/IEC 12087-1:1995, Information technology – Computer graphics and image processing – Image Processing and Interchange (IPI) - Functional specification - Part 1: Common architecture for imaging
ISO 13249-5:2003, Information technology — Database languages — SQL multimedia and application packages — Part 5: Still image
© ISO 2001 All rights reserved 2
ISO 14721:2003, Space data and information transfer systems — Open archival information system — Reference model
ISO 19101:2002 Geographic information — Reference model
ISO 19107:2003 Geographic information — Spatial schema
ISO 19108:2002 Geographic information — Temporal schema
ISO 191091) Geographic information — Rules for application schema
ISO 191101 Geographic information — Feature cataloguing methodology
ISO 19111:2003 Geographic information — Spatial referencing by coordinates
ISO 19115:2003 Geographic information — Metadata
ISO 19115-21, Geographic information — Metadata — Part 2: Extensions for imagery and gridded data
ISO 191191, Geographic information – Services
ISO 191231, Geographic information - Schema for coverage geometry and functions
ISO 191291, Geographic information - Imagery, gridded and coverage data framework
ISO 191301, Geographic information - Sensor and data models for imagery and gridded data
ISO 22028-1:2004, Photography and graphic technology — Extended colour encodings for digital image storage, manipulation and interchange — Part 1: Architecture and requirements.
CIE Publication 17.4, 1987, International Lighting Vocabulary
OpenGIS Consortium Abstract Specification, Topic Volume 15 - Image Exploitation Services, 2000, OGC document 00-115.
4 Terms and definitions
For the purposes of this Technical Specification, the following terms and definitions apply.
band
range of wavelengths of electromagnetic radiation specified to produce a single response to a sensing device.
computational viewpoint
viewpoint on an ODP system and its environment that enables distribution through functional decomposition of the system into objects which interact at interfaces. [ISO/IEC 10746-2]
© ISO 2001 All rights reserved 3
coverage
feature that acts as a function to return values from its range for any direct position within its spatiotemporal domain [ISO 19123]
data
reinterpretable representation of information in a formalised manner suitable for communication, interpretation, or processing [ISO/IEC 2382-1]
digital number (DN)
discrete integer value representing a measurement as detected by a sensor
decision support system
interactive computer program to aid decision makers in formulating, analyzing, and selecting alternatives
engineering viewpoint
viewpoint on an ODP system and its environment that focuses on the mechanisms and functions required to support distributed interaction between objects in the system. [ISO/IEC 10746-2]
enterprise viewpoint
viewpoint on an ODP system and its environment that focuses on the purpose, scope and policies for that system. [ISO/IEC 10746-2]
feature
abstraction of real world phenomena [ISO 19101]
geographic feature
representation of real world phenomenon associated with a location relative to the Earth [ISO 19125]
grid
network composed of two or more sets of curves in which the members of each set intersect the members of the other sets in an algorithmic way. [ISO DIS 19123]
information
meaning currently assigned to data by means of the conventions applied to these data
(Editors note: to be consistent with ISO 19118 for information should be used: “knowledge concerning objects, such as facts, events, things, processes, or ideas, including concepts, that within a certain context has a particular meaning [ISO/IEC 2382-1].” This is difficult as the 2382-1 definition says that information is knowledge, whereas this Technical Specification defines knowledge as more than information.)
information viewpoint
viewpoint on an ODP system and its environment that focuses on the semantics of information and information processing. [ISO/IEC 10746-2]
(geographic) image
gridded coverage whose range values quantitatively describe physical phenomena.
NOTE The physical parameters are the result of measurement by a sensor or a prediction from a model.
© ISO 2001 All rights reserved 4
interface
named set of operations that characterize the behaviour of an entity [ISO 19119]
interoperability
capability to communicate, execute programs, or transfer data among various functional units in a manner that requires the user to have little or no knowledge of the unique characteristics of those units [ISO 2382-1]
knowledge
an organized, integrated collection of facts and generalizations. [Need a reference]
NOTE scientific knowledge - knowledge accumulated by systematic study and organized by general principles; "mathematics is the basis for much scientific knowledge"
knowledge base
data base of knowledge about a particular subject.
NOTE: The data base contains facts, inferences, and procedures needed for problem solution. [Webster Computer]
(measurable) quantity
attribute of a phenomenon, body or substance that may be distinguished qualitatively and determined quantitatively [International Vocabulary of Basic and General Terms in Metrology (VIM)]
measurement
set of operations having the object of determining a value of a quantity [International Vocabulary of Basic and General Terms in Metrology (VIM)]
measurand
particular quantity subject to measurement [International Vocabulary of Basic and General Terms in Metrology (VIM)]
EXAMPLE vapour pressure of a given sample of water at 20 °C.
NOTE The specification of a measurand may require statements about quantities such as time, temperature and pressure.
(Editor’s note: this is the definition of measurand in ISO CD 19136: “Phenomenon or property that is subject to observation.” But VIM is more authoritative than ISO 19136 on this topic. So, 19136 should adopt VIM definition.)
observable
(phenomenon that is derivable from a measurand)
observable. The fundamental physical quantity or quantities that a sensor can measure, such as temperature which through a process of calibration can be related to a Geophysical parameter. Observables can usually be measured by processes traceable to physical standards. (Earth Observing System Calibration Advisory Panel)
(ISO CD 19136: Observable - Phenomenon or property that is subject to observation. Observation is not defined in 19136. Observation: measurand at a location and time.)
ontology
entities and relations for a domain of interest to a community of agents. [derived from IEEE SUO]
operation
specification of a transformation or query that an object may be called to execute [ISO 19119]
© ISO 2001 All rights reserved 5
orthoimage
georectified image in which displacement of objects in the image, due to sensor orientation and terrain relief, have been removed. .
pixel
picture element
NOTE It is the smallest unit of display
remote sensing
collection and interpretation of information about an object without being in physical contact with the object.
resolution (of a sensor)
smallest difference between indications of a sensor that can be meaningfully distinguished
NOTE For imagery, resolution refers to radiometric, spectral, spatial and temporal resolutions.
scene
spectral radiances of a view of the natural world as measured from a specified vantage point in space and at a specified time. [ISO 22028-1]
NOTE A scene may correspond to an actual view of the natural world or to a computer-generated virtual scene simulating such a view.
semiotics
systematic investigation of the nature, properties and kinds of signs.
NOTE semiotics comprises syntactics, semantics and pragmatics (Webster)
sensor
element of a measuring instrument or measuring chain that is directly affected by the measurand [International Vocabulary of Basic and General Terms in Metrology (VIM)]
sensor model
description of the radiometric and geometric characteristics of a sensor
(Ed. Note: compare with “description of the radiometric and geometric characteristics of the sensor including position and orientation of the instrument measuring the data [19130]”)
service
distinct part of the functionality that is provided by an entity through interfaces [ISO/IEC TR 14252]
taxonomy
ontology with constraints for subtyping, covering and partition. [Derived from IEEE SUO]
NOTE A taxonomy is a formally defined ontology
technology viewpoint
© ISO 2001 All rights reserved 6
traceability
property of the result of a measurement or the value of a standard whereby it can be related to stated references, usually national or international standards, through an unbroken chain of comparisons all having stated uncertainties [International Vocabulary of Basic and General Terms in Metrology (VIM)]
uncertainty of measurement
parameter, associated with the result of a measurement, that characterizes the dispersion of the values that could reasonably be attributed to the measurand
NOTE 1 The parameter may be, for example, a standard deviation (or a given multiple of it), or the half-width of an interval having a stated level of confidence.
NOTE 2 Uncertainty of measurement comprises, in general, many components. Some of these components may be evaluated from the statistical distribution of the results of series of measurements and can be characterized by experimental standard deviations. The other components, which can also be characterized by standard deviations, are evaluated from assumed probability distributions based on experience or other information.
NOTE 3 It is understood that the result of the measurement is the best estimate of the value of the measurand, and that all components of uncertainty, including those arising from systematic effects, such as components associated with corrections and reference standards, contribute to the dispersion.
viewpoint (on a system)
form of abstraction achieved using a selected set of architectural concepts and structuring rules, in order to focus on particular concerns within a system. [ISO/IEC 10746-2]
5 Symbols and abbreviated terms
5.1 Abbreviations
The following abbreviations are used in this Technical Specification.
DCP Distributed Computing Platform
IT Information Technology
ODP Open Distributed Processing (see RM-ODP) OGC Open GIS Consortium
RM-ODP Reference Model of Open Distributed Processing (ISO/IEC 10746) TBS To Be Supplied
UML Unified Modelling Language
VIM International Vocabulary of Basic and General Terms in Metrology XML Extensible Markup Language
5.2 Symbols
© ISO 2001 All rights reserved 7 5.3 Notation
The conceptual schema specified in this Technical Specification is described using the Unified Modelling Language (UML) [3], following the guidance of ISO/TS 19103. Several model elements used in this schema are defined in other ISO standards developed by ISO/TC 211. Names of UML classes, with the exception of basic data type classes, include a two-letter prefix that identifies the standard and the UML package in which the class is defined. Table 2 lists the other standards and packages in which UML classes used in this International Standard have been defined.
Table 1 — Sources of externally defined UML classes
Prefix Standard Package
CV ISO 19123 Coverages
FC ISO 19110 Feature catalgouing
IG ISO 19101-2 Reference model - Imagery
MD ISO 19115 Metadata
PS ISO 19116 Positioning services
6 Geographic Imagery Systems
6.1 Geographic imagery as features
In the ISO 19100 series of standards a geographic image is a type of coverage, and a coverage is a type of feature.
A feature is an abstraction of real world phenomena (See ISO 19101). A geographic feature has implicit or explicit reference to a location relative to the Earth.
A coverage is a feature that acts as a function to return values from its range for any direct position within its spatiotemporal domain (See ISO 19123). Examples of coverages include an image, a polygon overlay, or a digital elevation matrix.
A grid may be used to structure the domain of a coverage. As defined in ISO 19123, a grid is a network composed of two or more sets of curves in which the members of each set intersect the members of the other sets in an algorithmic way.
A geographic image shall be a gridded coverage whose range values quantitatively describe physical phenomena.
Physical quantities, as defined in IS0 31-0 Quantities and units - Part 0: General principles, shall be used in a
geographic image for the quantitative description of physical phenomena. Conventional scales, such as the Beaufort scale, Richter scale, colour intensity scales, and land cover classification, shall not be used as range values for a geographic image. Conventional scales may be used in other types of geographic coverages. The physical quantities of a geographic image may be the result of measurement by a sensor or from a prediction by a physical model.
© ISO 2001 All rights reserved 8
Requiring the data of an image to be organized in a grid reflects that an image is a uniform method for representing the physical phenomena. A random set of point data from a sensor is not an image.
It is useful to distinguish between image as used in this Technical Specification, and the colloquial use of the term ‘image’. As used in this Technical Specification, an image is a representation of image data within a computer system. To view an image, a presentation process is required. The definition used in this Technical Specification is consistent with ‘image’ (or ‘digital image’) as defined in ISO/IEC 12087-1: Common architecture for imaging.
To place geographic imagery in the larger context of digital imagery, various types of image encodings are shown in the image state diagram of Figure 1. Figure 1 is nearly identical to the image state diagram of ISO 22028-1:2004, Photography and graphic technology — Extended colour encodings for digital image storage, manipulation and
interchange — Part 1: Architecture and requirements. ISO 22028-1 categorizes image encodings into scene-referred or picture-referred image states.
Figure 1 - Image state diagram with modifications for geographic imagery
© ISO 2001 All rights reserved 9
image encodings, such as derivation of geophysical values based on sensor measurements. These derived images are also considered to be scene-referred image encodings.
Picture-referred colour encodings are representations of the colour-space coordinates of a hardcopy or softcopy image. Picture-referred colour encodings can be further subdivided into original-referred colour encodings and output-referred colour encodings.
Original-referred colour encodings are representative of the colour-space coordinates (or an approximation thereof) of a two-dimensional hardcopy or softcopy input image. For geographic information, original-referred colour encodings could be obtained from printed maps, printed pictures of a geographic scene, drawings of geographic information, etc. Although an original-referred colour encoding may be of a picture of a geographic scene, because the picture was previously colour-rendered for printing, it is not a scene-referred image encoding.
Output-referred colour encodings are representative of the colour-space coordinates of image data that are appropriate for a specified real or virtual output device and viewing conditions. Output-referred colour encodings are tightly coupled to the characteristics of a particular real or virtual output device and viewing conditions. Portrayal of geographic information is addressed in ISO 19117, Geographic Information – Portrayal.
Picture-referred colour encodings are colour encodings of any type of geographic information including, but not limited, to geographic imagery. Issues such as false-colour rendering must be addressed to transform the broader spectrum of geographic imagery into colour imagery. Picture-referred colour encodings are addressed in this Technical
Specification in Clause 8.5.3, Visualization.
6.2 Open distributed processing of geographic imagery
The objective of this Technical Specification is the coordinated development of standards that allow the benefits of distributed geographic image processing to be realized in an environment of heterogeneous IT resources and multiple organizational domains. An underlying assumption is that uncoordinated standardization made according to no plan, cannot be united under a necessary framework.
This Technical Specification provides a reference model for the open, distributed processing of geographic imagery. The basis for defining an information system in this specification is the Reference Model for Open Distributed Processing (RM-ODP). (See Annex B for a brief description of RM-ODP.) The basis for defining geographic information in this specification is the ISO 19100 series of standards.
The RM-ODP viewpoints are used in the following fashion:
- Typical actors and their business activities and policies to carry out the activities of are addressed in the Enterprise Viewpoint.
- Data structures and the progressive addition of value to the resulting products are found in the schemas of the Information Viewpoint.
- Individual processing services and the chaining of services in are addressed in the Computational Viewpoint
© ISO 2001 All rights reserved 10
7 Enterprise viewpoint – community objectives and policies
7.1 Introduction
The Enterprise viewpoint on an ODP system and its environment focuses on the purpose, scope and policies for that system. [ISO/IEC 10746-2] The purpose is provided as the objective of the geographic imagery community. The scope is defined through a high-level scenario in this clause and through a of use cases in Annex C. Policies are discussed in this clause through a set of critiera for developing policies for geographic imagery systems as well as several example international policies relating to geographic imagery.
7.2 Geographic imagery community objective
The central concept of the enterprise viewpoint is how the geographic imagery community interacts to enable imagery collected from different sources to become an integrated digital representation of the Earth widely accessible for humanities critical decisions. The enterprise viewpoint provides the traceability between this objective and the system design for distributed geographic imagery processing systems.
The fundamental goal of the Geographic imagery community is to advance and protect interests of humanity by development of imaging capabilities, and by sustaining and enhancing the Geographic imagery industry. Doing so will also foster economic growth, contribute to environmental stewardship, and enable scientific and technological
excellence.
7.3 Geographic imagery scenario
Figure 3 provides a geographic imagery scenario. The context is that a customer requests geographic imagery information to be used with other information, including other geographic information, in support of a decision.
The customers request for geographic imagery information is assessed in the planning step. The customer’s desired information may be readily available from an archive or a model, or may be processed from information in an archive or available from a model. Here a model is a simulation of some portion of the geographic environment able to produce geographic imagery. Some additional processing may be needed of the archive or model outputs in order to meet the customers request.
The customers request for geographic imagery may require collection of new imagery. Tasking determines the available sensors and platforms and develops an imagery acquisition request. The sensor is tasked to acquire the raw data and the acquisition is performed. Acquisition of the imagery data is done in accordance with the acquisition policies.
© ISO 2001 All rights reserved 11
Figure 3 – Geographic imaging scenario
7.4 Geographic imagery policies
7.4.1 Introduction to policies
A policy, as defined in ISO/IEC 10746-2, is a set of rules related to a particular purpose. A rule can be expressed as an obligation, a permission or a prohibition. Not every policy is a constraint. Some policies represent an
empowerment.
7.4.2 Policy development guidelines
© ISO 2001 All rights reserved 12
Table 2 - Policy development guidelines
Stability Stability of data and services over time is essential so that investment decisions can be made with a correct understanding of the conditions of the future marketplace.
Specific policies include continuity in data collection, consistency in format, frequency of observations, and access to comparable data over time.
Simplicity Access to geographic imagery is subject to many interpretations driven by the variety of people and organizations with informed opinions about the subject. Simple policies that avoid the pitfalls of becoming too deeply entrenched in implementation are necessary.
Fair treatment. Given that much geographic imagery is publicly funded, there is a concern for fair treatment to be applied and to be seen to be applied. This means explicit conditions of access that do not arbitrarily favor one group or penalize another group.
Growth. Growth in the types, extent and volume of geographic imagery is desired. Policies that support growth are critical.
Maximum access There is widespread interest in maximizing the use of geographic imagery. Image access should follow open standards to allow the integrated use of imagery from multiple sources.
Sustainablity A combination of high investment costs plus a high potential value of the data in the long-term means that the value of a sustainable geographic imagery sector should not disappear shortly after applications have been brought to a mature stage.
Data preservation shall be addressed by all image archiving as a routine part of the data production process to ensure continuity of the data record and to avoid inadvertent loss of usable data.
7.4.3 Geographic imagery policies
7.4.3.1 Introduction
This clause contains geographic imagery policies promulgated by international organizations that may apply to a particular geographic imagery system.
7.4.3.2 Imagery acquisition policies
The “Principles Relating to Remote Sensing of the Earth from Space” was adopted by the United Nations on 3 December 1986 (Resolution 41/65) through the efforts of the UN Committee on the Peaceful Uses of Outer Space (COPUOS) as part of the progression of formulating international rules to enhance opportunities for international cooperation in space. These principles are contained in an Annex of this Technical Specification.
© ISO 2001 All rights reserved 13
7.4.3.3 Imagery distribution policies
WMO Resolution 40 --"WMO Policy and Practice for the Exchange of Meteorological and Related Data and Products Including Guidelines on Relationships in Commercial Meteorological Activities" – to be published as an ITU-R Handbook
7.4.3.4 Enterprise development policies
A policy of standardization for data and interfaces is one of the essential building blocks of the Information Society. There should be particular emphasis on the development and adoption of international standards. The development and use of open, interoperable, non-discriminatory and demand-driven standards that take into account needs of users and consumers is a basic element for the development and greater diffusion of Information and Communication Technologies and more affordable access to them. [World Summit on the Information Society, 12 December 2003, Declaration B.44]
8 Information viewpoint – knowledge based decisions
8.1 Introduction to information viewpoint
8.1.1 Creating knowledge from Imagery
The geographic imagery information viewpoint in this Technical Specification identifies the various types of geographic information and shows the relationships of raw sensed data to higher semantic content information and knowledge. As defined in ISO/IEC 10746-1, an information viewpoint specification of an ODP system focuses on the semantics of information and information processing. The information viewpoint is structured following a semiotic approach to geographic imagery. The resulting structure of the viewpoint is reflected in the UML packages (Figure 4). The contents of these packages are addressed in the following clauses of this viewpoint.
Figure 4 - Information viewpoint packages
© ISO 2001 All rights reserved 14
icons. Elements of semiotics form the approach of this information viewpoint on geographic imagery. Semiotics comprises the syntactics, semantics and pragmatics of signs. Figure 5 presents the semiotic-derived structure for the information viewpoint2.
Figure 5 – Semiotic derivation of the information viewpoint
Data (Figure 5, bottom layer) is a reinterpretable representation of information in a formalised manner suitable for communication, interpretation, or processing [ISO/IEC 2382-1]. For imagery, data is the result of a measurement by a sensor at a location.
Applying conventions or agreed-upon codes is the transition from data to information. Structuring the sensor data in a standard syntax allows for transmission of the data to entities in the open distributed processing system. Information then is meaning currently assigned to data by means of the conventions applied to these data
(Editors note: ISO 19118 uses this definition of Information: knowledge concerning objects, such as facts, events, things, processes, or ideas, including concepts, that within a certain context has a particular meaning [ISO/IEC 2382-1]. ISO 19118 defines information as a type of knowledge whereas this Technical Specification explicitly separates information and knowledge.)
As information is gathered, regularities that are observed, are generalized and models are developed forming the transition to knowledge. Knowledge is an organized, integrated collection of facts and generalizations. Imagery can be interpreted based on a model of feature types that correspond to a universe of discourse. The resulting feature-based description of a scene is described in the General feature model clause.
The knowledge base is used in the formation of pragmatic decisions that addresses the goals of multiple stakeholders. Key to effective decisions is identifying the context in which the decision applies. The context determines what
information is relevant to the decision.
8.1.2 General feature model
Geographic imagery is a type of geographic information. The ISO 19100-series of International Standards define a conceptual modeling approach for geographic information. ISO 19101, Geographic Information – Reference Model, defines Conceptual Modeling and the Domain Reference Model that this Technical Specification extends for
© ISO 2001 All rights reserved 15
geographic imagery. ISO 19109 defines the General Feature Model that is used throughout the ISO 19100-series. The Conceptual Modeling approach that is the basis for the General Feature Model is extended to geographic Imagery in Figure 6.
Figure 6 - Feature modeling extended to imagery
The left side of Figure 6, derived from ISO 19109, shows the process of structuring data from the universe of discourse to the geographic dataset. The definitions of the feature types and their properties, as perceived in context of an application field, are derived from the universe of discourse. A feature catalogue documents the feature types. An application schema defines the logical structure of data and may define operations that can be performed on or with the data.
The right side of Figure 6 shows the process of sensing data in the environment that can be processed to provide measurements of physical quantities or to be interpreted as a set of discrete features. The physical quantities and their properties, as perceived in context of an application field, are derived from the universe of discourse. An attribute catalog documents the physical quantities as attribute types. Derived images are specializations of geographic images. An interpreted scene is not an image, but rather a discrete coverage or feature collection.
Elements on the right side of Figure 6 are defined in this Information Viewpoint. Sensors and the resulting data are described in the Data clause. Image, Derived image, and the physical quantities in an attribute catalogue are described in the Information clause. Interpreted image is described in the Knowledge clause.
8.1.3 Topics relevant across data, information, and knowledge
8.1.3.1 Resolution
© ISO 2001 All rights reserved 16
Radiometric resolution is the amount of energy required to increase a pixel value by one quantization level or 'count'. Radiometric resolution measures sensitivity in discriminating between intensity levels.
Spectral resolution is the total range of reflectance (the width and number of bands in the electromagnetic spectrum) of a given band to produce an image. Spectral resolution measures sensitivity in discriminating between wavelengths.
Spatial resolution is expressed in digital images as pixel ground resolution. Pixel ground resolution defines the area of the ground represented in each pixel in X and Y components. Sometimes this is referred to as the ground sample distance (GSD) or ground sample interval (GSI).
Related to the spatial resolution is the Instantaneous Geometric Field of View (IGFOV). IGOV is the geometric size of the image projected by the detector on the ground through the optical system. IGOV is also called pixel footprint. ISO 19123 defines the related concept of CV_Footprint. A CV_Footprint is the sample space of a grid in an external coordinate reference system, e.g., a geographic CRS or a map projection CRS.
8.1.3.2 Uncertainty in Imagery
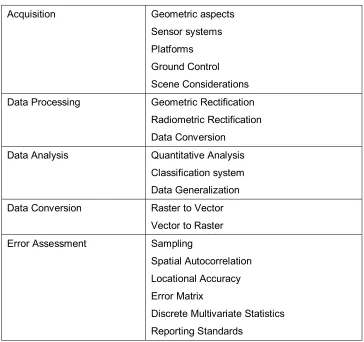
Understanding and estimating the uncertainty in image data is important for absolute measurements of phenomena as well as for data integration. Example sources of error in geographic imagery (Table 3) arise from across the many elements of image processing.
Table 3 - Sources of error in geographic imagery
Acquisition Geometric aspects
Sensor systems
Platforms
Ground Control
Scene Considerations
Data Processing Geometric Rectification
Radiometric Rectification
Data Conversion
Data Analysis Quantitative Analysis
Classification system
Data Generalization
Data Conversion Raster to Vector
© ISO 2001 All rights reserved 17
Final Product Presentation Spatial Error
Thematic Error
Decision Making
(Ed. Note: table of sources of error needs to be improved. Change to match sections of 19101-2. Relate to ISO 19113)
8.1.3.3 Imagery Fusion
Imagery fusion is the combining of imagery and other sources of geospatial information to improve the understanding of a specific phenomena. Fusion may be performed at several levels: pixel, feature, decision. These different types of fusion are addressed in the multiple clauses of the information viewpoint.
8.2 Geographic imagery data – raw data
8.2.1 Sensors and platforms
Clause 8.2, focuses on the data as produced by the sensor, e.g., DNs and radiances at the sensor inputs. Estimating the phenomenon at the remote object, e.g, reflectances, is discussed in a later clause.
Sensors are describe in two major classes passive and active. Passive sensors include optical and microwave sensors. Active sensors include radar, lidar, and sonar
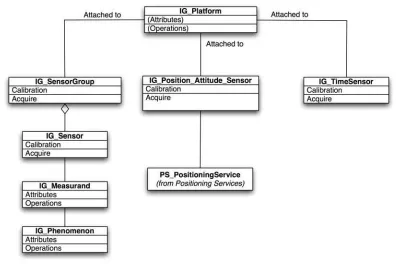
UML classes defined in this clause are shown in Figure 7.
© ISO 2001 All rights reserved 18
Figure 7 - IG_Sensor and associated classes
8.2.2 IG_Sensor
The attribute values of an image are a numerical representation of a physical parameter. The values for a physical parameter at a given time and place are obtained by conducting a measurement using a sensor. An imaging sensor performs multiple measurements to populate a grid of values. This clause focuses on sensors, the data they produce, the methods for creating a grid of values, and the uncertainty of the sensor data.
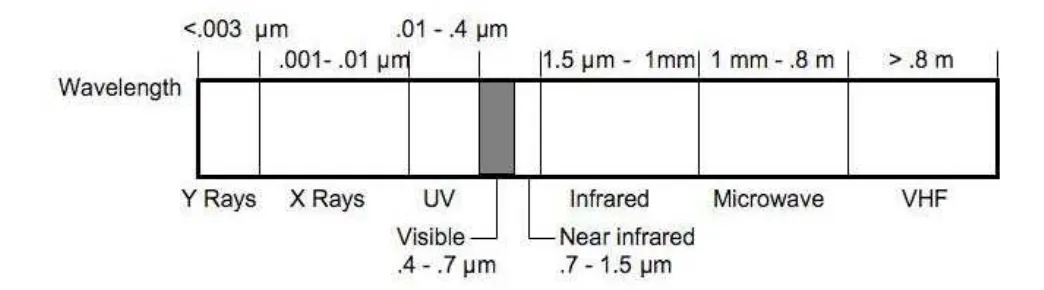
Most imagery data is obtained by remote sensing which aims to measure attributes of a real world phenomenon without being in mechanical contact with the phenomenon. The main type of remote sensing is radiometry – the measurement of the quantities associated with radiant energy, i.e., electromagnetic radiation.
Electromagnetic radiation is commonly classified as a function of wavelength across the Electromagnetic Spectrum (Figure 8). Sensors are designed to be sensitive to particular bands of the spectrum, e.g. visible band. A band is range of wavelengths of electromagnetic radiation specified to produce a single response to a sensing device. Multi-spectral radiometers measure radiance in several wavelength bands over a given Multi-spectral region. HyperMulti-spectral radiometers detect hundreds of very narrow spectral bands throughout the visible and infrared portions of the electromagnetic spectrum.
© ISO 2001 All rights reserved 19
The resolution of a sensor is defined by several quantities. The band structure for a sensor determines its spectral resolution. The radiometric sensitivity of a sensor for a specific band is the radiance increment for a single bit change in the DN. The spatial resolution of the sensor is the solid angle for which the sensor measures radiances.
In addition to sensing the radiance in a band, additional measurements can be made. An interferometer is a device combining two different parts of the same wave front into a single wave, causing the two parts to alternatively reinforce and cancel one another.
Figure 8 - Electromagnetic spectrum
8.2.3 Passive sensors
8.2.3.1 Optical sensing
8.2.3.1.1 General description
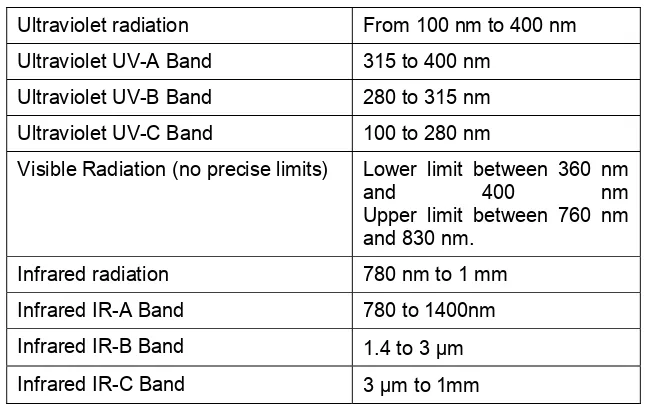
Optical radiation is electromagnetic radiation at wavelengths between region of transition to X-rays (λ ~ 1 nm) and the region of transition to radio waves (λ ~ 1mm). [CIE publication 17.4] Optical radiation includes infrared, visible and ultraviolet radiation (Table 4).
Visible radiation is any optical radiation capable of causing a visual sensation directly [CIE publication 17.4]. There are no precise limits for the spectral range of visible radiation since they depend upon the amount of radiant power reaching the retina and the responsivity of the observer. The lower limit is generally taken between 360 nm and 400 nm and the upper limit between 760 nm and 830 nm.
Infrared radiation is Optical radiation for which the wavelengths are longer than those for visible radiation. [CIE publication 17.4]
© ISO 2001 All rights reserved 20
Table 4 – Optical sensing wavelengths
Ultraviolet radiation From 100 nm to 400 nm
Ultraviolet UV-A Band 315 to 400 nm
Ultraviolet UV-B Band 280 to 315 nm
Ultraviolet UV-C Band 100 to 280 nm
Visible Radiation (no precise limits) Lower limit between 360 nm
and 400 nm Upper limit between 760 nm
and 830 nm.
Infrared radiation 780 nm to 1 mm
Infrared IR-A Band 780 to 1400nm
Infrared IR-B Band 1.4 to 3 µm Infrared IR-C Band 3 µm to 1mm
8.2.3.1.2 Measurements
Optical sensors measure the radiant energy in bands.
Table 5 - Optical measurements
An image is a grid of values from a geographic extent. Different sensors produce the grid of values in different manners, e.g., in a single measurement, scanning and measuring over time. Examples of scan geometries:
o Frame camera or sensor array
o Scan linear array
Quantity ISO 31-6 Quantities and Units - Light and related electromagnetic radiations
Radiant Energy Energy emitted, transferred or received as radiation
Radiant Flux (power) Power emitted, transferred or received as radiation
Irradiance At a point on a surface, the radiant energy flux incident on an element of the surface, divided by the area of that element
Radiance At a point on a surface and in a given direction, the radiant intensity of an element of the surface, divided by the area of the orthogonal projection of this element on a plane perpendicular to the given direction
© ISO 2001 All rights reserved 21
o Push-broom sensor
o Whisk-broom sensor
o Conic scanning sensor
(Editors note: This section needs to be reviewed with respect to topics in common with ISO19130.)
8.2.3.1.3 Derivable information
(Editors note: provides summary of optical remote sensing applications.)
8.2.3.2 Passive microwave
8.2.3.2.1 General description
Microwave radiation is Electromagnetic radiation at frequencies above 1 Ghz [derived from IEEE].
Vertically and horizontally polarized measurements are taken for all frequencies.
8.2.3.2.2 Measurements
An imaging radiometer maps the brightness temperature distribution over a field of view (FOV). An aperture radiometer does it by scanning the FOV either mechanically or electrically across. Brightness temperature is the measurand.
The temperature equivalent power detected by a radiometer (TRAD) can be decomposed into several sources. The first source is the brightness temperature (TB), defined as the beam averaged thermal emission incident on the radiometer antenna from the direction of its main beam. TB is itself a component of the antenna temperature (TA), which is the beam averaged thermal emission incident on the antenna from all directions. The relationship between TA and TRAD depends on the method used to calibrate the radiometer. If calibration is referenced to the input of the antenna (e.g. by surrounding it by warm or cold absorber loads), then they are equal. If calibration is achieved by switching the input to the radiometer from the antenna to separate warm or cold loads, then the reference point is the input to that switch. In the latter case, the contribution of TA to TRAD is reduced by hardware losses between the antenna and the switch, and an additional component of TRAD is contributed by thermal emission from the lossy hardware.
Absolute calibration of a radiometer implies a conversion from measurements of TRAD to estimates of TB (TB is then the input to subsequent geophysical data processing and analysis). The conversion from TRAD to TB can be
decomposed according to the sources of TRAD. TA calibration implies conversion from TRAD to TA. This step accounts for thermal emission by and losses due to the radiometer hardware, as noted above, and also corrects for non-ideal emission/reflection properties of the calibration loads. TB calibration implies conversion from TA to TB. This step is essentially an antenna deconvolution process, which typically involves an estimate of the relative sensitivity of the antenna within and outside of its main beam, together with an estimate of the thermal emission incident on the antenna outside of its main beam.
8.2.3.2.3 Derivable information
© ISO 2001 All rights reserved 22
Over land, the standard products include soil moisture, rainfall, and snow cover water content.
Geophysical quantities derived from microwave measurements enable investigation of atmospheric and surface hydrologic and energy cycles.
Spatial resolution of passive microwave data is from multiple to 10’s of kilometers
8.2.4 Active sensors
8.2.4.1 Radar
8.2.4.1.1 General description
Radar is an electromagnetic system for the detection and location of objects that operates by transmitting electromagnetic signals, receiving echos from objects (targets) within its volume of coverage, and extracting location and other information from the echo signal. [IEEE Std 686-1997]
Radar is an active radio detection and ranging sensor that provides its own source of electromagnetic energy. A radar sensor emits microwave radiation in a series of pulses from an antenna. When the energy reaches the target, some of the energy is reflected back toward the sensor. This backscattered microwave radiation is detected, measured, and timed. The time required for the energy to travel to the target and return back to the sensor determines the distance or range to the target. By recording the range and magnitude of the energy reflected from all targets as the systems passes by, an image of the surface can be produced. Because radar provides its own energy source, images can be acquired day or night. Also microwave energy is able to penetrate clouds and most rain.
Table 6 - Radar band designations [IEEE Std 686-1997]
L-band 1 GHz and 2 GHz
S-band 2 GHz and 4 GHz
C-band 4 GHz and 8 GHz
X-band 8 GHz and 12 GHz
Ku-band 12 GHz and 18 GHz
K-band 18 GHz and 27 GHz
Ka-band 27 GHz and 40 GHz
V-band 40 GHz and 75 GHz
W-band 75 GHz and 110 GHz
8.2.4.1.2 Measurements
Radar systems make the following measurements:
• Intensity of microwave radiation at sensor
• Time taken for the emitted pulse of radiation to travel from the sensor to the ground and back
• Doppler shift in the frequency of the radiation echo as a result of relative motion of sensor and the ground
© ISO 2001 All rights reserved 23
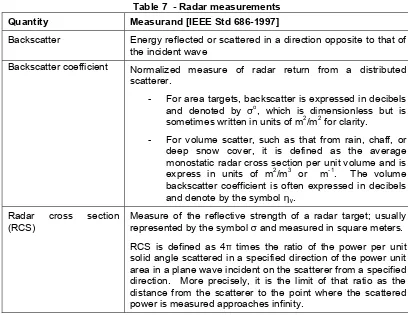
Table 7 - Radar measurements
Spatial resolution for radar is defied by a resolution cell. a resolution cell is a one-dimensional or multidimensional region related to the ability of a radar to resolve multiple targets. For radar dimensions that involve resolution can include range, angle, and radial velocity (Doppler frequency).
8.2.4.1.3 Derivable information
Imaging radar is high-resolution radar whose output is a representation of the radar cross section with the resolution cell (backscatter coefficient) from the object or scene resolved in two or three spatial dimensions. The radar may use real aperture (such as a sidelooking airborne radar), synthetic-aperture radar (DAR), inverse synthetic aperture radar (ISAR), interferometric SAR, or tomographic techniques.
SAR is coherent radar system that generates a narrow cross range impulse response by signal processing (integrating) the amplitude and phase of the received signal over an angular rotation of the radar line of sight with respect to the object (target) illuminated. [IEEE Std 686-1997] Due to the change in line-of-sight direction, a synthetic aperture is produced by the signal processing that has the effect of an antenna with much larger aperture (and hence a much greater angular resolution).
SAR Imaging Modes:
o Stripmap: antenna pointing is fixed relative to flight line(usually normal to the flight line). The result is a moving antenna footprint that sweeps along a strip of terrain parallel to the path motion.
o Spotlight: The sensor steers its antenna beam to continuously illuminate a specific (predetermined) spot or terrain patch while the platform moves in a straight line.
Quantity Measurand [IEEE Std 686-1997]
Backscatter Energy reflected or scattered in a direction opposite to that of the incident wave
Backscatter coefficient Normalized measure of radar return from a distributed scatterer.
- For area targets, backscatter is expressed in decibels and denoted by σo, which is dimensionless but is sometimes written in units of m2/m2 for clarity.
- For volume scatter, such as that from rain, chaff, or deep snow cover, it is defined as the average monostatic radar cross section per unit volume and is express in units of m2/m3 or m-1. The volume backscatter coefficient is often expressed in decibels and denote by the symbol ην.
Radar cross section (RCS)
© ISO 2001 All rights reserved 24
o ScanSAR: The sensor steers the antenna beam to illuminate a strip of terrain at any angle to the path of the platform motion.
A radar altimeter uses radar principles for height measurement. Height is determined by measurement of propogation time of a radio signal transmitted from the vehicle and reflected back to the vehicle form the terrain below.
Civilian radar systems have concentrated on radiometric accuracy and investigation of natural targets; the priority of military systems is the detection and recognition of man-made targets (often vehicles) against a clutter background. Ground based radar measures the rainfall density and line-of-sight velocity, e.g., NEXRAD. Ground-penetrating radar may be applied to detection of buried objects and determination of geophysical parameters below the surface.
8.2.4.2 Lidar sensor
8.2.4.2.1 General description
Lidar is a light detection and ranging sensor that uses a laser to transmit a light pulse and a receiver with sensitive detectors to measure the backscattered or reflected light. Distance to the object is determined by recording the time between transmitted and backscattered pulses and by using the speed of light to calculate the distance traveled. Lidars can determine atmospheric profiles of aerosols, clouds, and other constitutes of the atmosphere.
Multiple pulse returns
Relevant standards: TBS
8.2.4.2.2 Measurements
TBS
8.2.4.2.3 Derivable information
TBS: Altimetry, terrain
8.2.4.3 Sonar sensor
TBS
8.2.4.4 Seismic sensor
TBS
8.2.5 Calibration, validation and metrology
(Editors note: This clause will be built in part from the summary report of December CEOS/ISPRS joint task force on cal/val meeting. The summary report is also to be a base document for a TC211/WG6 project on remote sensing calibration and validation.)
Calibration is the process of quantitatively defining the system responses to known, controlled signal inputs [CEOS]
Calibration is a set of operations that establish, under specified conditions, the relationship between values of
© ISO 2001 All rights reserved 25
Validation is the process of assessing, by independent means, the quality of the data products derived from the system outputs [CEOS]
Calibration of sensor data is critical for comparison of observations over time and between sensors. Sensor data traceable to standard sources is critical to the use of observations in science-based activities. For example, UV monitoring from space offers the opportunity to achieve global coverage of the UV radiation field. Derived information is only useful to policy makers if the underlying data are rigorously quality assured, i.e. are “of known quality and
adequate for their intended use”.
Calibration is not always critical. For small target detection in single-channel data, image calibraion is often unnecessary because there is no concern for precise measurements only the contrast between the target and its background.
Techniques for calibration are based on metrology that establishes general rules for evaluating and expressing uncertainty in measurement. Metrology is mainly concerned with the uncertainty in the measurement of a well-defined physical quantity - the measurand - that can be characterised by an essentially unique value. It also covers the
evaluation and expression of uncertainty associated with the experiment design, measurement methods, and complex systems.
Metrology is focused on measurable quantities. A measurable quanity is an attribute of a phenomenon, body or substance that may be distinguished qualitatively and determined quantitatively [VIM]. A measurement is a set of operations having the object of determining a value of a quantity [VIM]. A measurand is a particular quantity subject to measurement [VIM].
A focus of calibration is to determine the accuracy of measurement. Accuracy is a qualitative concept that described the closeness of the agreement between the result of a measurement and a true value of the measurand [VIM]. Quantiatively the uncertainty of measurement characterizes the dispersion of the values that could reasonably be attributed to the measurand.
(Editor’s note ISO 19113 references ISO 3534-1 for definition of accuracy which differs from VIM definition)
Uncertainty of measurement comprises, in general, many components. Some of these components may be evaluated from the statistical distribution of the results of series of measurements and can be characterized by experimental standard deviations. The other components, which can also be characterized by standard deviations, are evaluated from assumed probability distributions based on experience or other information.
It is understood that the result of the measurement is the best estimate of the value of the measurand, and that all components of uncertainty, including those arising from systematic effects, such as components associated with corrections and reference standards, contribute to the dispersion.
For calibration, metrology defines the techniques of traceability. Traceablility is the property of the result of a measurement or the value of a standard whereby it can be related to stated references, usually national or international standards, through an unbroken chain of comparisons all having stated uncertainties [VIM]
For image sensing data requiring calibration, the uncertainty of the sensor shall be measured. Determination of uncertainty for an imaging sensor traceability shall be defined.
8.2.6 Position and attitude determination
© ISO 2001 All rights reserved 26
ISO 19116, Geographic infomation — Positioning services, specifies the data structure and content of an interface that permits communication between position providing device(s) and position using device(s) so that the position using device(s) can obtain and unambiguously interpret position information and determine whether the results meet the requirements of the use.
Table 8 - Positioning systems
Inertial positioning system
Positioning system employing accelerometers, gyroscopes, and computer as integral components to determine coordinates of points or objects relative to an initial known reference point
Satellite positioning system
Positioning system based upon receipt of signals broadcast from satellites
In this context, satellite positioning implies the use of radio signals transmitted from “active” artificial objects orbiting the Earth and received by “passive” instruments on or near the Earth’s surface to determine position, velocity, and/or attitude of an object. Examples are GPS and GLONASS.
Integrated
positioning system
Positioning system incorporating two or more positioning technologies
Measurements produced by each positioning technology in an integrated system may be any of position, motion, or attitude. There may be redundant measurements. When combined, a unified position, motion, or attitude is determined.
8.2.7 Image acquisition request
(Editors note: develop a UML class definition for image acquisition request)
Issues: data type and quality, observation/visibility requirements, data for planning and tasking
8.3 Geographic imagery information – processed, located, gridded
8.3.1 IG_Image
8.3.1.1 Introduction
This clause defines a geographic image as the class IG_Image. IG_Image is an information object. IG_Image is a type of geographic coverage.
The preceding clause described sensors for acquiring data that are used to create images. When the sensor data is combined with descriptive representation information an imagery information object is created. Information is a
© ISO 2001 All rights reserved 27
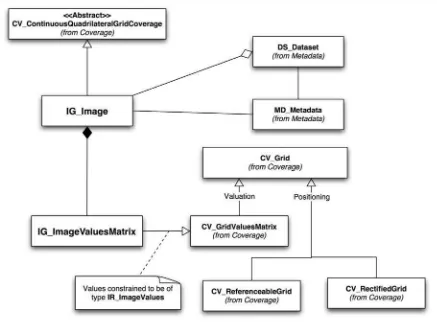
A geographic image is a type of coverage. Consistent with ISO 19101 and ISO 14721, IG_Image (Figure 9) is an aggregation of an image dataset. IG_Image may have an association with image metadata. IG_Image is a subtype of a gridded Coverage with a constraint on the values in the Coverage CV_GridValuesMatrix. The IG_ImageValues shall be sensor data or a derivation of sensor data. The Grid of an image may have not specific georeferencing or it may have georeferencing information available that allows for the gelocation of the grid cells, or the grid may be
georectified. Table 9 provides examples of IG_Image.
Data Models with respect to several standards and formats have been described in the ISO 19129 on Imagery and gridded data framework.
(Editors note: This section needs to be reviewed with respect to topics in common with ISO19129. By covering all of coverage and gridded data, 19129 is broader than 19101-2. By focusing on a data framework, 19129 is narrower than 19101-2.)