PHOTOGRAMMETRIC RECORDING AND RECONSTRUCTION OF TOWN SCALE
MODELS
–
THE CASE OF THE PLAN-RELIEF OF STRASBOURG
H. Macher a, *, P. Grussenmeyer a, T. Landes a, G. Halin b, C. Chevrier b , O. Huyghe c a
Photogrammetry and Geomatics Group, ICube Laboratory UMR 7357, INSA Strasbourg, France (helene.macher, pierre.grussenmeyer, tania.landes)@insa-strasbourg.fr
b
MAP-CRAI, UMR 3495, ENSA of Nancy, School of Architecture, France - (gilles.halin, christine.chevrier)@crai.archi.fr c
INGEO company, Engineering – Land surveyor, 62502 Saint-Omer CEDEX, France - [email protected]
KEY WORDS: Town scale model, Photogrammetry, Point cloud, Segmentation, 3D parametric modelling, Semantic enrichment
ABSTRACT:
The French collection of Plan-Reliefs, scale models of fortified towns, constitutes a precious testimony of the history of France. The aim of the URBANIA project is the valorisation and the diffusion of this Heritage through the creation of virtual models. The town scale model of Strasbourg at 1/600 currently exhibited in the Historical Museum of Strasbourg was selected as a case study. In this paper, the photogrammetric recording of this scale model is first presented. The acquisition protocol as well as the data post-processing are detailed. Then, the modelling of the city and more specially building blocks is investigated. Based on point clouds of the scale model, the extraction of roof elements is considered. It deals first with the segmentation of the point cloud into building blocks. Then, for each block, points belonging to roofs are identified and the extraction of chimney point clouds as well as roof ridges and roof planes is performed. Finally, the 3D parametric modelling of the building blocks is studied by considering roof polygons and polylines describing chimneys as input. In a future works section, the semantically enrichment and the potential usage scenarios of the scale model are envisaged.
* Corresponding author
1. INTRODUCTION
The French collection of Plan-Reliefs, scale models of fortified towns, is composed of more than one hundred scale models at 1/600 which can reach several tens of square meters. The scale models were designed for the most part in the 18th and 19th centuries for military purposes. They constitute a precious testimony of the history of France.
Many cities would like to exhibit and exploit these scale models. Unfortunately, they are rarely exhibited or exploited due to their fragility, their dimension and the required conservation conditions. Most of the scale models are unfortunately stored in containers and are not publicly available. The creation of virtual models appears to be an interesting solution for the valorisation and the diffusion of this historical heritage.
The aim of our project is to define a protocol for the acquisition, the reconstruction and the semantic enrichment of town scale models in order to create semantically rich 3D models. These models are intended to be integrated in a Geographic Information System. The information contained in these models will have to be flexible in order to meet different usage scenarios dedicated to the valorisation of this heritage.
In this paper, the photogrammetric recording of the town scale model of Strasbourg is first presented. Then, the segmentation of the point cloud of the city part of the scale model is considered. The automation of building blocks segmentation as well as the automation of roof elements (chimneys, ridges and planes) extraction are investigated. Finally, the 3D parametric
modelling of building blocks, which uses roof polygons as input, is proposed.
2. PHOTOGRAMMETRIC RECORDING
2.1 Object under study
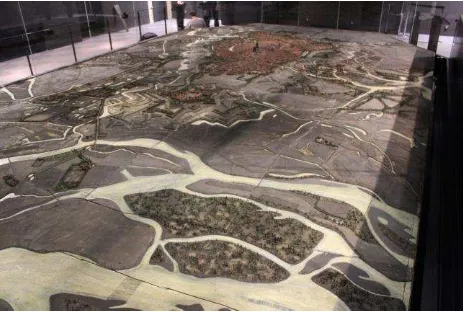
The scale model of Strasbourg (Figure 1), built from 1725 to 1728, was selected as a case study for the development of the protocol. It is currently exhibited in the Historical Museum of Strasbourg in a room with glass partitions. This scale model at 1/600 measures about 12 m per 6 m (72 m²). It is composed of several parts and is made of wood, wallpaper, silk and cardboard. The scale model provides historical information about the city of Strasbourg in the 18th century and was already considered in previous works (Hatt, 2002).
Figure 1. Scale model of Strasbourg of about 72 m²
The acquisition of such object is challenging since the constraints it imposes are great. Indeed, the recording must be carried out without contact with the model, only with non-intrusive techniques in order to avoid any risk of deterioration. Moreover, because of the dimensions of the model and the density of architectural elements, some parts of the model are difficult to reach. Considering a scale of 1/600, buildings do not exceed three centimeters height and street widths are of the order of the centimetre.
2.2 Acquisition protocol
In the case of the scale model of Strasbourg, it was not possible to remove the glass partitions and to dismantle the scale model but a mobile platform reserved for maintenance purposes allowed taking position above the scale model (Figure 2).
A marker system was installed in the platform and on the borders of the scale model so that a photo coverage of 70 % can be reached. The scale model was gridded with a step of 20 cm in length and width (white marks in Figure 2). At each grid position, four oblique photographs were taken from the platform in four opposite positions. Murtiyoso et al. (2014) highlighted the growing interest for the oblique aerial imagery for which one of the major application is the dense image matching. The primary quality of this technique is the disclosure of the entire building’s façade and its footprints.
Figure 2. Photogrammetric recording from the platform
A Canon EOS 550D digital camera was used for the photogrammetric recording with a lens of 50 mm. It provides a pixel size in the sensor of 4.4 microns and a pixel size on the object of approximately 0.2 mm with a distance to the object of about 2 meters. A total of about 5000 photographs were needed to cover the whole scale model. Five days were required for the photogrammetric recording.
2.3 Data post-processing
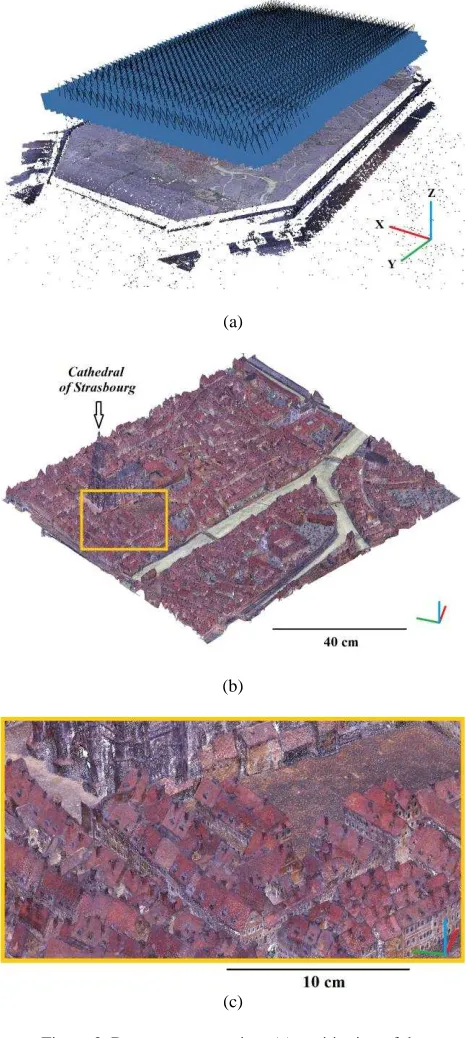
The post-processing of the photographs was performed with the commercial software Photoscan (Agisoft). The exterior orientation of the 5000 photographs is first calculated based on the matching of points of interest. This step includes the calibration of the digital camera. The result of the positioning of the photographs is shown Figure 3a.
The scaling of the model is then realized thanks to five distances measured on the borders of the model. The local position of the digital camera (position in the grid with a 20 cm step) is set up for each photograph in the software and is also
used for the scaling. A total error of 1.3 cm is observed for the positioning of the cameras.
Once the exterior orientation and the scaling are carried out, point clouds of more or less high density are generated. A medium density is chosen for the point cloud of the whole scale model whereas a high density is chosen for specific parts of the model where the density of architectural elements is important (Figure 3b and 3c). Additionally, a textured mesh and an orthophoto of the whole scale model as well as textured meshes of building blocks are created.
(a)
(b)
(c)
Figure 3. Data post-processing: (a) positioning of the photographs; (b) dense point cloud generated for a part of the scale model (~111M points, 1 m per 0.9 m); (c) zoom on dense
point cloud
Despite a high coverage of photographs, some parts of the scale model are missing in particular narrow streets surrounded by high buildings. Vertical photographs were taken additionally in order to improve the coverage of oblique photographs. However, there are only few differences between the two processing. For future acquisitions, a higher coverage will be adopted for the urban part of the scale model in order to avoid missing parts.
3. EXTRACTION OF ROOF ELEMENTS
In order to perform the 3D parametric modelling of the city, the point cloud of the scale model is first segmented into building blocks. Then, for each building block, the roof points are identified. Finally, the roof elements are extracted, i.e. chimneys, roof ridges and roof planes.
3.1 Segmentation into building blocks
The city was subdivided into 168 building blocks. The automation of block segmentation was first investigated. One should note that a specific numbering has been set up and therefore the saving of block point clouds could not be automated.
There are only few papers about the processing of such a point cloud. However, a parallel can be easily made with airborne LiDAR point clouds. A dense point cloud of a part of the city of the scale model presented in Figure 3b was selected as a case study. The density reached for this point cloud is one point every 0.1 mm.
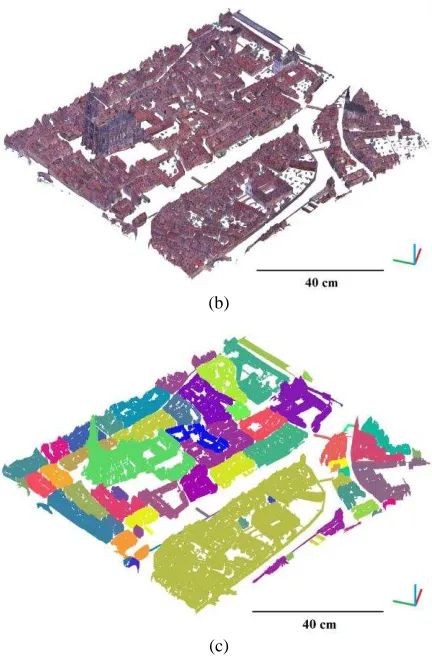
The ground points and the off-ground points are first separated. To this end, a tool originally foreseen for ground extraction of airborne LiDAR point clouds is used. It deals with the Cloth Simulation Filter (CSF) developed by (Zhang et al., 2016). In order to use this tool, a scaling factor of 100 is prior applied to the point cloud. Figure 4a and Figure 4b show respectively ground points and off-ground points obtained with this tool. Based on off-ground points, the building blocks, which are spatially separated, are then segmented using a connected-component analysis (Figure 4c).
This method doesn’t succeed to segment all the blocks. Indeed, on one hand some of the blocks are not spatially separated, and on the other hand there may be some noise between very close blocks. However, the presented method already allows segmenting 60 % of blocks automatically.
(a)
(b)
(c)
Figure 4. Segmentation into building blocks: (a) ground points; (b) off-ground points; (c) result of block
segmentation (one colour per block)
3.2 Identification of roof points
At this stage, the blocks are segmented. The point cloud of each block associated with the ground points surrounding it is considered. Before extracting roof elements, the roof point cloud has to be identified.
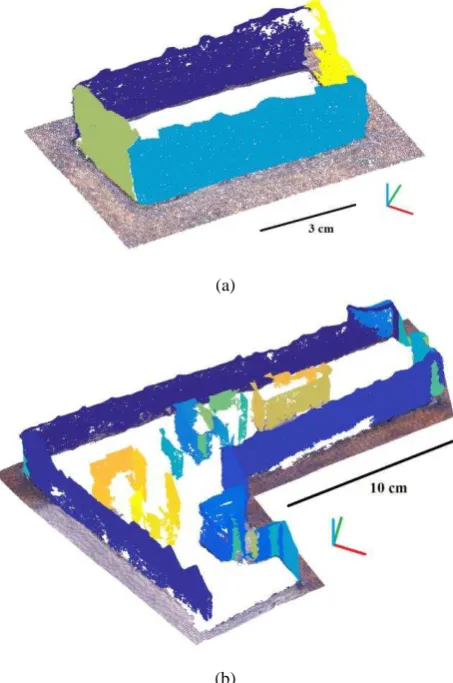
The ground surrounding the block is first extracted by segmenting a horizontal plane. The point cloud is rotated so that the ground follows the horizontal. It will allow exploiting the distribution of points along Z-axis in the next step. After removing the ground, façade planes are then extracted. A binary image is generated by considering the projection of points onto a horizontal plane. The boundaries of the binary image are used to identify points belonging to facades. Next, a segmentation into planes is performed. For both ground and facades, the segmentation into planes is performed thanks to a robust estimator MLESAC. It uses the same sampling principle as RANSAC but the retained solution maximizes the likelihood rather than just the number of inliers (Torr and Zisserman, 2000).
Figure 5 shows the result of ground and facade extraction for the block 5 and the block 6. The ground is in true colour whereas one colour is associated to each façade. One should notice that for block 6, one façade plane is missing. This is due to the fact that another block is situated very close and this façade was hence not captured. Moreover the largest facades may be modelled with several planes because of possible material deteriorations.
The points belonging to ground and façade planes are removed from the point cloud of the block so that the point cloud contains only the points belonging to roofs.
(a)
(b)
Figure 5. Extraction of ground and facades: (a) block 5; (b) block 6
3.3 Extraction of chimneys and roof ridges
The previous step allows extracting ground and facades of a block. Based on the remaining point cloud, which contains roof points, the extraction of chimneys followed by the extraction of roof ridges and planes are performed.
As mentioned before, a parallel can be made with the modelling based on airborne LiDAR point clouds. Several approaches are proposed in the literature for roof extraction based on LiDAR point clouds. The extraction of roof planes can be performed for example by using cross-line elements (Wu et al., 2016), the RANSAC algorithm (Tarsha-Kurdi et al., 2008), a combination between a Principal Component Analysis and a robust normal estimation method (Gilani et al., 2016), or even by analysing layers of the point cloud to detect roof ridges (Fan et al., 2014).
3.3.1 Principle of the adopted method: In order to extract both chimneys and roof ridges, roof point cloud of a block is divided into layers along the height. Each layer has an equal interval of height. Figure 6 shows an example of a roof point cloud divided into 47 layers of 0.3 mm height for a total height of 1.4 cm. The layers are colorized according to their height.
Figure 6. Decomposition of roof point cloud into layers
– block 5
This method was proposed by (Fan et al., 2014) for the segmentation of sloped roofs from airborne LiDAR point clouds. Their aim is to select layers from top to down and to detect linear components corresponding to roof ridges. In this paper, this method is used for the extraction of roof ridges and is adapted for the extraction of chimneys.
3.3.2 Chimney extraction: As it can be observed in Figure 6, the highest layers contain only the top of the chimneys. The layers are selected from top to down. In each layer, the elements spatially separated are analysed. Several criteria are taken into account in order to determine if these elements belong to chimneys. The number of points, the width and length and the ratio of width and length are considered. The width and length of a chimney are comprised between 1 mm and 5 mm for the block 5 and the block 6.
Based on the point cloud of elements following the defined criteria, a 3D region growing is applied so that one point cloud is created for each chimney. In order to obtain chimneys from top to bottom, the footprints of the chimneys on the roofs are finally extracted.
Figure 7 presents the result of chimney extraction for the block 5 and the block 6. One colour is attributed to each chimney point cloud. The proposed method was validated with 6 different blocks. For a total of 109 chimneys, 98 % were extracted automatically. Additionally, four false positives and two false negatives were counted but these elements could easily be corrected during the extraction of roof planes.
(a)
(b)
Figure 7. Extraction of chimneys (one colour per chimney): (a) block 5 – 5 chimneys extracted; (b) block 6 – 32 chimneys
extracted
3.3.3 Roof segmentation: The chimneys identified in the previous step are removed from roof point cloud. The layers are once again analysed in order to extract roof ridges and planes.
The process begins with selecting the layer of the top. Linear components are detected from these points thanks to MLESAC. These lines are supposed to be roof ridges. In order to validate it, several criteria are taken into account: the number of points of the line, the standard deviation of distances between points and line and also the length of linear component. The length of roof ridges is comprised between 0.5 cm and 4.5 cm for the block 5 and the block 6.
On both sides of the detected ridges, 3D points are used as seed points to determine two planes corresponding to roof facets. At this stage a roof ridge can still be rejected if the numbers of points of the two sides of the ridge are too unbalanced.
The highest roofs are thus extracted. In the next step, roof ridges as well as their corresponding two facets are detected at the second highest level, and so on until no roof ridge can be detected.
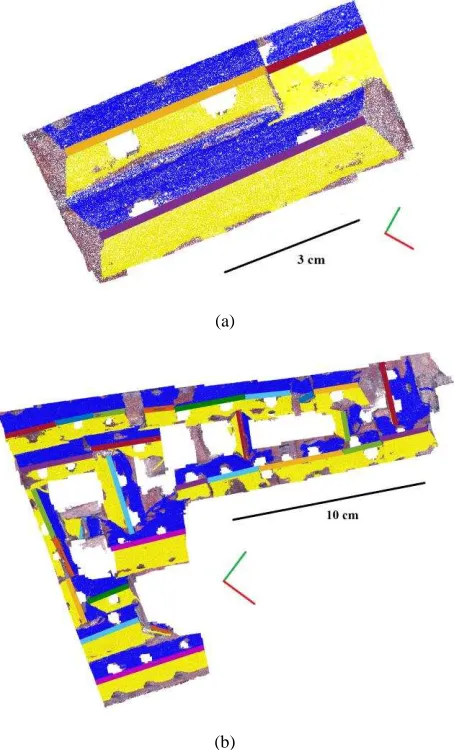
The results of the extraction of ridges and roof planes are presented Figure 8 in a top view for the block 5 and the block 6. One colour is attributed to each ridge and the two facets of roofs are presented in blue and yellow.
The results are promising. Indeed, almost all roof ridges are extracted. The extraction of small ridges and the corresponding roof facets is more complicated because there are not many points.
The 3D parametric modelling requires as input roof polygons. At present, the automatic approach presented above allows extracting chimney point clouds, roof ridges and roof planes. Thus, this approach is not yet complete. Intersections between planes have to be performed to determine roof polygons and chimneys have to be defined by polylines. This will be the aim of future works.
(a)
(b)
Figure 8. Segmentation of ridges and facets of roofs (top view): (a) block 5; (b) block 6
4. 3D PARAMETRIC MODELLING
The extraction of roof elements and the parametric modelling have been carried out during the same period. Since the automatic approach presented above is not complete, and in order to be able to test and develop the automatic 3D parametric modelling step, a graphical user interface was developed to draw polygons and other useful features namely points and lines on the 3D textured mesh of a block.
Thus for the city block 6, it requires around 8 hours of work to draw correctly the polygons (Figure 9). The manual drawing is time-consuming because of the quality of the 3D mesh in some parts (small courtyards, narrow streets, connexion of roofs) where approximations and curves are encountered. Rounded edges make the estimation of the correct position of points difficult. This led us to spend more time on the details of these bad areas to decide how to draw and adjust the polygon boundaries. The results of the automatic detection of roof polygons will probably need some manual corrections (addition, removal or modification of polygons). However, the automatic extraction of roof polygons will allow saving time and will be much more accurate.
Figure 9. Manual drawing of the polygons representing roof pans and top of chimneys used for the automatic parametric
modelling
Once the polygons are extracted (either with manual or automatic process), the automatic process for the 3D parametric modelling can start. It involves the following steps:
- Small polygons included in others are considered to be chimneys (on the ground projection);
- Polygons corresponding to roof pans are automatically grouped in houses, as described in (Chevrier et al., 2010);
- For each house, the characteristics of the roof pans are compared to each parametric model of the library in order to find the appropriate parametric model for the 3D modelling of the house. The models of the parametric library are described with graphical schemes as explained in (Chevrier, 2016);
- The orientation of the building is retrieved (Chevrier, 2015) and the modelling can be performed from the graphical schemes of the library parametric model as suggested in (Chevrier, 2016);
- The buildings are then textured from the photographs with the Photoscan software;
- Chimneys and walls, which are represented with polylines, and vegetation elements, which are represented with points, are computed.
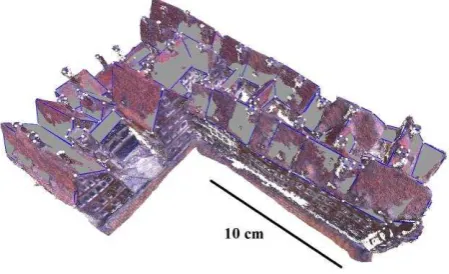
Figure 10 shows the result of the 3D parametric modelling of city block 2.
Figure 10. Result of the parametric modelling for city block 2
5. FUTURE WORKS
As mentioned before, the development of the segmentation approach will be continued in order to extract polygons describing roofs and polylines describing chimneys, which are required for the parametric modelling of building blocks. The 3D parametric modelling will be extended to all city blocks.
In future works, the created model will be semantically enriched. Templates of information sheets are established for the different types of houses. These sheets will be filled with information such as the address of the house, the date of construction and image, video or audio contents. They may also contain links with websites or with other architectural elements. The data entered in information sheets will be integrated in a Geographic Information System.
Different usage scenarios are under definition. General public in the Museum will first use the virtual model for discovering the scale model. Technicians may also exploit the virtual model of the scale model. Indeed, the virtual model can be used as a reference document when building or demolition permits are requested. It allows understanding how the building has evolved since the 18th century. For both usage scenarios, the superimposition of the virtual model with the actual 3D model of the city is envisaged.
6. CONCLUSION
In this paper, the photogrammetric recording of the scale model of Strasbourg was presented. Point clouds more or less dense as well as meshes are generated for the whole scale model and for some parts of it.
The automation of roof element extraction from point cloud of the city part of the scale model was investigated. The point cloud is first segmented into city blocks. Then, for each block, ground and facades are extracted. Finally, based on the remaining point cloud, roof elements are extracted. To this end, the point cloud is subdivided into layers. The analyses of these layers allow on one hand to extract chimney point clouds and one the other hand to extract roof ridges. Moreover, for each roof ridge the two facets of the roof are extracted. The results are promising since almost all the roof elements are extracted.
In order to perform the 3D parametric modelling of a block, the roof polygons are required as well as polylines defining the chimneys. The selection of polygons and polylines is at the moment done manually. This is time consuming and depends on the interpretation of the user. Future works about roof element extraction will allow automating the detection of polygons and polylines. Polygons are grouped into houses and the characteristics of roof pans are compared to parametric models of a library in order to find the appropriate parametric model for the 3D modelling of the house.
Once the virtual model of the scale model is created, semantic information will be added for each house that composes a block. Finally, the virtual model will be used in different ways. The usage scenarios are currently under definition.
ACKNOWLEDGEMENTS
The authors want to thank the French National Research Agency (ANR) for its financial support (project reference: ANR-15-CE38-0010-01).
REFERENCES
Chevrier, C., Jacquot, K. and Perrin, J. P., 2010. Modeling specificities of a physical town scale model. In: Proceedings of DMACH conference, Amman, Jordania, March 13-15, pp. 103-117.
Chevrier, C., 2015. Semi-automatic Parametric Modelling of the Buildings on Town Scale Models. Journal on Computing and Cultural Heritage (JOCCH), 7(4), pp. 1-20.
Chevrier, C. 2016. 3D Semantic Modelling of Scale Models from 2D Historical Plans. In: 14th EUROGRAPHICS Workshop on Graphics and Cultural Heritage, 2016, October 5-7, Genova, Italy.
Fan, H., Yao, W. and Fu, Q., 2014. Segmentation of sloped roofs from airborne LiDAR point clouds using ridge-based hierarchical decomposition. Remote Sensing, 6(4), pp. 3284-3301.
Gilani, S. A. N., Awrangjeb, M. and Lu, G., 2016. Robust building roof segmentation using airborne point cloud data. In: IEEE International Conference on Image Processing (ICIP), Phoenix, AZ, USA, pp. 859-863.
Hatt, T., 2002. Un système d'information géographique pour une cartographie historique de Strasbourg, de la carte à l'immeuble. XYZ, (92), pp. 21-24.
Murtiyoso, A., Remondino, F., Rupnik, E., Nex, F. and Grussenmeyer, P., 2014. Oblique aerial photography tool for building inspection and damage assessment. In: The International Archives of Photogrammetry, Remote Sensing and
Spatial Information Sciences, Denver, Colorado, USA, Vol.
XL-1, pp. 309-313.
Tarsha-Kurdi, F., Landes, T. and Grussenmeyer, P., 2008. Extended RANSAC algorithm for automatic detection of building roof planes from LiDAR data. The photogrammetric journal of Finland, 21(1), 97-109.
Torr, P. H., and Zisserman, A., 2000. MLESAC: A new robust estimator with application to estimating image geometry. Computer Vision and Image Understanding, 78(1), pp. 138-156.
Wu, T., Hu, X. and Ye, L., 2016. Fast and Accurate Plane Segmentation of Airborne LiDAR Point Cloud Using Cross-Line Elements. Remote Sensing, 8(5), 383, pp. 1-26.
Zhang, W., Qi, J., Wan, P., Wang, H., Xie, D., Wang, X. and Yan, G., 2016. An Easy-to-Use Airborne LiDAR Data Filtering Method Based on Cloth Simulation. Remote Sensing, 8(6), 501, pp. 1-22.