UAV APPLICATION IN COASTAL ENVIRONMENT, EXAMPLE OF THE OLERON
ISLAND FOR DUNES AND DIKES SURVEY
B. Guillot a , F. Pouget b
a Geography Master Student – University of La Rochelle, Master SPE (Environmental Science) [email protected] b Geography-GIS Lecturer - University of La Rochelle –UMR7266 LIENSs [email protected]
KEY WORDS: DSM, DVM, DDSM, UAV, coastal sand dune, dike, ortho-imagery, Oléron Island
ABSTRACT:
The recent evolutions in civil UAV ease of use led the University of La Rochelle to conduct an UAV program around its own potential costal application. An application program involving La Rochelle University and the District of Oleron Island began in January 2015 and lasted through July of 2015. The aims were to choose 9 study areas and survey them during the winter season. The studies concerned surveying the dikes and coastal sand dunes of Oleron Island. During each flight, an action sport camera fixed on the UAV’s brushless gimbal took a series of 150 pictures. After processing the photographs and using a 3D reconstruction plugin via Photoscan, we were able to export high-resolution ortho-imagery, DSM and 3D models. After applying GIS treatment to these images, volumetric evolutions between flights were revealed through a DDVM (Difference of Digital volumetric Model), in order to study sand movements on coastal sand dunes.
1. INTRODUCTION
Coastal environments are very challenging to study, with an important number of parameters to take in consideration, wind, water, temperature and climate (Pilkey, 2011).
Usually, coastal studies are based on IGN (French National Geography Institute) ortho-imagery, LIDAR (Light Detection And Ranging) imagery issued from a French program called Litto (Jolivet 2010), and ground DGPS (Differential Global Positioning System) measurements.
In 2014, The University of La Rochelle (France) started developing a UAV (Unnamed Aerial vehicle) program for coastal watching. In this program an UAV able to fly in windy, salty, and moistly conditions was developed.
The applications considered for such weatherproof UAV are focused on the monitoring of the evolution of coastal sand dunes and dikes at a very precise level, in particular before and after storms and/or important tide movements.
This method is an approach of high frequency measurements, like high frequency Lidar measurements (John 2009), but with a stereo photogrammetric method (Egels 2011), and the use of an UAV (Pierrot Deseilligny 2011).
A partnership with the Oleron Island District (figure 1) was then held to apply methods and tools developed previously (Thamm, 2009), in association with their Action Program against Flooding (PAPI In Fench). Another objective was to update and increase the knowledge of their dikes and coastal sand dunes.
In the last 15 years, the Island has been affected by an important number of winter storms, regarding the 2013- 2014 winter. The island also suffered from Xynthia storm in February 2010 (Sauzeau, 2014), and the Martin storm back in December of 1999.
Considering these storms and their effects (deaths, coastal backward movement) (Prat, 1997), the District of Oleron Island decided to launch the programm PAPI (In French). In association with this program, the GEMAPI regulation (GEMAPI In French, flooding prevention and aquatic environments management) will give the municipalities the authority of managing and surveying their dikes.
As a consequence, the university decided to lead a common action to survey the dikes and coastal sand dunes of the Oleron Island. For 6 months, (from January 2015 to July 2015), more than 40 flights were led on oversea areas Island.
This application enabled us to answer different questions: 1 - Can the coastal UAV application be interesting for coastal researches?
2 – Can the coastal UAV application be precise enough to measure sand and dike movements?
3 – Can this application be more efficient than traditional methods?
4 – Can the coastal UAV application be less expensive than traditional methods?
The 3D reconstructions were lead using the softwares “Agisoft Photoscan” and “Esri ArcGis”.
A Digital Surface Model (DSM) is produced at every flight with 15 cm spatial resolution and elevation precision less than 10 cm. After this first process, a volumetric model is then computed to measure the differences between flights, and Lidar data. It is called the DDVM (Difference Digital Volumetric Model) and involves volumetric evolutions of different sites. The International Archives of the Photogrammetry, Remote Sensing and Spatial Information Sciences, Volume XL-3/W3, 2015
1.1 Study Area
Oleron Island is located on the French West coast (figure 1). The island is affected by a macrotidal environment.
The major swells usually come from the West then depart Northbound then come back towards the West. Major winds on the other hand, only come from the West (Musereau, 2009). A large part of the island (the north of the Island) is based on a solid limestone substratum. This type of substratum affects the beaches protected by a solid reef, creating waves breaking upstream sand. The sand movements on the northwest beaches are less efficient than the sand movements of the southwest beaches.
The southwest beaches are not protected by a solid substratum like the north of the island. Sand movements and coastlines are more mobile. On those beaches, a negative coastline evolution of more than 20 m / year is common (Prat, 2002). These evaluations have remained the same since the 1990s.
Climate is moderate, with an oceanic influence. Temperatures are favourable with less than 10 days of freezing per year, and an annual temperature of 12.5 °C (Musereau, 2009).
0°0'0" 4°0'0"O
50
°0
'0
"N
46
°0
'0
"N
Figure 1: Localisation of the study area.
1.2 Adequacy of traditional tools for littoral studies?
Traditional tools used to work on coastal environments are mainly based on high-resolution imageries (50 or 20 cm), produced by the French IGN, in natural colours (RGB), and infrared colours. The first national ortho-images were produced in 1999. It is important to underline that the national ortho-images are produced every 5 years.
Since the First World War, the IGN has led several aerial photographic missions. For historic researchers, like coastline evolutions, those data are downloadable for free in the French
IGN Geoportal
(http://www.geoportail.gouv.fr/accueil).
About altimetric evolutions, a first topographic LIDAR survey on the Oleron Island was led in 2010, by the French IGN. However, information about the next campaign is not available.
Another alternative could be satellite images but the price of producing them can be a major limiting factor. Moreover, their spatial resolution is limited (about 50 cm).
Furthermore, coastal environments are very mobile and a better frequency of data can be very interesting for improving the knowledge of littorals.
That is why we decided to build a coastal UAV.
By equipping the UAV with small action sport cameras, the possibilities to fly in hard weather conditions were obtainable, even during windy conditions.
For littoral studies, it provided the possibility to measure weather conditions before storms and important tide movements.
2. MATERIAL AND METHODS
2.1 Data acquisition
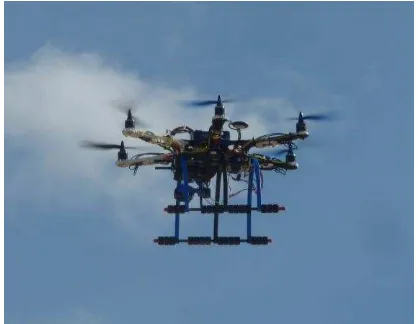
A resistant UAV (figure 2) based on a F550 frame (DJI, Shenzhen, China) has been developed. The UAV included motors that are more powerful than the stocked DJI motors. The multi-copter can fly up to 60 km/h of wind speed and be resistant to sand particles and moisture.
The mechanics inside these UAVs allow the UAV crashing from 50 m height, without important damages.
The camera is an action sport camera supporting 12 million pixels. It is configured to take a picture every 2 seconds. The pictures can be taken all the way up to 8 m/s of the UAV speed. The camera is mounted on a two axis AGM brushless gimbal (AGM Hobby, Berlin, Germany), stabilized by a Martinez controller board (By Martinez, Amberg, Germany). The gimbal is built to dissociate itself in case of crash. This prevents the camera of hard shock.
The total weight of the UAV is less than 3 Kg. The UAV is drained with 4.4 amps and 3s Lithium-Polymer battery (lipo) that provides a total flight time of 8 minutes. It can also be configured to support 8 amps, a 3s lipo battery procuring a total flight time of 13 minutes. It is estimated that the total price point for the UAV, a UAV pilot licence and the post-processing computer is less than 12.000 €.
Figure 2: The UAV used during the flights, based on a modify F550 DJI frame.
The aim of the acquisition protocol is to reveal a series of pictures with a high overlap between two shots.
Before the flight, ground control points (GCPs) are placed and marked with a differential GPS (Trimble GEO XH) taking the latitude, the longitude and altitude of each point. The DGPS has less than 10 cm of vertical precision.
The working coordinates are based on the EPSG projection
During the flight, the UAV is controlled in manual mode by an operator. The flight altitude is between 30 m and 50 m above ground level. Its choice depends on the final pixel size needed. By flying at 30 m the final pixel size after post-processing is less than 3 cm.
Two camera orientations are used, the first one between -85 ° and - 90° (0 is horizontal alignment) for land covering, and the second between – 80 ° and – 45 ° for covering land reliefs like dikes, or beach cliffs. A flight never exceeds 6 minutes, for safety reasons, due to the small battery capacities. Those small duration flights open the possibility to cover almost 10 Ha, with a number of about 150 pictures. In the coastal application, generally with linear spots, it is possible the possibilities are given to cover nearly 600 m of coastline. The working time on the spot is less than 2 hours, for a configuration of 600 m of coastline.
2.2 Post – processing and 3d reconstruction
Post processing transforms the series of pictures into a 3D model, an ortho-mosaic, and a DSM.
The first step of post-processing is to perform the differential corrections of the GCPs positions marked during the mission. The corrections are achieved on the phase and carrier wave, by taking the referent station of the RGP (In French, Permanent GPS Network). In our case, the closest referent station is “l’Ile d’Aix” (less than 10 km, coordinates: 01° 10' 36.50849" O, 46° 00' 33.93898" N, elevation: 59.027 m ; (http://rgp.ign.fr/STATIONS/#ILDX).
Each point has a final vertical precision less than 10 cm.
The second step of post-processing is to correct the wide angle (Fisheye) of the camera. A bearing distortion model is applied on all pictures with a reframing to cut distorted areas.
After those two steps, the set of pictures is provided to the Agisoft Photoscan software for 3D reconstruction.
Before the 3D reconstruction process, a specific task is realized for applying masks onto backlight, and establishing UAV landing skids.
The first 3D reconstruction process, i.e. the relative alignment of cameras, is always realized on the entire part of images (high quality settings). The other processes, dense cloud, mesh and texture, are realized only in low quality shots to help the geo-referencing processing and save time.
After recognizing and marking all GCPs, the post-processed GPS data information is imported. The project (geo-referenced)
is then completely rebuilt with higher spatial resolution for the second time.
Generally, the overall process of 3D reconstruction does not exceed 40 minutes with high quality settings. This small computation time is the consequence of the use of a specific computer (Intel I7 CPU with 32 Gb of ram).
The outcome material after each reconstruction includes: - A very high-resolution ortho-mosaic of the land covered by flight
- A DSM of the land covered by flight
- A 3D PDF (Portable Document File) model (without geo-referencing), or, a Sketchfab 3D model, of the land covered by flight
Before sending all final ortho-imagery, and DSM to the GIS Software, a 3D model checking is necessary to prevent and remove residual errors (the majority of errors in 3D models are usually located on their edges).
2.3 GIS ANALYSIS
All GIS processes are done with Esri Arcmap software.
2.3.1 Ortho-imagery verifications
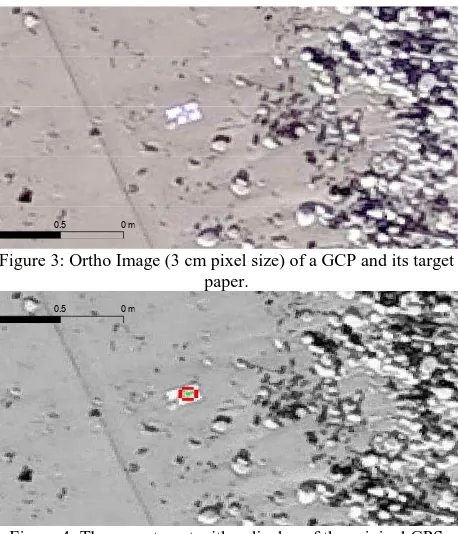
The geo-referencing control of the ortho-image is achieved by considering the original GCPs (figure 3), marked with the differential GPS.
The original points are displayed over the ortho-image (figure 4) by GIS software. The maximum tolerance distance requested by the program between each GPS point and the centre of the target is 7 cm. If the points are greater than 7 cm apart from each other, the whole Photoscan geo-referencing process is re-iterated.
Figure 3: Ortho Image (3 cm pixel size) of a GCP and its target paper.
Figure 4: The same target with a display of the original GPS point. (grey scale has been chosen for better visualisation).
1 0.5 0m
1 0.5 0m
2.3.2 Elevation differences
Elevation differences are computed from the DSM data issued from successive flights.
A simple calculation (Eq. 1) is made to create a DDsm (Difference of Digital Surface Model).
(1)
Where DDsm = Difference of Digital Surface Model (m)
Dsm 2 = The newest DSM (m)
Dsm 1 = The oldest DSM (m)
2.3.3 Volumetric evolutions
After the production of a DDsm, another simple calculation (Eq. 2) transforms this DDsm into a DDVM (Difference of Digital Volumetric Model) which evaluates the volumetric evolutions between two flights for each pixel.
The final units of our application are in cubic meters (due to the initial vertical coordinate systems).
(2)
Where DDVM = Difference Digital volumetric Model (m3)
DDsm= Difference of Digital Surface Model (m)
Cs = Pixel size of the DDsm image (m)
Total volumetric evolution can then be easily obtained by a sum function using statistic tools of the GIS software.
Other statistics are also available: the minimum value (Min), the maximum value (Max), the mean value (Mean), the number of cells in each polygon (Count), and the range of values (Range). All those results give precise statistics of evolutions and uncertainties for analysis.
Notice that due to the coastal configuration of each study area, the DSM is very similar to the DEM (Digital Elevation Model) produced by the French IGN using Lidar measurements: coastal vegetation is very low and buildings and other human elevation infrastructures can be simply cleared from the DSM.
Due to those similarities, comparisons can be made between Lidar imagery, and UAV DSM imagery for checking purposes.
3. EXAMPLE OF RESULTS
3.1 High resolution ortho-imagery examples
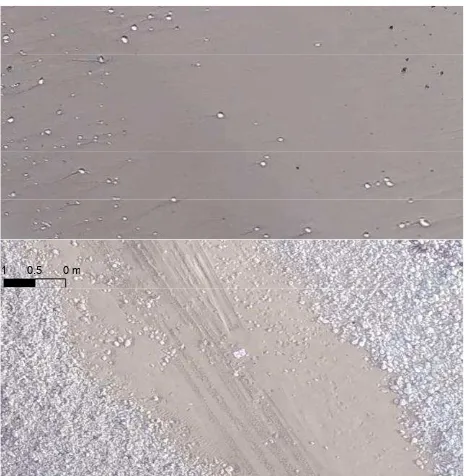
The high-resolution ortho-images produced on all the study areas were analysed according to the method presented above. The figures below (figure 5) show an example of comparisons of the same area between January and April’s flights. These photographs were taken at the Beach of Les Huttes (North of Oleron Island)
We can see radical changes between January (Top photography) and April (Bottom photography) with the arrival of a new stock of pebbles. On April’s (bottom) ortho-photographs, we can observe a ground target (at the centre of the picture). The cell size of each ortho-photographs, are less than 3 cm.
1 0.5 0Mètres
Figure 5: Comparison between the January mission (top picture), and the April mission (bottom picture) on the Beach of
“Les Huttes” (same area extracted from each ortho-photography).
Before the use of UAV, the tool used for this type of work was an ortho-imagery produced by IGN at 50 cm of cell size (figure 6): The pebbles are not visible; it is difficult for the scientists to comment the nature of substratum.
Figure 6: The same area than the figure 5 with the IGN 50cm cell size imagery.
3.2 Elevation evolutions
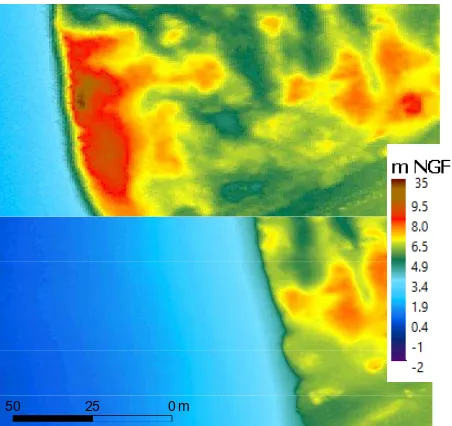
In this example, we show the evolutions at the beach of Grand Village Plage (In French). This beach is not protected by a rock substratum. An important backward movement has been affecting the coastline since 1990.
The top picture is the Lidar imagery (French IGN Litto, 2010; 3D cell size: 1m). The bottom picture is the DSM of the same area issued from the UAV mission of March 2015 (cell size of 10 cm).
The major differences show the important backward movement of the coastline, and the total erosion of the front sand dune (figure 7).
1 0.5 0m
1 0.5 0m
Figure 7: Comparison of the same area between Lidar 2010 (top picture) and UAV imagery 2015 (bottom picture).
3.3 DVM examples
The DDVM lead the opportunities to evaluate the volumetric evolutions between 2 dates.
The result of a DDVM calculation is a raster. Each cell contains the volumetric difference between two dates.
The figure 8 shows the result of the evolutions between October 2014, and March 2015 on the Grand Village Beach. We can observe the beginning of an erosion process of the dune terrace.
Figure 8: Example of a DDVM without any polygon
After a GIS treatment, polygons can be drawn on previous DDVMs.
A zonal statistic can be realised to calculate the volumetric evolutions.
On figure 9 lies a drawing of polygons in link with zonal statistics. We can see that the central beach (between low tide level and high tide level) is in accretion with more than 11.500 m3.
There is less than 200 m3 in the erosion process of the dune terrace.
11583
11265
5129
1682 -632
198 85
-130 -13
-3
Figure 9: Example of a DDVM with polygons and zonal statistics. Units are in m3.
3.4 Topographic profiles of dike surveys
The computation of DSM and DEM gives the opportunity to extract 2D topographic profiles in GIS software.
The altimetry precision less than 10 cm is enough to lead rock dikes surveys.
A rock dike is a dike only built with an important number of rocks. Examples are shown in figure 10.
The examples found below are located at the beach of La Perroche on the Center-West of Oleron Island. This dike was built in January of 2014 without any topography measures.
The mission purpose was to digitize the dike, and transform the image into a DSM.
Figure 10: Example of a rock dike. Extraction from ortho-imagery, cell size 2 cm.
Figure 11: DSM of the Rock dike of La Perroche. The cell size is 9 cm.
The figure 11 shows the DSM of the same area than in figure 10.
50 25 0m
50 25 0m
50 25 0m
10 5 0m
10 5 0m
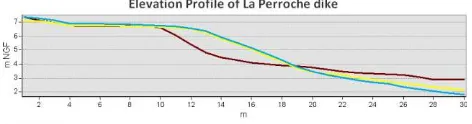
The figure 12 shows the altimetry profile realized with GIS software. We can observe the Lidar Topography of August 2010 (Red), the UAV missions of October 2014 (Yellow), and March 2015 (Blue):
Figure 12: Topographic differences of a rock dike on the Perroche Bay (Oleron Island).
CONCLUSIONS
The new opportunities led by the recent evolution of UAVs can be really pertinent in coastal applications.
The possibility of high frequency measures, like daily, weakly, or monthly measures, offer new opportunities to geographers. Scientists now have a tool that is able to fly in hard littoral climatic conditions, producing very precise data on-demand. There weren’t many storms during the winters of 2014-2015, but the results of different missions and campaigns were very positives.
The production of high resolution DSM and DVM has given us opportunities to study coastal sand dunes and dikes at the scale of a few centimetres.
The high-resolution imagery can also have a lot of other applications including the study of sand movements, pebbles movements, birds, wastes and even the evolution of seaweed. Several missions are already planned to better appreciate the relevance of such methods, with further discussion about their limits.
This tool can be very efficient to improve the knowledge of mobile ecosystems, and maybe to better anticipate the future.
REFERENCES
John C., Brock and Samuel J., Purkis, 2009. The Emerging Role of Lidar Remote Sensing in Coastal Research and Resource Management. Journal of Coastal Research: Special Issue 53: pp. 1 – 5.
Egels Y., 2011. La Photogrammétrie, principes généraux et terminologie, ENSG, in Images et modèles 3D en milieux naturels, EDYTEM, 217p.
Jolivet P., Lamarre V., 2010 Litto3D, v 1.0, spécifications techniques (version 1.4), IGN, SHOM, 16p.
Musereau J., 2009. Approche de la gestion des cordons littoraux : Mise au point et application d’un indice d’érosion (Zone des Pertuis Charentais, France), Thèse de Doctorat en géographie, Rennes laboratoire COSTEL, 306 p. (dir H. REGNAULD).
Pierrot Deseilligny M., Clery I., 2011. Evolutions récentes en photogrammétrie et modélisation 3D par photo des milieux naturels, IGN MATIS, in Images et modèles 3D en milieux naturels, EDYTEM, 217p.
Pilkey O-H., NEAL W-J., Kelley J-T., Andrew J., Cooper G., 2011. The world’s beaches, a global guide to the science of the shoreline, University of California Press, 283P.
Prat M-C., 2002. Transferts sableux, échanges entre plage et dune, bilan sédimentaire, in Connaissance et gestion durable des dunes de la côte atlantique LIFE, dir J. FAVENNEC, Dossiers forestiers n°11, 380p.
Prat M-C., Salomon J-N., 1997. L’évolution récente du littoral Charentais. Lignes de ravage et systèmes dunaires, In: Quaternaire - Volume 8 - Numéro 1 - 1997. pp. 21-37.
Sauzeau T., Peret J., 2014. Xynthia ou la mémoire réveillée, Gestes Editions, 296p.
Thamm H-S., 2009, Utilisation expérimentale d’un aéronef ultraléger (UAV), pour une télédétection à haute résolution, Impetus Atlas Benin, 2P.