GROUNDWATER POTENTIAL ASSESSMENT USING GEOGRAPHIC INFORMATION
SYSTEMS AND AHP METHOD (CASE STUDY: BAFT CITY, Kerman, IRAN)
M. Zeinolabedinia *, A. Esmaeilyb
Dept. of Water Resources Engineering, Graduate University of Advanced Technology, Kerman, Mahan, 7631133131, Iran - [email protected]
Dept. of Remote Sensing Engineering, Graduate University of Advanced Technology, Kerman, Mahan, 7631133131, Iran - [email protected]
Commission VI, WG VI/4
KEY WORDS: Underground Water, AHP, GIS, Remote Sensing
ABSTRACT:
The purpose of the present study is to use Geographical Information Systems (GISs) for determining the best areas having ground
water potential in Baft city. To achieve this objective, parameters such as precipitation, slope, fault, vegetation, land cover and
lithology were used. Regarding different weight of these parameters effect, Analytic Hierarchy Process (AHP) was used. After
developing informational layers in GIS and weighing each of them, a model was developed. The final map of ground waters
potential was calculated through the above-mentioned model. Through applying our developed model four areas having high,
average, low potential and without required potential distinguished. Results of this research indicated that 0.74, 41.23 and 45.63
percent of the area had high, average and low potential, respectively. Moreover, 12.38% of this area had no potential. Obtained
results can be useful in management plans of ground water resources and preventing excessive exploitation.
1. INTRODUCTION
Ground water is a main source for industries, communities and
agricultural consumptions in the world and due to its freshness,
chemical compounds, constant temperature, lower pollution
coefficient and higher reliability level, considered as a basic
source of supplying reliable fresh water in urban and rural areas.
Ndtmomys, mbduw 34% df weh tdlro’s tmwhl lhsdul hs bhrdei wd
ground water and is an important source of drinkable water.
Iran is an arid and semi arid country with very little rainfall; so
that its average annual rainfall is lower than one-third of the
tdlro’s mnhlmih meeumr lmgefmrr (Nampak et al., 2014; Rahimi & Moosavi, 2013; Magesh et al., 2012; Seif & Kargar, 2011).
Therefore, recognizing these resources and optimal usage of
them, means stable and permanent usage of this natural wealth.
A common method for preparing ground water potential maps is
based on land surveying. Recently, with the help of GIS and RS
technologies, potential detection of ground water resources can
be done easier, more accurate and in short-time.
GIS is a powerful tool to address a large number of spatial data
and can be used in detection process of potential ground water
areas. Recently, many studies conducted through indices of
ground water potential models. Some of them are as follows:
frequency ratio, weights of evidence and AHP. In the present
study, analytic hierarchy process and GIS technique used to
determine the best water resources for optimal usage of ground
water resources in Baft city. AHP can be done in different ways,
one of these methods is to use expert choice software which its
implementation and calculation stages done automatically
(Nampak et al., 2014; Magesh et al., 2012; Al-Harbi, 2001).
Moreover, different studies conducted through GIS technique.
Using GIS, Abdalla, 2012, Venkateswaran et al., 2015, Dar et
al., 2010, Nampak et al., 2014 and Elbeih 2015, studied
underground resources of eastern and central desert of Egypt,
underground resources potential in hard stones of Gadilam
river basin, ground water conditions of Mamundiyar basin in
Tamilandu, spatial efficiency prediction of underground
resources of Langat basin in Malaysia and underground
resources in Europe, respectively. Rahimi et al., 2013, Seif et al.
2011 and Yamani et al., 2014 researches were in line with the
above-mentioned studies (Abdalla, 2012; Venkateswaran &
Ayyandurai, 2015; Dar et al., 2010; Nampak et al., 2014;
Elbeih, 2015; Rahimi & Moosavi, 2013; Seif & Kargar, 2011;
Yamani & Alizadeh, 2014) . This study tries to determine the The International Archives of the Photogrammetry, Remote Sensing and Spatial Information Sciences, Volume XL-1/W5, 2015
best water resources of the area (for optimal usage and
preventing excessive exploitation) through analyzing effective
parameters on ground water aquifers feeding, exfoliation, raster,
weighting to components by means of analytic hierarchy
process and combining layers in ArcGIS environment.
2. STUDY AREA
latitude and 56 degrees and 36 minutes of east longitude (Figure
1). According to the last official statistics, its population is
about 131567 individuals and is one of the rainiest cities of
Kerman. Baft is known as the heaven of Kerman province, but
in recent days, excessive usage of ground water resources
resulted in water rationing. The main reason of water shortage
in Baft city is plantation in surrounding plains which leads to
withdrawal of considerable volume of ground water.
Figure 1. Geographical location of the study area
3. DATA AND METHODS
At first, with the help of Google Earth satellite images, the
study area studied and determined. Then, in order to zone the
area in terms of ground water resources potential, the following
steps performed:
3.1 Parameters and layers generation
In the present study, precipitation, slope, fault, lithology,
vegetation and land cover layers used to detect water resources
having different potentials. Vegetation layer is a product of
NDVI of Modis sensor with spatial accuracy of 250m, and Dem
of Aster sensor with spatial accuracy of 30m and altitudinal
m ulm y df 20a. Iefdlamwgde df 23 thmwehl swmwgde’s meeumr
precipitation (1962-2006) presented here. Layers obtained from
3.2 AHP processing
Analytic hierarchy process (AHP) is one of the most effective
multi-criteria decision making (MCDM) techniques which helps
a decision maker facing complex problems and conflict and
internal multiple criteria. This method first presented by
Thomas L. Saaty (1980) and like other MCDMs such as
Mabeth, Electre, Smart, Promeyhee, VTA and etc. has 4 steps
including 1) problem modelling and making hierarchical
structure, 2) evaluating weights, 3) combining weights and 4)
analyzing sensitivity. Implementing AHP method with the help
of expert choice software is so easy, since accessing to it is easy
and its implementation and calculation steps done
automatically. In addition to the possibility of designing
hierarchical diagram, decision making, designing questions,
determining priorities and calculating the final weight, the
above-mentioned software can analyze the sensitivity of
decision making about the changes of problem parameters. In
most cases, appropriate diagrams and graphs used for presenting
results and performances and a user can communicate easily. In
this research, after obtaining available layers through remote
sensing data and other available resources, all layers analyzed in
Arc Gis environment and converted to raster data. Using expert
choice software, an inter-criterion and intra-criterion weight
determined for layers and their classes, respectively. Finally,
with the help of ArcGIS software and Raster Calculator
toolbox, layers overlapped and potential map and ground water
obtained (Rahimi & Moosavi, 2013; Ishizaka & Labib, 2009;
Al-Harbi, 2001; Zhu & Xu, 2014).
4. RESULTS
4.1 Weighting and layers
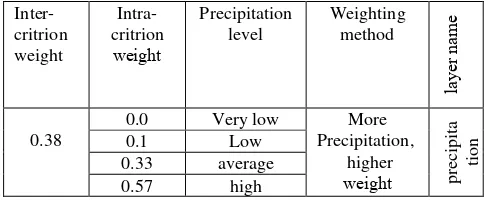
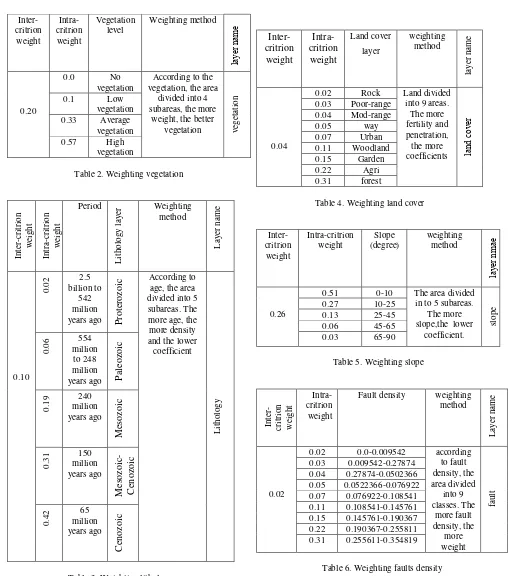
Tables 1 to 6 show the results of weighting each parameter and
according to weighting method, inter and intra-criterion weights
calculated.
Inter-Table 4. Weighting land cover
4.2 Classified map generation
After weighting and regarding their spatial position, each
parameter classified and obtained results presented in figures 2
to 7.
0.51 0-10 The area divided
in to 5 subareas.
Figure 2. precipitation classification map
Figure 3. Vegetation classification map
Figure 4. Slope classification map
Figure 5. land cover classification map
Figure 6. Fault classification map
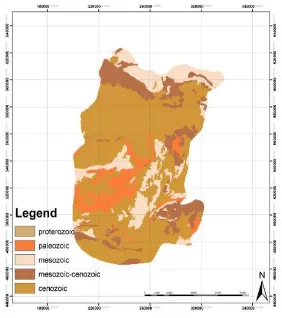
Figure 7. Lithology classification map
5. FINAL MAP
In order to determine areas having ground water resources, a
weighted overlap mathematical model used. Mathematical
overlap result is a suitability map which regulated in terms of
the degree of suitability and included different spectra of colors. The International Archives of the Photogrammetry, Remote Sensing and Spatial Information Sciences, Volume XL-1/W5, 2015
Each layer has an inter-criterion weight. In order to prepare
ground waters potential map, we can put all weights in the
following formula:
GP= 0.04*RC+0.26*RS+0.02*RF+0.10*RL+0.38*RP+0.2*RV
Where RP= raster-precipitation map
RL= raster-lithology map
RF= raster-fault map
RS= raster-slope map
RC= raster-land cover map
And
RV= raster-vegetation map
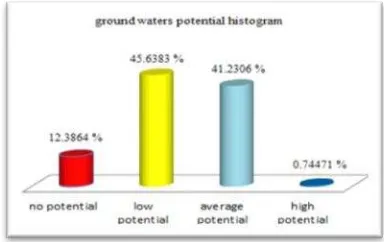
After overlapping layers, the final potential map divided into 4
areas (figure 8) and then, in order to show water potential map
of the area, histogram related to it presented. It shows that only
0.74% of the study area has high potential of water resources
(figure 9).
The results show that high-potential area is located in the
southeast region and around forest areas (with average
vegetation and high precipitation). Moreover, this zone is
related to Cenozoic period (minimum age) and its slope is very
low (0-10 degrees). The zone without required potential is
located in central, west and southwest areas and its precipitation
and slope are very low and high, respectively and our
considered zone has no vegetation. Fault density in both zones
is low, but since precipitation and slope layers have most
coefficients, the area with high precipitation and low slope and
the area with very low precipitation and high slope located in
the zone with high potential and the zone without required
potential, respectively.
Figure 8. The final map of ground water potential
Figure 9. Ground waters potential histogram
6. CONCLUSION
The present study shows that GIS is an appropriate tool for
evaluating ground water potential. Based on GIS, appropriate
locations for drilling wells and ground water withdrawal can be
determined. In addition, AHP used by programmers for solving
complex problems of management and expert choice software
makes its implementation easier (Ganapuram et al.,2009;
Abdalla, 2012; Venkateswaran & Ayyandurai, 2015).
In this study, combining spatial data in GIS and expert choice
software was used in order to determine areas having high
potential for ground water resources. 6 different layers
including precipitation, vegetation, land cover, lithology, slope
and fault used. Each of them and their classes had inter and
intra criterion weights, respectively. Finally, through putting 6
layers on each other, potential map prepared. Final map divided
into four areas which showed 0.74, 41.23 and 45.63 percent of
the area had high, average and low potential, respectively.
Moreover, 12.38% of this area had no potential (figures 8 and
9).
References
Al-Harbi, K.M.A.S., 2001. Application of the AHP in project management, International journal of project management, 19(1), pp. 19-27.
Damavandi, A.; Rezaei F.; Panahi, M., 2011. Ground water potential zoning using RS and GIS in Sele Ben Watershed,
Second Conference in Geoscience. Tehran, Iran (In Persian)
Dar, I.A.; Sankar, K.; Dar, M.A. 2010. Remote sensing technology and geographic information system modeling: An integrated approach towards the mapping of groundwater potential zones in Hardrock terrain, Mamundiyar basin, Journal
of Hydrology, 394(3-4), pp. 285-295.
Elbeih, S.F. 2015. An overview of integrated remote sensing and GIS for groundwater mapping in Egypt, Ain Shams
Engineering Journal, 6(1), pp. 1-15.
Ganapuram, S.; Kumar, G.T.V.; Krishna, I.V.M.; Kahya, E, 2009. Mapping of groundwater potential zones in the musi basin using remote sensing data and GIS, Advanced in
engineering software, 40(7), pp. 506-518.
Ishizaka, A., Labib A. 2009. Analytic Hierarchy Process and Expert Choice: Benefits and limitations, OR Insight, V. 22, pp. 201-220.
Magesh, N.S.; Chandrasekar, N.; Soundranayaga J.P. 2012. Delineation of groundwater potential zones in Thenim district, Tamil Nadu, using remote sensing, GIS and MIF Techniques,
Geoscience Frontiers, 3(2), pp. 189-196.
Nampak, H.; Pradhan, B.; Manap, M.A. 2014. Application of GIS based data driven evidential belief function model to predict groundwater potential zonation, Journal of Hydrology, V. 513, pp. 283-300.
Oikonomidis, D.; Dimogianni, S.; Kazakis, N.; Voudoiri, K. 2015. A GIS/remote sensing-based methodology for groundwater potentiality assessment in Timavos area Greece,
Journal of Hydrology, V. 525, pp. 197-208.
Rahimi, D.; Moosavi, H., 2013. Potentiality of ground water resources by using AHP model and GIS technique in Shahrood- Bastam watershed, Journal of Geography and Management, 17(44), pp. 139-159. (In Persian)
Seif, A.; Kargar, A., 2011. Ground water potential zoning using AHP and GIS in Sirjan Watershed, Journal of Natural
Gegraphy, 4(12), pp. 75-90. (In Persian)
Sternberg, T.; Paillou, Ph. 2015. Mapping potential shallow groundwater in the desert using remote sensing: Lake Ulaan Nurr, Journal of Enviroments,
Venkateswaran, S.; Ayyandurai, R., 2015. Groundwater Potential Zoning in Upper Gadilam River Basin Tamil Nadu,
AquaticProcedia, V. 4, pp.1275-1282.
Zhu, B.; Xu, Z. 2014. Analytic hierarchy process-hesitant group decision making, European Journal of Operational Research, 239(3), pp. 794-801.
Yamani, M.; Alizadeh, Sh. 2014. Ground water potential zoning using AHP in Abadeh-Fars, journal of Geomorphology, 1(1),pp.131-144.(In Persian)
Abdalla, F.2012. Mapping of groundwater prospective zones using remote sensing and GIS techniques: A case study from the Central Eastern Desert, Egypt, journal of African Earth
Sciences, 70(1-2), pp.8-17