Strengthening Indonesian Agribusiness Rural Development
Diana Chalil
1and Riantri Barus
2 1Universitas Sumatera Utara2Universitas Nusa Bangsa
e-mail:1)[email protected]
ABSTRACT
Since 2006 Indonesia is recorded as the highest palm oil producer in the world, in which more than 70% of the production is distributed to global markets, including the European markets that are likely concerned on environmental issues. Therefore, CPO producers require certification to be able to export to European countries. European consumers have relatively high purchasing power, for that reason increasing market sales to European markets would be beneficial for all parties in the system. It is predicted that improving palm oil smallholders’ participation in European markets could improve rural development. To analyze such conditions, data from 131 respondents in Sei Lilin Subdistrict, Banyuasin District, South Sumatra Province are collected and analyzed with independent compare means test and frontier estimation models. The results show that smallholders’ participation in global markets improves the agribusiness rural development. The improvement can be seen in all of the agribusiness subsystems; in the input subsystem the improvement can be seen in the amount and type of fertilizer and herbicide usage and job creation, while in the production subsystem it is seen in technical and cost efficiency. In the processing subsystem, positive changes are seen in the supply certainty, and the same can be felt in quantity and price sales in the marketing subsystem. Similarly, supporting subsystem support is also positively affected, which can be seen in the change of waste container handling and the improvement of facilities and infrastructure.
Keywords: palm oil, global market, certification, smallholders, rural development
INTRODUCTION
Oil is an important commodity for Indonesia. Since 2014, Indonesia is recorded as the world's largest CPO producer, with a share 44,46% of the total world production. Indonesia has a global export share of 78,07%, and is also recorded as the largest consumer with a share of 15,88% of total world consumption. With such a condition, Indonesia still needs global markets such as India, China and European countries. India and China uses CPO for producing their large cooking oil demand, and consumers in both countries are generally highly price sensitive.
In contrast to India and China, price is not the most influencing factor for European countries. Many of these countries have committed to only import Certified
income of farmers and agribusiness and also rural development. In particular, certification can (1) give farmers access to key markets, (2) inform consumers effectively about food quality, origin, environmental care and animal welfare, (3) increase efficiency of the farm operation, (4) have positive impacts on rural development (infrastructure, etc.), (5) reduce costs within the supply chain through vertical integration, (6) add value for producers, although this effect varies from scheme to scheme, (7) lead to price increases in all parts of the chain, but not in all cases enough to cover additional costs, (8) be most successful when adequate marketing management capabilities are present. However, certification could also lead to (1) heavy and duplicative administrative costs and burdens, (2) competition issues and potential barriers to the functioning of the single market, (3) difficulties for exporters from developing countries (especially small-scale producers in the Least Developed Countries), and (4) stakeholder concerns about transparency of schemes (Services of DG Agriculture and Rural Development, 2008).
With similar considerations in 1973 the Indonesian government started PIR Trans program, which is expected to improve farmers’ welfare and rural development. Since 1970s, the percentage of poor people in rural areas is always higher than those in urban areas (CBS, 2016). In general, rural economies that are still dominated by the agricultural sector are still lacking in infrastructures and market access. This includes export-oriented commodities from plantation sector. In fact, the plantation sector appears to be a significant foreign earned income. In 2010-2014, 19.008,70 thousand tons of palm oil are exports, contributing US$16,327.24 million to the Indonesian foreign earned income (BPS, 2015). Therefore, improving smallholders’ participation in global markets is expected to improve agribusiness rural development. To analyze the possibilities, this study was conducted in Sei Lilin Subdistrict, which is the center of oil
palm smallholder plantations and has obtained RSPO and ISCC certificates. A proportional number of non certified smallholders are included as a control group. The analyses are based on the concept of vertical integration and rural development, and use compare means test and frontier technical and price efficiency model. Based on the estimation results and discussion, this paper is closed with conclusions and a number of policy implications.
REVIEW
According to Hodge and Midmore (2008) rural development is defined as the economic growth of rural areas. Rural development is generally associated with agriculture, including plantation, as it is always located in rural areas. This could be analysis by sectoral, multi-sectoral, territorial or local approaches. Each has different indicators: sectoral approach emphasis on farm income, mainly on production costs or efficiency, while multisectoral emphasis more on impact to other sectors, particularly in employment and value added. A multisectoral approach often discusses possible improvements in agribusiness subsystems that encourage rural development. Territorial approach is often associated with the development of infrastructures, while the local approach focus more on social aspects, including the impact on health and education.
markets (Rasiah and Syahrin, 2006). Plantation development not only improves the production subsystem but also other related subsystems, from input, processing, marketing up to supporting subsystems. Plantation products are mostly not final products, thus need to be further processed. In addition, to be competitive, plantations need to be developed in large scales and require global markets to absorb all of the products. Therefore, the development of the plantation industry is strongly influenced by vertical integration between marketing and production subsystems (Chalil, 2008).
The linkages can guarantee supply, reduce transaction costs, improve the compliance with consumers’ need, and improve producers' marketing share (Buzzell, R.D., 1983). Markets offer opportunities for producers to tap into fast-growing international markets for high value agricultural products. In fact, participation in global markets could improve sales and prices up to farm levels (Valkila, J. and A. Nygren, 2008; Loveless, K.L, 2012). Participation can also improve vertical coordination with processors or exporters along the global supply chain (Csaky, E.S, 2014). Vertical coordination with farmers to meet the requirements of export markets, including certification requirements. Certification represents the requirements and specifications imposed by buyers. Sustainability certification, for example, is designed to guarantee the industry sustainability economically, socially and environmentally. For buyers, certifications reduce transaction costs of regulatory compliance and risk management. However, for smallholders, although in principle beneficial, certifications can represent a significant barrier to the global value chain participation, especially given the up-front cost. Generally, certification also requires the ability to comply with product traceability and quality in fulfilling the certification principles and criteria. In fact, many farmers’ financial and managerial capability is not sufficient to meet these requirements. As a
result, many smallholders have been excluded from the opportunities of the global markets (Csaky, 2014; Stanton and Burkink, 2008).
Sahu and Narayanan (2014) show that certification can improve efficiency. On average, the certified companies improve their technical efficiency from time to time. Valkila (2009) suggests that certification could improve farmers’ income but requires minimum economies of scale. Since many farmers still have small land areas, they need to collectively manage their business (Mannon, S.E., 2005). Farmers can make collective action if it has a good organization. Among various types of farmer organizations, cooperatives that are widely established in Asian rural areas are unlikely effective in facilitating collective management (Csaky, 2014). Farmers need help from government in establishing public infrastructures (World Bank, 2008).
METHODS
independent smallholders who live in the same village with plasma. Other respondent groups are also determined by purposive sampling. Secondary data was collected from KUD Mukti Jaya, FKMK/LFPR in each
region of KUD Mukti Jaya and PT Hindoli. Participation in the global market linkages with rural development were analyzed descriptively with the following process.
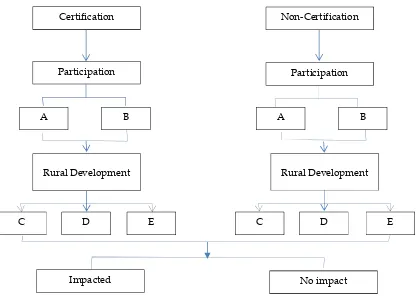
Figure 1. Research Frame
Plasma participation in the international market can not be quantitatively measured with export sales data due to limited data access. As a proxy, participation is indicated by the premium price reception. The assumption is that export sales can provide a premium price for sellers/producers. The hypothesis is that certifications improve smallholders' participation in the international market, which in turn improves the rural development. The difference in smallholders’ participation will follow with the difference in rural development. Rural development is measured by changes in (a) smallholders’ income, due to the change in production, sales quantity and price, and efficiency, (b) credit access (c) health service access, (d) education access, (e) employment, (f) facilities and infrastructure and (g)
environmental conditions. The difference in point (a) is analysed with independent compare means test, while the rest is descriptively analysed.
)
/
(
)
/
(
22 2 1 2 1
2 1
n
n
x
x
t
1
x and
2
x are the average price, productivity, and income for plasma and independent smallholders,
12 and2 2
arethe varians of price, productivity, and income for plasma and independent smallholders, and n1 and n2 are sample sizes for plasma
and independent smallholders.
Efficiency is differentiated with technical and cost efficiencies, and estimated with stochastic frontier models. Both are estimated with Maximum Likelihood Estimation
Certification Non-Certification
Participation Participation
A B A B
Rural Development Rural Development
C D E C D E
approach, using paramaters from the estimation of production function and cost functions as follows:
Y = f(urea, kcl, sp36, phonska, rp, roundup, age, harvesting labor)
where Y is productivity (kg/ha/semester), urea, kcl, sp36, phonska, rp are amount of each fertilizer used, that measure in kg/ha/semester, roundup is herbicide used that measure in kg/ha/semester, age is crop age and harvesting labor is amount of labor used in harvesting process.
C = f(Y, P_urea, P_kcl, P_sp_36, P_phonska, P_rp, P_harvesting labor, P_fertilizing labor, P_spraying labor) where C is cost per kg and P is price of each input
Technical and cost efficiencies are estimated with stochastic frontier models as follows:
=
( + )=
( + − ) ( + ) = (− )
= ( + )= ( + − ) ( + ) = (− )
where TE is Technical efficiency, CE is Cost efficiency, is output, is non-negative noise effect, is inefficiency effect. TE values
will be in between 0 and 1, while CE will be 1 and ∞. The closer TE or CE value to 1, the more efficient the production or cost will be.
RESULT
CERTIFICATION AND PARTICIPATION IN GLOBAL MARKETS
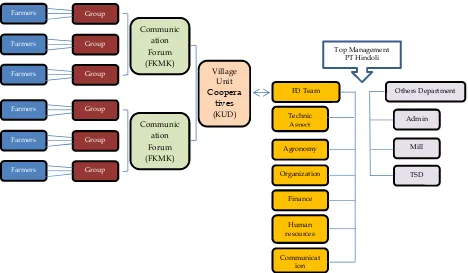
Figure 2. Organization Structure
Field assistants need to monitor that smallholders always apply best management practice. The use of fertilizers and pesticides must ensure sustainable productivity and does not damage the environment quality. Under the agreement with PT Hindoli, plasma should maintain the FFB quality and sell them to PT, and PT is obliged to buy the entire FFB yield at Disbun price. Disbun price is grouped by age of the plant, FFB from old crops receives low price because it generally produces low CPO rendemen. However, if the FFB harvest is from the same age, Disbun price is always higher than market price. In fact, currently 97% plasma crops are already over 20 years of age, while those of independent smallholders make up only 2,5%. Therefore currently Disbun price is lower than market prices, which are IDR 1.466 and IDR 1.474,38 per kg, respectively. However, the difference is relatively small and not significant, thus with 0,35 t-stat independent compare means test cannot reject null hypothesis (no mean difference).
With the agreement, plasma farmers receive relatively small sales fluctuation both in quantity and price than those of the non
plasma group. After being certified in 2010, since 2011 plasma also receive premium prices every four months. From RSPO, smallholders receive 60%, while from ISCC they receive 50%. In contrast, independent smallholders never receive premium price. Therefore it can be said that certification improves plasma access to global markets.
At KUD Mukti Jaya additional revenue from premium price is allocated for developing infrastructures that relate to certification, such as warehouse and scales. Since obtaining RSPO certification in 2010 and ISCC in 2012, KUD Mukti Jaya have earned IDR7 billion from premium price. The premium varies from US$6/MT to US$40/MT, which depends on the length of marketing chain. The shorter the chain is, the higher the premium price will be. In Hindoli, the largest premium price is obtained if the purchase is done directly by the trading unit of Cargill in Singapore. Hindoli is a subsidiary of Cargill engaged in the oil industry. Trading unit of Cargill is one of the 4 largest traders in the world agribusiness. Carrying 25% of the total palm oil trading is handled by Cargill, which is known to be
Farmers Group
Farmers Group
Farmers Group
Communic ation Forum (FKMK)
Farmers Group
Farmers Group
Farmers Group
Village Unit
Coopera tives
(KUD)
FD Team
Top Management PT Hindoli
Others Department
Admin
Mill
TSD Technic
Aspect
Agronomy
Organization
Finance
Human resources
Communicat ion
very efficient for highly vertically integrated (Cargill, 2011). Some large companies CPO users of Hindoli include Unilever, General, Mills, Kraft, Mars, and Nestle (Cargill, 2011). RSPO certification can be differentiated in 3 types of certification, namely segregated, mass balance and book and claim. Among them segregation appears to give the highest premium price. Segregated and mass balance trade physical certified palm oil, while book and claim do not. In 2008-2014, on average only 16,98% of the total CSPO production is physically absorbed, with only US $1,97/MT average premium price in 2014 (GreenPalm, 2015). Hindoli produce 100% certified palm oil, thus can get segregation premium price.
INPUT SUBSYSTEM
Significant changes can be seen in the provision and usage of fertilizers, pesticides and labor. Plasma smallholders have savings for purchasing fertilizers, herbicides, and labors’ wages. Savings are made through deductions from FFB sales, which are IDR500.000-IDR750.000 and
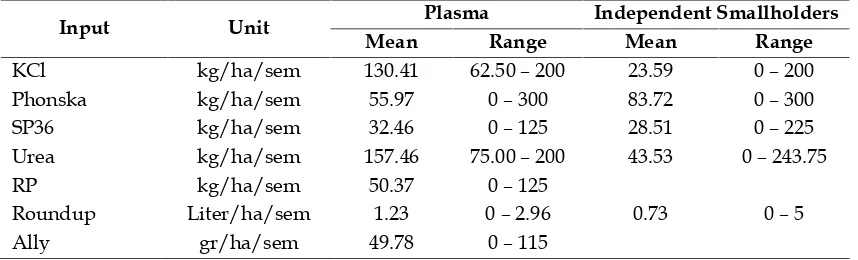
IDR50.000-IDR100.000 per month per 2 ha for fertilizers and herbicides, respectively. The amount is determined in each region based on yearly leaves test in each region. The type of fertilizer is determined by the availability. Single fertilizer such as Urea, SP36, RP and KCl wil give better composition than a compound one, such as Phonska. However, single subsidized fertilizer such as Urea and SP36 are not always available in sufficient amounts. If single fertilizers are not available, then compound fertilizer, such as Phonska is used with equivalent amount. In contrast, independent smallholders’ fertilizer and herbicides usage depends more on their funds availability. On average, plasma is applied 2 times for each single fertilizer in each year, while independent smallholders only apply once. Table 1 shows that in general independent smallholders use less amount of fertilizer and herbicides than those of plasma smallholders.
Table 1. Feritizer and Herbicides Aplication
Input Unit Plasma Independent Smallholders
Mean Range Mean Range
KCl kg/ha/sem 130.41 62.50 – 200 23.59 0 – 200 Phonska kg/ha/sem 55.97 0 – 300 83.72 0 – 300
SP36 kg/ha/sem 32.46 0 – 125 28.51 0 – 225
Urea kg/ha/sem 157.46 75.00 – 200 43.53 0 – 243.75
RP kg/ha/sem 50.37 0 – 125
Roundup Liter/ha/sem 1.23 0 – 2.96 0.73 0 – 5
Ally gr/ha/sem 49.78 0 – 115
Prior to certification, most smallholders use total herbicides spray system, which destroy all gulma. After certification, all plasma plantations are sprayed with selective system, without any paraquat and aplied by spraying team that has been trained PT. The aim is to ascertain the type, amount and timing of the fertilizers and herbicides application. The team could be smallholders, their family or paid labors. The total number of fertilizer and spraying team in 6 regions
with 3680 ha is more than 60 persons, with an average of 20 working day/person/month.
PRODUCTION SUBSYSTEM
Efficiency Level
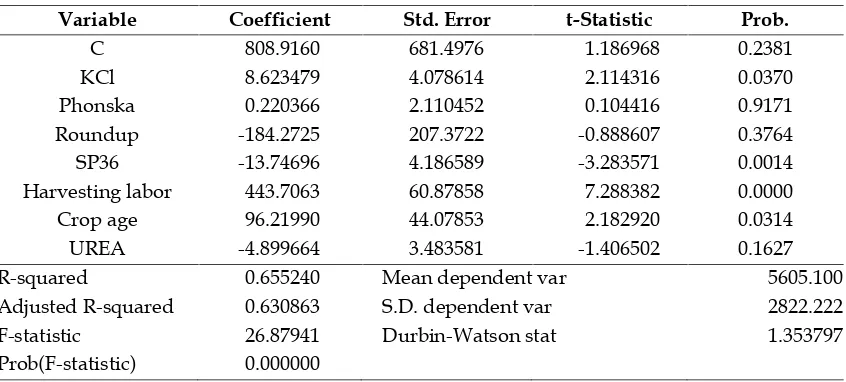
Table 2. Production Function
Variable Coefficient Std. Error t-Statistic Prob.
C 808.9160 681.4976 1.186968 0.2381
KCl 8.623479 4.078614 2.114316 0.0370
Phonska 0.220366 2.110452 0.104416 0.9171 Roundup -184.2725 207.3722 -0.888607 0.3764 SP36 -13.74696 4.186589 -3.283571 0.0014 Harvesting labor 443.7063 60.87858 7.288382 0.0000 Crop age 96.21990 44.07853 2.182920 0.0314 UREA -4.899664 3.483581 -1.406502 0.1627
R-squared 0.655240 Mean dependent var 5605.100
Adjusted R-squared 0.630863 S.D. dependent var 2822.222 F-statistic 26.87941 Durbin-Watson stat 1.353797 Prob(F-statistic) 0.000000
Productivity as the dependent variable is measured in kg/ha/sem. Initially type of seed (certified or not), variable groups (plasma or self) and RP fertilizer are included in the equation. However, almost all plasma smallholders use certified seed, while almost all independent ones use non-certified seeds. Including this variable raises multicolinearity problems, thus is removed from the equation. RP is not included because none of the independent smallholders use it. Therefore, the final equation only includes 7 independent variables namely KCl, Phonska, Roundup, SP36, harvest labor, crop age, and Urea. Multicolinearity test shows that the maximum correlation value is 0.691, equivalent to 1.914 VIF, thus can be concluded that there are no serious
multicolinearity problems. Heteroscedasticity test shows that in α1%, the model is
homoscedastic, but in α5% only one variable
namely urea that cause heteroscedasticity. The Ramsey Linearity Test shows that linear specification can not be rejected. The partial t test shows that Phonska, Roundup and Urea do not significantly influence the productivity. Most smallholders use Phonska when single fertilizers are not enough, and Urea is mainly needed for vegetative growth. For old crops, Urea is needed for growing the crop bunches. In this study all plasma smallholders’ crops are more than 20 years of age. Moreover, the track period is quite severe. Therefore, the estimation result shows that Urea does not significantly influence crops’ productivity.
Table 3. Plasma and Independent Crop Age
Crop age Plasma Independent Smallholders
unit % Unit %
3 – 6 0 - 3.00 7.50
6 – 20 2 2.99 36.00 90.00
> 20 65 97.01 1.00 2.50
Total 67 100 40.00 100.00
Table 2 shows that SP36 significantly influence the productivity, but the sign is negative. This might be partly explained by the wide range of SP36 usage, from 0 to 225 kg/ha/sem. Even among plasma the difference among 6 regions could reach up to 125 kg/ha/sem. However, plasma
determined it from the leaves test that is done once a year. Therefore, the independent smallholders’ usage that is above 125 kg/ha/sem might be excessive use, leading to a reduce in the oil palm crop productivity.
with MLE. Samples are not grouped by crop age because the variation is insufficient. The result shows that on average smallholders reach 0,92 of technical efficiency. If the efficiency range 0-1 is distinguished in 5 groups namely very low, low, medium and high, very high, it can be concluded that samples technical efficiency has reach high category. From all smallholder samples only 1 has high efficiency, the remaining has achieved very high efficiency. Although 97% of plasma crop age is more than 20 years, while those of the independent smallholders’ make up only 2.5%, the average productivity of plasma is higher than the independent smallholders’, which are 6.775,97 kg/ha/sem and 3.277,14 kg/ha/sem, respectively. Moreover, with various plant managements the range of independent smallholders’ productivity is also wider than those of the plasma, which are 120 to 9.000 kg/ha/sem and 1.200 to 12.537,99 kg/ha/sem, respectively. The compare means test gives -8,54 of t-stat, showing the significant difference between these plasma and independent smallholders’ productivities.
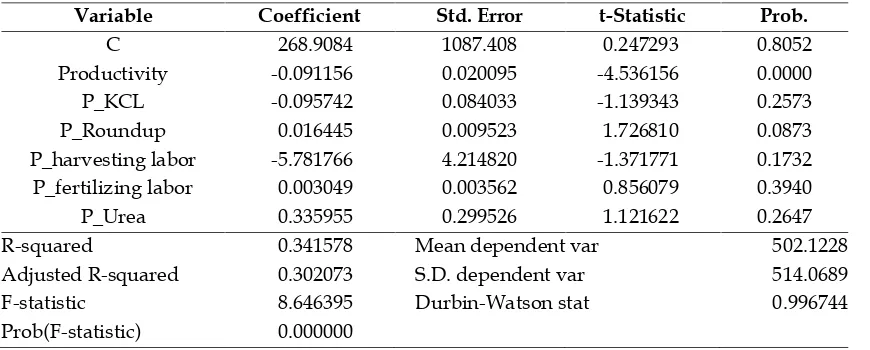
To estimate the cost function, dependent variable is measured in cost per kg FFB to accommodate the different land productivity.
Initially, unit price of all input used in the production are incuded as independent variables. However, some appear to be highly correlated, thus were eliminated to address multicollinearity problem. The final equation includes 6 independent variables namely productivity, KCl price, Roundup price, SP36 price, harvest labor wage, fertilizer application labor wage and urea price. In this final equation, the multicollinearity test shows the maximum correlation value of all independent variables is 0,654 or equivalent to 1,747 in VIF value, thus no serious multicolinearity problem is concluded. Heteroscedasticity test shows that in α1%, only one variable namely p_kcl that
cause heteroscedasticity. The Ramsey Linearity Test shows that linear specification can not be rejected. Among the 6 independent variables, only productivity and Roundup price significantly influence the average cost. Productivity sign is negative as expected, showing that the higher the productivity is, the lower the FFB cost per kg will be. Roundup price is positive as also expected, showing that the lower the price per liter Roundup, the less the cost per kg FFB will be.
Table 4. Estimation of Cost Function
Variable Coefficient Std. Error t-Statistic Prob.
C 268.9084 1087.408 0.247293 0.8052
Productivity -0.091156 0.020095 -4.536156 0.0000 P_KCL -0.095742 0.084033 -1.139343 0.2573 P_Roundup 0.016445 0.009523 1.726810 0.0873 P_harvesting labor -5.781766 4.214820 -1.371771 0.1732 P_fertilizing labor 0.003049 0.003562 0.856079 0.3940
P_Urea 0.335955 0.299526 1.121622 0.2647
R-squared 0.341578 Mean dependent var 502.1228
Adjusted R-squared 0.302073 S.D. dependent var 514.0689 F-statistic 8.646395 Durbin-Watson stat 0.996744 Prob(F-statistic) 0.000000
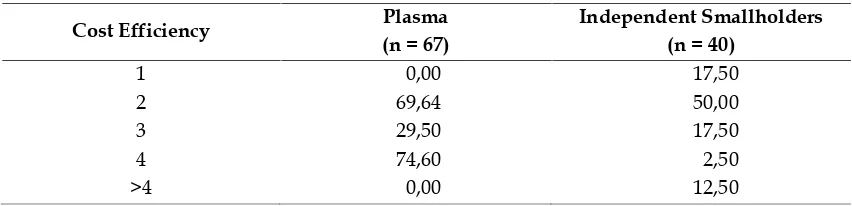
Parameters of the cost function are then used to estimate the cost efficiency. The estimation result shows that on average
Table 5. Cost Efficiency (%)
Cost Efficiency Plasma
(n = 67)
Independent Smallholders (n = 40)
1 0,00 17,50
2 69,64 50,00
3 29,50 17,50
4 74,60 2,50
>4 0,00 12,50
In general, independent smallholders reduce costs by using family labors, which on everage is 28,20% of the total labor usage. Plasma smallholders reduce average cost from the higher productivity and from lower input price. Fertilizers and herbicides are collectively bought, thus could be purchased with lower price. As a result, the independent smallholders’ average cost per kg FFB is higher than the plasma, which is IDR 676,01/kg and IDR 398,26/kg, respectively. The compare means test result gives 2,79 of t-stat, showing the average cost of these plasma and independent smallholders are significantly different. Therefore, it can be concluded that certification could significantly improve both the technical and cost efficiency.
PROCESSING SUBSYSTEM
PT Cargill is a company with various business branches that operate in 70 countries. PT Hindoli is one of them that was developed in 1996 in South Sumatra Province. In Sei Lilin Subdistrict, PT Hindoli has a mill with a capacity of 120 ton FFB/hour, with 40% supply from nucleus (company) plantation, and the rest from smallholders, both plasma and non plasma. Plasma harvest is scheduled by PT Hindoli to meet the mill capacity and ensure the purchase for all plasma FFB. Each plasma plantation, except that in Bukit Jaya Village (C3 region), is harvested 2 times a month. That in Bukit Jaya Village (C3 region) is harvested once a week. With such an arrangement Hindoli received assurance of mill supply, and smallholders gain assurance
in FFB sales, not only in normal times but also during the harvest.
MARKETING SUBSYSTEM
Market Access
Smallholders’ participation in the global market can increase their income through market expansion and price increase. Certified palm oil can be sold to European countries and America. Hindoli, which is a subsidiary company of Cargill, produces biofuel and ethanol and marketed to European countries, Latin America and North America. Cargill is also recorded as the largest biofuel supplier to European market. Hindoli sells CPO to buyers based on single transactions with grace shipping and payment for 2 weeks until 1 month. With such a mechanism, demand from importers is fluctuctuative from time to time. Therefore, CPO exporters need to provide various certified CPO to take advantage of such opportunity. Revenues also increase with a decrease in production costs by group management and the application of best practice. The plasma and independent smallholders’ income are IDR 7.584.865 and IDR 3.599.232 per ha per semester, respectively. The compare means test result gives -6.72 of t-statistics, showing that plasma and independent smallholders’ income are significantly different.
SUPPORTING SUBSYSTEM
Environment Improvement
team before being reused as loosefruit (brondolan) container. In contrast, almost all independent smallholders simply reuse fertilizer sacks, even those that also have plasma plantations. In other words, independent smallholders do not apply similar treatment due to lack of knowledge but more on the unwillingness to do extra work. One washed it in the river, which could pollute the water. The used water is flowed into a processor that can change the waste into neutral water again. Each year plasma smallholders have 6 single fertilizer applications, N, P and K. On average, each semester plasma smallholders use 26.700 sacks of fertilizers, thus properly washing and neutralizing the waste water is likely to make a significant difference. Similarly, with certification plasma smallholders no longer wash their herbicide containers in the river, just through them at their plantations, or even burned them together with other wastes. Instead the used container are cut into 3 parts and send back to PT Hindoli, which then returned to PT Nirmala that has license to handle wastes. Among independent smallholders, only 1 that is also recorded as plasma smallholder follows the same treatment.
Infrastructures
Benefits from certification are not only enjoyed by plasma smallholders. After being certified, smallholders used their premium fund to complete their infrastructures such as office buildings, warehouses for fertilizer, bathrooms for fertilizing and spraying, waste ponds, or personal protective equipment. The bathroom is useful for fertilizing and spraying teams, so that they can immediately clean up. Personal protective equipment is useful to maintain their health and work safety. In addition, smallholders contribute to the development of public infrastructure through the deduction of their monthly FFB sales income, at IDR 3/kg. With a total production of 3.926.359,94 kg, this means the average smallholders’ contribution will be
IDR 11.799.079/month. The funding allocation is decided by village officials, which are usually used for the procurement of the village office equipment, the celebration of Independence Day, or the maintenance of schools and mosques.
CONCLUSION AND POLICY
IMPLICATION
CONCLUSION
Certification is a requirement for the agricultural commodities export to some countries. With the certification, smallholders’ FFB could expand their market access to these countries. If the increase to the global market leads to an improvement in the continuity of sales or increasing the sales price then it can improve the agribusiness rural development. It can be seen from the improvement of the entire subsystem agribusiness and integration between subsystems, from input, production, processing, marketing, and supporting subsystems. The impact can be seen from the increase in smallholders’ income, employment growth, or the infrastructure improvement. Therefore, it can be concluded that certification can be used to increase farmer participation in the global market and in turn improve the agribusiness rural development. The key is that the certificate needs to be accepted by the consumers, who need to have the willingness to pay with higher prices.
POLICY IMPLICATIONS
Vertical integration between oil palm smallholders and companies, which have direct relation to traders and buyers need to be established. Generally smallholders, especially independent smallholders, need facilitators to foster the relationship. Associated with it, the Estate Agency that was formally involved in the development of oil palm smallholders can be utilized as facilitators in the development of such a vertical integration. The development is not only limited to technical aspects but also managerial and group dynamics, and needs to be gradually and continuously established. As such, it is expected that certification benefits such as the increase in demand and price will be transmitted from palm oil buyers to smalholders.
In order to establish vertical integration between oil palm agribusiness subsystems, each subsystem needs to be internally coordinated as one entity. For small scale oil palm plantation, such as those of smallholders, the coordination can be built in a good smallholders group. Various stakeholders can intervene in the process, but smallholders must remain involved in planning, organizing, actuating and controlling of various activities until they become independent groups and can be integrated in a mutually beneficial relationship with other both parties.
REFERENCES
BPS. 2016. Jumlah Penduduk Miskin, Persentase Penduduk Miskin dan Garis Kemiskinan, 1970-2013 download 11 Maret 2016 http://www.bps.go.id/linkTabelStatis /view/id/1494
Buzzell, R.D. 1983. Is Vertical Integration Profitable? Harvard Business Review. January 1983 Issue https://hbr.org/1983/01/is-vertical-integration-profitable
Cargill. 2011. Putting Profits Before People & Planet. Download from http://d3n8a8pro7vhmx.cloudfront.ne t/rainforestactionnetwork/legacy_url
/384/ran_cargill_factsheet.pdf?140269 8105
Chalil D. 2008. An Empirical Analysis of Asymmetric Duopoly in the Indonesian Crude Palm Oil Industry. [Dissertation]. New South Wales: Agricultural and Resource Economics Faculty of Agriculture, Food and Natural Resources, The University of Sydney.
Chalil, D. 2013. Assessment of Smallholders’ Barriers to Adopt Sustainable Practices: Case Study on Oil Palm (Elaeis Guineensis) Smallholders’ Certification in North Sumatra, Indonesia. Chapter in Cases on the Diffusion and Adoption of Sustainable Development Practices. Editors Muga, H.E. and Thomas, K.D. IGI Global, USA
Csaky, E.S. 2014. Smallholders Global Value Chain Participation: The Role of Aggregation. PhD Dissertation. Public Policy Studies. Graduate School Duke University
De Figuiredo, E. 2013. The Possibilities for Inclusion of Smallholder Farmers in Organic Market Chain Development.
Download from
http://ainfo.cuptia.embrapa.br/digital /bitstream/item/96683/.../chap-7-2013.pdf 25 March 2016
Development of Palm Oil and Related Products in Malaysia and Indonesia Rajah Rasiah and Azmi Shahrin. 2006. (University of Malaya). Download from
http://citeseerx.ist.psu.edu/viewdoc/ download?doi=10.1.1.498.8450&rep=re p1&type=pdf. 25 March 2016
ECLAC-FAO-IICA. 2011. The Outlook for Agriculture and Rural Development in Americas: A Perspective on Latin America and the Carribean 2011-2012. IICA San Jose. Download from http://www.iica.int 25 March 2016 Ian Hodge et., Peter Midmore. 2008. Models
of Rural Development and Approaches to Analysis Evaluation And Decision-Making,Économie rurale, 307, 23-38. Jaffee et al. 2011. Making the Grade:
Kerri L. Loveless. 2012. The Impact of the Fair Trade Market on Coffee Farmers in Costa Rica. Undergraduate Journal of Global Citizenship. Volume 1 | Issue 2 Article 2.
Lameilleur, S. 2013. Smallholder Compliance with Private Standard Certification: The Case of Global GAP Adoption by Mango Production in Peru. International Food and Agribusiness Management Review, volume 16 Issue 4, pp 159-180.
Mannon, S.E. 2005. Risk Taker, Risk Makers: Small Farmers and Non-Traditional Agro Exports in Kenya and Costa Rica. Human Organization. Spring 64, 1 Sahu, Santosh Kumar and K.Narayanan.
2014. Environmental Certification and Technical Efficiency: A Study of Manufacturing Firms in India. MPRA Paper No.59620. Download from
https://mpra.ub.uni-muenchen.de/59620/ 25 March 2016 Services of DG Agriculture and Rural
Development (2008). Food Quality Certification Schemes (FQCS). Working Document. Download from http://ec.europa.eu/agriculture/quali ty/policy/workingdocs/fqcs_en.pdf. 23 March 2016
SOAS. 2015. What is Rural Development. SOAS, University of London.
Download from
www.soas.ac.uk/cedep-
demos/000_P530_RD_K3736-Demo/module/pdfs/p530_unit_01.pd f. 25 March 2016
Stanton, J.V. and T.J.Burkink. 2008.. Improving Small Farmer Participation in Export Marketing Channels: Perceptions of US Fresh Produce Importers. An International Journal 13, 3: 199-210.
Valkila. 2009. Fair Trade, Coffee Certification: A tool for rural development and environmental protection in Nicaragua? Discussion Paper No.38. University of Helsinki, Department of Economics and Management.
World Bank. 2008. Agriculture for Development. World Development Report 2008. The World Bank.
Download from
http://siteresources.worldbank.org/I NTWDR2008/Resources/WDR_00_bo ok.pdf 23 March 2016