Advanced Automotive
Fault Diagnosis
Second edition
Tom Denton
BA, MSAE, MIRTE, Cert. Ed.
Associate Lecturer, Open University, UK
AMSTERDAM • BOSTON • HEIDELBERG • LONDON • OXFORD • NEW YORK PARIS • SAN DIEGO • SAN FRANCISCO • SINGAPORE • SYDNEY • TOKYO
30 Corporate Drive, Suite 400, Burlington MA 01803, USA First published 2000
Reprinted 2002, 2003, 2004 Second edition 2006
Copyright © 2006, Tom Denton. Published by Elsevier Ltd. All rights reserved.
The right of Tom Denton to be identified as the author of this work has been asserted in accordance with the Copyright, Designs and Patents Act 1988
No part of this publication may be reproduced, stored in a retrieval system or transmitted in any form or by any means electronic, mechanical, photocopying, recording or otherwise without the prior written permission of the publisher
Permission may be sought directly from Elsevier’s Science & Technology Rights Department in Oxford, UK: phone (⫹44) (0) 1865 843830; fax (⫹44) (0) 1865 853333; email: [email protected]. Alternatively you can submit your request online by visiting the Elsevier web site at http://elsevier. com/locate/permissions, and selecting Obtaining permission to use Elsevier material
Notice
No responsibility is assumed by the publisher for any injury and/or damage to persons or property as a matter of products liability, negligence or otherwise, or from any use or operation of any methods, products, instructions or ideas contained in the material herein. Because of rapid advances in the medical sciences, in particular, independent verification of diagnoses and drug dosages should be made British Library Cataloguing in Publication Data
A catalogue record for this book is available from the British Library Library of Congress Cataloging-in-Publication Data
A catalog record for this book is available from the Library of Congress ISBN-13: 978-0-75-066991-7
ISBN-10: 0-75-066991-8
Typeset by Charon Tec Ltd, Chennai, India www.charontec.com
Printed and bound in the United Kingdom 06 07 08 09 10 9 8 7 6 5 4 3 2 1
Contents
Preface ix
Introduction to the second edition xi
Acknowledgments xiii
Glossary xv
1 Introduction 1
1.1 ‘If it ain’t broke, don’t fix it!’ 1
1.2 Safe working practices 1
1.3 Terminology 2
1.4 Report writing 3
2 Diagnostic techniques 6
2.1 Introduction 6
2.2 Diagnostic process 6
2.3 Diagnostics on paper 8
2.4 Mechanical diagnostic techniques 9
2.5 Electrical diagnostic techniques 12
2.6 Fault codes 17
2.7 Systems 18
2.8 On- and off-board diagnostics 20
2.9 Data sources 21
3 Tools and equipment 25
3.1 Basic equipment 25
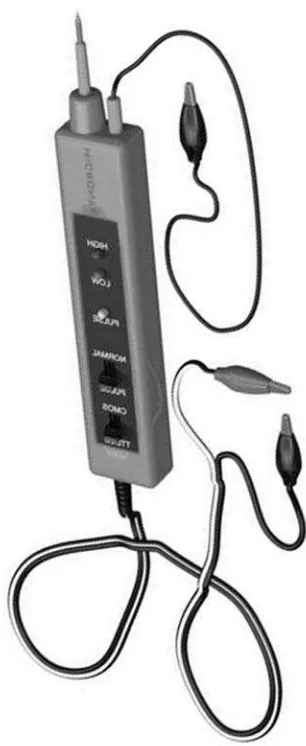
3.2 Oscilloscopes 28
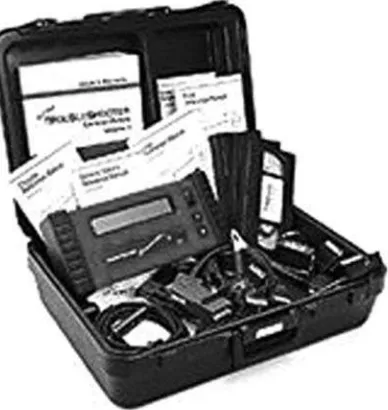
3.3 Scanners/fault code readers 30
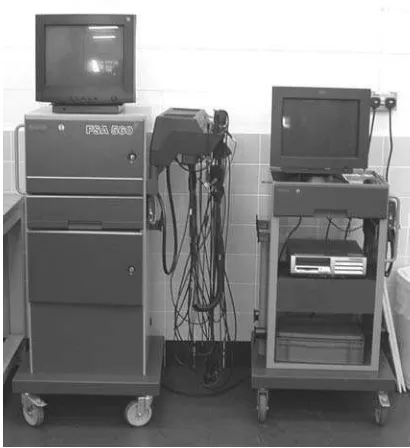
3.4 Engine analysers 32
4 Oscilloscope diagnostics 40
4.1 Introduction 40
4.2 Sensors 40
4.3 Actuators 49
4.4 Ignition system 54
4.5 Other components 58
4.6 Summary 60
5 On-board diagnostics 61
5.1 On-board diagnostics – a first perspective 61
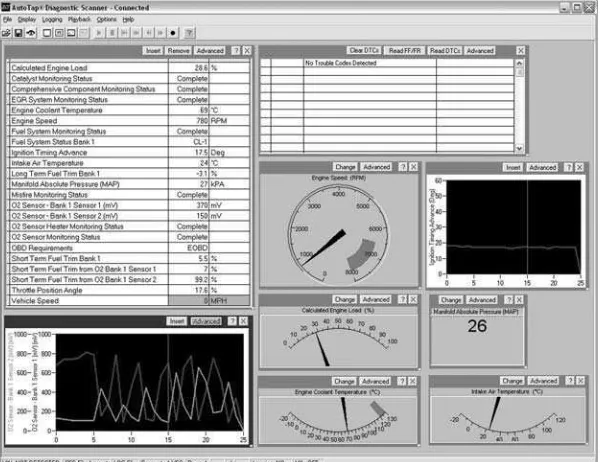
5.2 What is on-board diagnostics? 63
5.3 Petrol/gasoline on-board diagnostic monitors 66 5.4 On-board diagnostics – a second perspective 74
5.5 Summary 84
6 Sensors and actuators 86
6.1 Introduction 86
6.2 Sensors 86
7 Engine systems 98
7.1 Introduction 98
7.2 Engine operation 98
7.3 Diagnostics – engines 101
7.4 Fuel system 103
7.5 Diagnostics – fuel system 106
7.6 Introduction to engine management 108
7.7 Ignition 108
7.8 Diagnostic – ignition systems 116
7.9 Emissions 120
7.10 Diagnostics – emissions 122
7.11 Fuel injection 122
7.12 Diagnostics – fuel injection systems 126
7.13 Diesel injection 127
7.14 Diagnostics – diesel injection systems 130
7.15 Engine management 132
7.16 Diagnostics – combined injection and fuel control systems 138 7.17 Engine management and faultfinding information 143
7.18 Air supply and exhaust systems 144
7.19 Diagnostics – exhaust and air supply 147
7.20 Cooling 148
7.21 Diagnostics – cooling 150
7.22 Lubrication 151
7.23 Diagnostics – lubrication 153
7.24 Batteries 155
7.25 Diagnosing battery faults 156
7.26 Starting 159
7.27 Diagnosing starting system faults 163
7.28 Charging 163
7.29 Diagnosing charging system faults 167
8 Chassis systems 169
8.1 Brakes 169
8.2 Diagnostics – brakes 172
8.3 Anti-lock brakes 174
8.4 Diagnostics – anti-lock brakes 177
8.5 Traction control 178
8.6 Diagnostics – traction control 180
8.7 Steering and tyres 181
8.8 Diagnostics – steering and tyres 186
8.9 Suspension 190
8.10 Diagnostics – suspension 195
9 Electrical systems 197
9.1 Electronic components and circuits 197
9.2 Multiplexing 200
9.3 Lighting 203
9.4 Diagnosing lighting system faults 207
9.5 Auxiliaries 209
9.6 Diagnosing auxiliary system faults 214
9.7 In car entertainment (ICE) security and communications 216 9.8 Diagnosing ICE, security and communication system faults 219
9.9 Body electrical systems 221
9.10 Diagnosing body electrical system faults 225
9.11 Instrumentation 226
9.13 Heating, ventilation and air conditioning (HVAC) 231
9.14 Diagnostics – HVAC 237
9.15 Cruise control 239
9.16 Diagnostics – cruise control 240
9.17 Air bags and belt tensioners 241
9.18 Diagnostics – air bags and belt tensioners 244
10 Transmission systems 247
10.1 Manual transmission 247
10.2 Diagnostics – manual transmission 251
10.3 Automatic transmission 253
10.4 Diagnostics – automatic transmission 256
11 Conclusion, web resources and developments 260
11.1 Introduction 260
11.2 Web contacts 260
11.3 Future developments in diagnostic systems 262
11.4 Software 263
11.5 Summary 265
Preface
The aspect I still enjoy most about working on vehicles is being able to diagnose a fault that has beaten others! This skill takes a few years to develop but it is worth the effort. Diagnostic work is much like that of a detective solving a difficult crime, all the clues are usually there – if you know where to look. I think it was Sherlock Holmes (a fictional detective if you have never heard of him!) who said:
When you have eliminated all which is impossible, then whatever remains, however improbable, must be the truth.
This is a great thought for a diagnostic technician to keep in mind.
To help you learn ‘where to look’ for the clues and to eliminate the impossible, this book com-bines some aspects of automotive technology cov-ered in my other books. However, it goes much further with a new approach to the art of diag-nostics as a science.
The skills needed to be a good diagnostic technician are many and varied. For one job you
may need to listen to a rumbling noise as the car corners, for another you may need to interpret an oscilloscope waveform or a diagnostic trouble code.
Vehicles continue to become more complicated, particularly in the area of electronics. The need for technicians with good diagnostic skills there-fore remains. This could be you and you should be paid well!
Look on the bright side of having complicated technology on vehicles – fewer ‘home mechanics’ and more work for you and me!
Tom Denton 2006
Introduction to the second edition
The book has grown! But then it was always going to, because the complexity of automotive systems has grown and the associated diagnostic skills must follow.
The main change for this edition is that I have included two completely new chapters. The first is all about on-board diagnostics (OBD) and the second covers oscilloscope diagnostics in some detail. Both of these subjects are very relevant to all aspects of the automotive repair trade, light or heavy vehicle.
I have tried wherever possible to make the con-tent relevant to all types of vehicle whether used in the UK, USA or anywhere else in the world. After all, most vehicles have an engine that makes the wheels go round – even if the steering wheel changes sides…
There has been a significant rationalisation of motor vehicle qualifications in the UK since the first edition. The result is that this book has become even more appropriate because of the higher technical content. The order of the material has been changed a bit so that it lines up more with current qualifications. For example, engine
management and all engine electrics (batteries, etc.) are now part of the Engines chapter.
The book is ideal for all MV qualifications, in particular:
● City & Guilds 4101 Technical Certificates and NVQs
● IMI Technical Certificates and NVQs ● Level 4 diagnostic units
● BTEC/Edexcel National and Higher National qualifications
● International MV qualifications such as C&G 3905
● ASE certification in the US
● Supplementary reading for MV degree level course.
Of course, you may already be qualified and just need a few pointers!
You may also simply want to learn more about how your car works – and how to fix it when it doesn’t!
Acknowledgments
I am very grateful to the following companies who have supplied information and/or permis-sion to reproduce photographs and/or diagrams:
AA Photo Library Autodata
Autologic Data Systems BMW UK
Bosch Press Photos Eberspaecher GmbH Ford Motor Company GenRad
Hella UK
Institute of Road Transport Engineers Jaguar Cars
Kavlico Corp Lucas Service LucasVarity Mazda Cars UK NGK Spark Plugs UK Pioneer Radio Renault UK Ricardo
Robert Bosch GmbH Robert Bosch UK Rover
Saab UK Scandmec UK Snap-on Tools Sun Electric UK Sykes-Pickavant Valeo UK ZF Servomatic
Many if not all the companies here have good web pages. You will find a link to them from my site. Thanks again to the listed companies. If I have used any information or mentioned a com-pany name that is not noted here, please accept my apologies and acknowledgments.
An extra thanks to Dave Rogers (AVL) and Alan Malby (Ford Motor Company) for their kind assistance with the OBD chapter.
Glossary
Authors Note: To keep the glossary to a reason-able size, I decided to limit the entries to useful acronyms that are specified by the society of automo-tive engineers (SAE) and on-board diagnostic version two (OBD2) recommendations. I have provided free access to online glossaries (UK, US and Spanish) that include several thousand words.
www.automotive-technology.co.uk
Two key words never to forget:
Symptom(s): What the user/operator/repairer of the system (vehicle or what-ever) notices
Fault: An error in the system that
causes symptom(s)
OBD2/SAE acronyms
ABS: antilock brake system A/C: air conditioning AC: air cleaner
AIR: secondary air injection A/T: automatic transmission or
transaxle AP: accelerator pedal B⫹: battery positive voltage
BARO: barometric pressure CAC: charge air cooler
CFI: continuous fuel injection CL: closed loop
CKP: crankshaft position sensor CKP REF: crankshaft reference CMP: camshaft position sensor CMP REF: camshaft reference CO: carbon monoxide CO2: carbon dioxide
CPP: clutch pedal position CTOX: continuous trap oxidizer CTP: closed throttle position DEPS: digital engine position sensor DFCO: deceleration fuel cut-off mode DFI: direct fuel injection
DLC: data link connector DTC: diagnostic trouble code DTM: diagnostic test mode EBCM: electronic brake control
module
EBTCM: electronic brake traction control module
EC: engine control ECL: engine coolant level ECM: engine control module ECT: engine coolant temperature EEPROM: electrically erasable
program-mable read only memory EFE: early fuel evaporation EGR: exhaust gas recirculation EGRT: EGR temperature EI: electronic ignition EM: engine modification
EPROM: erasable programmable read only memory
EVAP: evaporative emission system FC: fan control
FEEPROM: flash electrically erasable pro-grammable read only memory FF: flexible fuel
FP: fuel pump
FPROM: flash erasable programmable read only memory
FT: fuel trim
FTP: federal test procedure GCM: governor control module GEN: generator
GND: ground H2O: water
HC: hydrocarbon
HO2S: heated oxygen sensor
HO2S1: upstream heated oxygen sensor
HO2S2: up or downstream heated
oxygen sensor
HO2S3: downstream heated oxygen
sensor
HVS: high voltage switch
HVAC: heating ventilation and air con-ditioning system
KOEC: key on, engine cranking KOEO: key on, engine off KOER: key on, engine running KS: knock sensor
KSM: knock sensor module LT: long term fuel trim MAF: mass airflow sensor MAP: manifold absolute pressure
sensor
MC: mixture control
MDP: manifold differential pressure MFI: multi-port fuel injection MIL: malfunction indicator lamp MPH: miles per hour
MST: manifold surface temperature MVZ: manifold vacuum zone NOX: oxides of nitrogen
NVRAM: non-volatile random access memory
O2S: oxygen sensor OBD: on-board diagnostics
OBD I: on-board diagnostics generation one
OBD II: on-board diagnostics, second generation
OC: oxidation catalyst ODM: output device monitor OL: open loop
OSC: oxygen sensor storage PAIR: pulsed secondary air injection PCM: powertrain control module PCV: positive crankcase ventilation PNP: park/neutral switch
PROM: program read only memory PSA: pressure switch assembly
PSP: power steering pressure PTOX: periodic trap oxidizer RAM: random access memory RM: relay module
ROM: read only memory RPM: revolutions per minute SC: supercharger
SCB: supercharger bypass SDM: sensing diagnostic mode SFI: sequential fuel injection SRI: service reminder indicator SRT: system readiness test ST: short term fuel trim TB: throttle body
TBI: throttle body injection TC: turbocharger
TCC: torque converter clutch TCM: transmission or transaxle
con-trol module
TFP: throttle fluid pressure TP: throttle position TPS: throttle position sensor TVV: thermal vacuum valve TWC: three way catalyst
TWC⫹OC: three way⫹oxidation catalytic
converter VAF: volume airflow VCM: vehicle control module VR: voltage regulator VS: vehicle sensor VSS: vehicle speed sensor WOT: wide open throttle
1.1 ‘If it ain’t broke, don’t
fix it!’
1.1.1 What is needed to find
faults?
Finding the problem when complex automotive systems go wrong is easy, if you have the neces-sary knowledge. This knowledge is in two parts:
● understanding of the system in which the problem exists;
● the ability to apply a logical diagnostic routine. It is also important to be clear about two defini-tions:
● symptom(s) what the user/operator/repairer of the system (vehicle or whatever) notices; ● fault the error in the system that causes the
symptom(s).
‘If it is not broken then do not go to the trouble of repairing it,’ is the translation of this main sec-tion heading! It’s a fair comment but if a system is not operating to its optimum then it should be repaired. This is where the skills come in to play. It is necessary to recognise that something is not operating correctly by applying your knowledge of the system, and then by applying this know-ledge further and combining it with the skills of diagnostics, to be able to find out why.
Each main chapter of this book includes a basic explanation of the vehicle system followed by diagnostic techniques that are particularly appropriate for that area. Examples of fault-finding charts are also included. In the main, ref-erences will be to generic systems rather than to specific vehicles or marques. For specific details about a particular vehicle or system the manufac-turer’s information is the main source. Alterna-tively ‘Autodata’ produce a fine range of books; visit www.autodata.com for more details.
The knowledge requirement and the necessity for diagnostic skills are further illustrated in the next chapter.
Figure 1.1 shows a diagnostic procedure in action!
1.1.2 Heavy or light vehicles?
An important note about diagnostics is that the general principles or techniques can be applied to anysystem, physical or otherwise. As far as heavy or light vehicles are concerned then this is definitely the case. As discussed earlier, there is a need for knowledge of the particular system, but diagnostic skills are transferable.
1.2 Safe working
practices
1.2.1 Introduction
Safe working practices in relation to diagnostic procedures and indeed any work on a vehicle are essential – for your safety as well as that of others. You only have to follow two rules to be safe:
● use your common sense – don’t fool about; ● if in doubt – seek help.
Further, always wear appropriate personal protect-ive equipment (PPE) when working on vehicles.
1
Introduction
The following section lists some particular risks when working with electricity or electrical systems, together with suggestions for reducing them. This is known as risk assessment.
1.2.2 Risk assessment and
reduction
The following table notes some identified risks involved with working on vehicles. It is by no means exhaustive but serves as a good guide.
Identified risk Reducing the risk
Battery acid Sulphuric acid is corrosive so always use good PPE – in this case overalls and if necessary rubber gloves. A rubber apron is ideal, as are goggles if working with batteries a lot Electric shock Ignition HT (high tension, which simply means
high voltage) is the most likely place to suffer a shock, up to 25 000 V is quite normal. Use insulated tools if it is necessary to work on HT circuits with the engine running. Note that high voltages are also present on circuits containing windings due to back emf (electromotive force) as they are switched off; a few hundred volts is common. Mains supplied power tools and their leads should be in good condition and using an earth leakage trip is highly recommended Exhaust gases Suitable extraction must be used if the engine
is running indoors. Remember it is not just the carbon monoxide (CO) that might make you ill or even kill you, other exhaust compon-ents could cause asthma or even cancer Fire Do not smoke when working on a vehicle.
Fuel leaks must be attended to immediately. Remember the triangle of fire – (heat/fuel/ oxygen) – don’t let the three sides come together
Moving loads Only lift what is comfortable for you; ask for help if necessary and/or use lifting equipment. As a general guide, do not lift on your own if it feels too heavy!
Raising or Apply brakes and/or chock the wheels and lifting vehicles when raising a vehicle on a jack or drive on lift. Only jack under substantial chassis and suspension structures. Use axle stands in case the jack fails
Running Do not wear loose clothing; good overalls engines are ideal. Keep the keys in your possession
when working on an engine to prevent others starting it. Take extra care if working near running drive belts
Short circuits Use a jump lead with an in-line fuse to prevent damage due to a short when testing. Disconnect the battery (earth lead off first and back on last) if any danger of a short exists. A very high current can flow from a vehicle bat-tery, it will burn you as well as the vehicle Skin problems Use a good barrier cream and/or latex gloves.
Wash skin and clothes regularly
1.3 Terminology
1.3.1 Introduction
The terminology included in the following tables is provided to ensure that we are talking the same language. These tables are provided just as a simple reference source.
1.3.2 Diagnostic terminology
Symptom The effect of a fault noticed by the driver, user or technician
Fault The root cause of a symptom/problem Diagnostics The process of tracing a fault by means of its
symptoms, applying knowledge and analysing test results
Knowledge The understanding of a system that is required to diagnose faults
Logical A step by step method used to ensure nothing procedure is missed
Report A standard format for the presentation of results
1.3.3 General terminology
System A collection of components that carry out a function
Efficiency This is a simple measure of any system. It can be scientific for example if the power out of a system is less then the power put in, its percentage efficiency can be determined (Pout/Pin⫻100%). This could, for example, be
given as 80%. In a less scientific example, a vehicle using more fuel than normal is said to be inefficient
Noise Emanation of sound from a system that is either simply unwanted or is not the normal sound that should be produced
Active Any system that is in operation all the time (steering for example)
Passive A system that waits for an event before it is activated (an air bag is a good example) Short circuit An electrical conductor is touching something
that it should not be (usually another con-ductor or the chassis)
Open circuit A circuit that is broken (a switched off switch is an open circuit)
High In relation to electricity, this is part of a resistance circuit that has become more difficult for the
electricity to get through. In a mechanical system a partially blocked pipe would have a resistance to the flow of fluid
Quote To make an estimate of or give exact informa-tion on the price of a part or service. A quota-tion may often be considered to be legally binding
Estimate A statement of the expected cost of a certain job (e.g. a service or repairs) An estimate is normally a best guess and is not legally binding Dodgy, Words often used to describe a system or knackered or component, but they mean nothing! Get used @#%&*! to describing things so that misunderstandings
are eliminated
1.4 Report writing
1.4.1 Introduction
As technicians you may be called on to produce a report for a customer. Also, if you are involved in research of some kind it is important to be able to present results in a professional way. The fol-lowing sections describe the main headings that a report will often need to contain together with an example report based on the performance testing of a vehicle alternator.
Laying out results in a standard format is the best way to ensure that all the important and required aspects of the test have been covered. Keep in mind that the report should convey clearly to another person what has been done. Further, a ‘qualified’ person should be able to extract enough information to be able to repeat the test – and check your findings! Use clear sim-ple language remembering that in some cases the intended audience may not be as technically competent as you are.
1.4.2 Main headings of a
report
The following suggestions for the headings of a professional report will cover most requirements but can of course be added to or subtracted from if necessary. After each heading I have included brief notes on what should be included.
Contents
If the report is more than about five pages, a list of contents with page numbers will help the reader find his/her way through it.
Introduction
Explain the purpose of what has been done and set the general scene.
Test criteria
Define the limits within which the test was car-ried out. For example, temperature range or speed settings.
Facilities/resources
State or describe what equipment was used. For example: ‘A “Revitup” engine dynamometer, model number C3POwas used for the consump-tion test’.
Test procedures
Explain here exactly what was done to gain the results. In this part of the report it is very import-ant not to leave out any details.
Measured results
Present the results in a way that is easy to inter-pret. A simple table of figures may be appropriate. If the trend of the results or a comparison is import-ant, a graph may be better. Pictures of results or oscilloscope waveforms may be needed. If neces-sary a very complex table of results from which you draw out a few key figures, could be presented as an appendix. You should also note the accuracy of any figures presented (⫾0.5% for example).
Analysis of results
This is the part where you should comment on the results obtained. For example, if say a fuel consumption test was carried out on two vehicles, a graph comparing one result to the other may be appropriate. Comments should be added if nec-essary, such as any anomaly that could have affected the results (change of wind direction for example).
Conclusions/comments/
observations
Note here any further tests that may be necessary. Conclude that device X does perform better than device Y – if it did! If appropriate, add observa-tions such as how device Y performed better under the set conditions, but under other circum-stances the results could have been different. Comment on the method used if necessary.
Forecast
Appendices
Detailed pages of results that would ‘clog up’ the main report or background material such as leaflets relating to the test equipment.
1.4.3 Example report
An example report is presented here relating to a simple alternator test where its actual output is to be compared to the rated output. Minimal details are included so as to illustrate the main points.
Introduction
A ‘Rotato’ 12 V alternator was tested under nor-mal operating conditions to check its maximum output. The manufacturer’s specifications stated that the alternator, when hot, should produce 95 A at 6000 rev/min.
Test criteria
● Start at room temperature.
● Run alternator at 3000 rev/min, 30 A output for 10 minutes.
● Run alternator at 6000 rev/min, maximum output. Check reading every 30 seconds for 10 minutes.
● Run alternator at 6000 rev/min, maximum put for a further 20 minutes to ensure that out-put reading is stable.
Facilities/resources
A ‘Krypton’ test bench model R2D2was used to drive the alternator. The test bench revcounter was used and a ‘Flake’ digital meter fitted with a 200 A shunt was used to measure the output. A variable resistance load was employed.
Test procedures
The alternator was run for 10 minutes at 3000 rev/min and the load adjusted to cause an output of 30 A. This was to ensure that it was at a nominal operating temperature. The normal fan was kept in place during the test.
Speed was then increased to 6000 rev/min and the load adjusted to achieve the maximum possible output. The load was further adjusted as required to keep the maximum possible output in case the load resistance changed due to tempera-ture. Measurements were taken every 30 seconds for a period of 10 minutes.
Measured results
Speed held constant at 6000 (⫾200) rev/min. Room temperature (18°C).
Time(⫾1 s) 0 30 60 90 120 150 180 210 240 270
Output 101 100 99 99 98 98 98 98 98 98
(⫾0.2 A)
Time 300 330 360 390 420 450 480 510 540 570 600 (⫾1 s)
Output 97 97 96 96 96 96 96 96 96 96 96 (⫾0.2 A)
To ensure that the alternator output had stabilised it was kept running for a further 20 minutes at full output. It continued to hold at 96 A.
Analysis of results
Figure 1.2 shows the results in graphical format.
Conclusions
The manufacturer’s claims were validated. The device exceeded the rated output by 6% at the start
of the test and under continuous operation at full load, continued to exceed the rated output by 1%. The maximum duration of this test was 20 min-utes. It is possible, however, that the device would increase in temperature and the output may fall
further after prolonged operation. Further tests are necessary to check this. Overall the device per-formed in excess of its rated output.
(Sign and date the report)
Tom Denton, Wednesday, 25th Jan. 2006
Knowledge check questions
To use these questions, you should first try to answer them without help but if necessary, refer back to the content of the chapter. Use notes, lists and sketches as appropriate to answer them. It is not neces-sary to write pages and pages of text!
1. State the meaning of the terms ‘fault’ and ‘symptom’.
2. Explain how to reduce the risk of a short circuit when testing electrical systems. 3. List the main headings that could be used for a standard report.
4. State the two main pieces of knowledge necessary to diagnose faults.
2.1 Introduction
2.1.1 Logic
Diagnostics or faultfinding is a fundamental part of an automotive technician’s work. The subject of diagnostics does not relate to individual areas of the vehicle. If your knowledge of a vehicle sys-tem is at a suitable level, then you will use the same logical process for diagnosing the fault, whatever the system.
2.1.2 Information
Information and data are available for carrying out many forms of diagnostic work. The data may come as a book or on CD. This information is vital and will ensure that you find the fault – particularly if you have developed the diagnostic skills to go with it. Faultfinding charts and spe-cific examples are presented in later chapters.
The general type of information available is as follows:
● engine diagnostics, testing and tuning; ● servicing, repairs and times;
● fuel and ignition systems and carburettor; ● auto electrics;
● ABS diagnostics; ● component location;
● body repairs, tracking and tyres.
2.1.3 Where to stop?
This is one of the most difficult skills to learn. It is also one of the most important. The secret is twofold:
● know your own limitations – it is not possible to be good at everything;
● leave systems alone where you could cause more damage or even injury – for example air bag circuits.
Often with the best of intentions, a person new to diagnostics will not only fail to find the fault
but introduce more faults into the system in the process.
I would suggest you learn your own strengths and weaknesses; you may be confident and good at dealing with mechanical system problems but less so when electronics is involved. Of course you may be just the opposite of this.
Remember that diagnostic skill is in two parts – the knowledge of the system and the abil-ity to apply diagnostics. If you do not yet fully understand a system – leave it alone!
2.2 Diagnostic process
2.2.1 Six-stage process
A key checklist – the six stages of fault diagnosis – is given in Table 2.1.
Here is a very simple example to illustrate the diagnostic process. The reported fault is exces-sive use of engine oil.
1. Question the customer to find out how much oil is being used (is it excessive?).
2. Examine the vehicle for oil leaks and blue smoke from the exhaust.
3. If leaks are found the engine could still be burning oil but leaks would be a likely cause. 4. A compression test, if the results were
accept-able, would indicate the leak to be the most likely fault. Clean down the engine and run for a while. The leak will show up better. 5. Change a gasket or seal, etc.
6. Run through an inspection of the vehicle sys-tems particularly associated with the engine.
2
Diagnostic techniques
Table 2.1
1. Verify the fault
2. Collect further information 3. Evaluate the evidence
4. Carry out further tests in a logical sequence 5. Rectify the problem
Double check the fault has been rectified and that you have not caused any further problems.
The stages of faultfinding will be used exten-sively to illustrate how a logical process can be applied to any situation.
2.2.2 The art of diagnostics
The knowledge needed for accurate diagnostics is in two parts:
1. understanding of the system in which the problem exists;
2. having the ability to apply a logical diagnostic routine.
The knowledge requirement and use of diagnostic skills can now be illustrated with a very simple example. After connecting a hose pipe and turning on the tap, no water comes out of the end! Your knowledge of this system tells you that water should come out providing the tap is on, because the pressure from a tap pushes water through the pipe, and so on. This is where your diagnostic skills become essential. The following stages are now required.
1. Confirm that no water is coming out by look-ing down the end of the pipe!
2. Does water come out of the other taps, or did it come out of this tap before you connected the hose?
3. Consider what this information tells you; for example, if the answer is ‘Yes’ the hose must be blocked or kinked.
4. Walk the length of the pipe looking for a kink. 5. Straighten out the hose.
6. Check that water now comes out and that no other problems have been created.
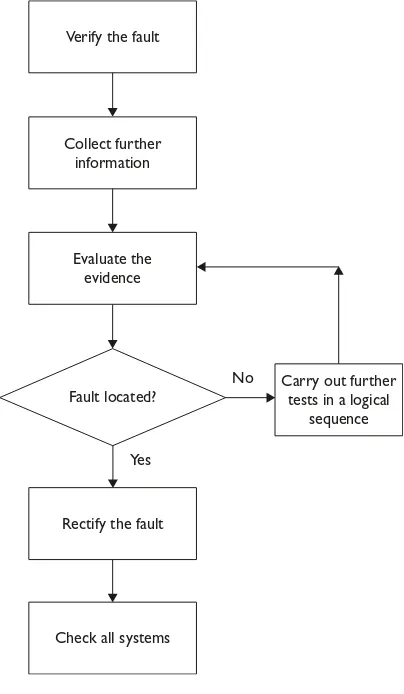
Much simplified I accept, but the procedure you have just followed made the hose work and it is also guaranteed to find a fault in anysystem. It is easy to see how it works in connection with a hose pipe and I’m sure anybody could have found that fault (well most people anyway)! The higher skill is to be able to apply the same logical routine to more complex situations. The routine (Table 2.1) is represented by Figure 2.1. The loop will con-tinue until the fault is located. I will now explain each of these steps further in relation to a more realistic automotive workshop situation – not that getting the hose to work is not important!
Often electrical faults are considered to be the most difficult to diagnose – but this is not true. I will use a vehicle cooling system fault as an
example here, but electrical systems will be covered in detail in later chapters. Remember that the diagnostic procedure can be applied to any problem, mechanical, electrical or even personal! However, let’s assume that the reported fault with the vehicle is overheating. As is quite com-mon in many workshop situations that’s all the information we have to start with. Now work through the six stages.
● Stage 1 Take a quick look to check for obvi-ous problems such as leaks, broken drive belts or lack of coolant. Run the vehicle and con-firm that the fault exists. It could be the tem-perature gauge for example.
● Stage 2 Is the driver available to give more information? For example, does the engine overheat all the time or just when working hard? Check records, if available, of previous work done to the vehicle.
● Stage 3 Consider what you now know. Does this allow you to narrow down what the cause of the fault could be? For example, if the vehicle
Verify the fault
Collect further information
Evaluate the evidence
No Carry out further tests in a logical
sequence
Yes
Rectify the fault
Check all systems Fault located?
overheats all the time and it had recently had a new cylinder head gasket fitted, would you be suspicious about this? Don’t let two and two make five, but do let it act as a pointer. Remember that in the science of logical diag-nostics, two and two always makes four! However, until you know this for certain then play the best odds to narrow down the fault. ● Stage 4 The further tests carried out would
now be directed by your thinking at stage three. You don’t yet know if the fault is a leaking head gasket, the thermostat stuck closed or some other problem. Playing the odds, a cooling sys-tem pressure test would probably be the next test. If the pressure increases when the engine is running then it is likely to be a head gasket or similar problem. If no pressure increase then move on to the next test and so on. After each test go back to stage 3 and evaluate what you know, notwhat you don’t know!
● Stage 5 Let’s assume the problem was a thermostat stuck closed – replace it and top up the coolant, etc.
● Stage 6 Check that the system is now work-ing. Also check that you have not caused any further problems such as leaks or loose wires. This example is simplified a little, but like the hose pipe problem it is the sequence that mat-ters, particularly the ‘stop and think’ at stage 3. It is often possible to go directly to the cause of the fault at this stage, providing that you have an adequate knowledge of how the system works.
2.2.3 Summary
I have introduced the six-stage process of diag-nostics, not so it should necessarily be used as a checklist but to illustrate the process that must be followed. Much more detail is required still, par-ticular in relation to stages 3 and 4. The purpose of this set process is to ensure that ‘we’ work in a particular, logical way.
I would like to stress the need for a logical process again – with a quotation! ‘Logic is the beginning of wisdom not the end.’ (Spock to Valeris, Star Trek II)
2.3 Diagnostics on paper
2.3.1 Introduction
This section is again a way of changing the way you approach problems on a vehicle. The key message is that if you stop and think before
‘pulling the car to pieces’, it will often save a great deal of time. In other words, some of the diagnostic work can be done ‘on paper’ before we start on the vehicle. To illustrate this, the next section lists symptoms for three separate faults on a car and for each of these symptoms, three possible faults. All the faults are possible but in each case choose the ‘most likely’ option.
2.3.2 Examples
Symptoms Possible faults
A The brake/stop lights are 1. Two bulbs and 12 LEDs reported not operating. On blown
checking it is confirmed 2. Auxiliary systems relay that neither of the two open circuit
bulbs or the row of 3. Brake light switch not high-mounted LEDs is closing
operating as the pedal is pressed. All other systems work correctly
B An engine fitted with full 1. Fuel pump output management system tends to pressure low
stall when running slowly. 2. Idle control valve sticking It runs well under all other 3. Engine speed sensor wire conditions and the reported loose
symptom is found to be intermittent
C The off side dip beam 1. Two bulbs blown headlight not operating. This 2. Main lighting fusible link is confirmed on examination blown
and also noted is that the 3. Short circuit between off off side tail light does not side tail and dip beam
work lights
The most likely fault for example A, is number 3. It is possible that all the lights have blown but unlikely. It could not be the auxiliary relay because this would affect other systems.
For example B, the best answer would be num-ber 2. It is possible that the pump pressure is low but this would be more likely to affect operation under other conditions. A loose wire on the engine speed sensor could cause the engine to stall but it would almost certainly cause misfire under other conditions.
The symptoms in C would suggest answer 1. The short circuit suggested as answer 3 would be more likely to cause lights and others to stay on rather that not work, equally the chance of a short between these two circuits is remote if not impos-sible. If the lighting fusible link were blown then none of the lights would operate.
taking a screwdriver to the car, a lot of time can be saved. If the problems suggested in the previ-ous table were real we would at least now be able to start looking in the right area for the fault.
2.3.3 How long is a piece of
string?
Yes I know, twice the distance from the middle to one end! What I am really getting at here though is the issue about what is a valid reading/ measurement and what is not – when compared to data. For example if the ‘data book’ says the resistance of the component should be between 60 and 90⍀, what do you do when the measured value is 55⍀? If the measured value was 0⍀or 1000⍀then the answer is easy – the component is faulty! However, when the value is very close you have to make a decision. In this case (55⍀) it is very likely that the component is serviceable.
The decision over this type of issue is difficult and must in many cases be based on experience. As a general guide however, I would suggest that if the reading is in the right ‘order of magnitude’, then the component has a good chance of being OK. By this I mean that if the value falls within the correct range of 1s, 10s, 100s or 1000s etc. then it is probably good.
Do notice that I have ensured that words or phrases such as ‘probably’, ‘good chance’ and ‘very likely’ have been used here! This is not just to make sure I have a get out clause; it is also to illustrate that diagnostic work can involve ‘playing the best odds’ – as long as this is within a logical process.
2.4 Mechanical diagnostic
techniques
2.4.1 Check the obvious first!
Start allhands on diagnostic routines with ‘hand and eye checks’. In other words look over the vehicle for obvious faults. For example, if auto-matic transmission fluid is leaking on to the floor then put this right before carrying out complicated stall tests. Here are some further suggestions that will at some point save you a lot of time.
● If the engine is blowing blue smoke out of the exhaust – consider the worth of tracing the cause of a tapping noise in the engine! ● When an engine will not start – check that
there is fuel in the tank!
2.4.2 Noise, vibration and
harshness
Noise, vibration and harshness (NVH) concerns have become more important as drivers have become more sensitive to these issues. Drivers have higher expectations of comfort levels. Noise, vibration and harshness issues are more noticeable due to reduced engine noise and better insulation in general. The main areas of the vehicle that pro-duce NVH are:
● tyres;
● engine accessories; ● suspension; ● driveline.
It is necessary to isolate the NVH into its specific area(s) to allow more detailed diagnosis. A road test as outlined later is often the best method.
The five most common sources of non-axle noise are exhaust, tyres, roof racks, trim and mouldings, and transmission. Ensure that none of the following conditions is the cause of the noise before proceeding with a driveline strip down and diagnosis.
1. In certain conditions, the pitch of the exhaust may sound like gear noise or under other con-ditions like a wheel bearing rumble.
2. Tyres can produce a high pitched tread whine or roar, similar to gear noise. This is particu-larly the case for non-standard tyres.
3. Trim and mouldings can cause whistling or whining noises.
4. Clunk may occur when the throttle is applied or released due to backlash somewhere in the driveline.
5. Bearing rumble sounds like marbles being tumbled.
2.4.3 Noise conditions
Noise is very difficult to describe. However, the following are useful terms and are accompanied by suggestions as to when they are most likely to occur.
● Gear noise is typically a howling or whining due to gear damage or incorrect bearing pre-load. It can occur at various speeds and driv-ing conditions, or it can be continuous. ● ‘Chuckle’ is a rattling noise that sounds like a
● Knock is very similar to chuckle though it may be louder and occurs on acceleration or deceleration.
Check and rule out tyres, exhaust and trim items before any disassembly to diagnose and correct gear noise.
2.4.4 Vibration conditions
Clicking, popping or grinding noises may be noticeable at low speeds and be caused by the following:
● inner or outer CV joints worn (often due to lack of lubrication so check for split gaiters); ● loose drive shaft;
● another component contacting a drive shaft; ● damaged or incorrectly installed wheel
bear-ing, brake or suspension component.
The following may cause vibration at normal road speeds:
● out-of-balance wheels; ● out-of-round tyres.
The following may cause shudder or vibration during acceleration:
● damaged power train/drive train mounts; ● excessively worn or damaged out-board or
in-board CV joints.
The cause of noise can often be traced by first looking for leaks. A dry bearing or joint will pro-duce significant noise.
1. Inspect the CV joint gaiters (boots) for cracks, tears or splits.
2. Inspect the underbody for any indication of grease splatter near the front wheel half shaft joint boots.
3. Inspect the in-board CV joint stub shaft bear-ing housbear-ing seal for leakage at the bearbear-ing housing.
4. Check the torque on the front axle wheel hub retainer.
2.4.5 Road test
A vehicle will produce a certain amount of noise! Some noise is acceptable and may be audible at certain speeds or under various driving condi-tions such as on a new road.
Carry out a thorough visual inspection of the vehicle before carrying out the road test. Keep in mind anything that is unusual. A key point is to
notrepair or adjust anything until the road test is
carried out. Of course this does not apply if the condition could be dangerous or the vehicle will not start!
Establish a route that will be used for all diag-nosis road tests. This allows you to get to know what is normal and what is not! The roads selected should have sections that are reasonably smooth, level and free of undulations as well as lesser quality sections needed to diagnose faults that only occur under particular conditions. A road that allows driving over a range of speeds is best. Gravel, dirt or bumpy roads are unsuitable because of the additional noise they produce.
If a customer complains of a noise or vibration on a particular road and only on a particular road, the source of the concern may be the road surface. Test the vehicle on the same type of road.
Make a visual inspection as part of the prelim-inary diagnosis routine prior to the road test; note anything that does not look right.
1. Tyre pressures, but do not adjust them yet. 2. Leaking fluids.
3. Loose nuts and bolts.
4. Bright spots where components may be rub-bing against each other.
5. Check the luggage compartment for unusual loads.
Road test the vehicle and define the condition by reproducing it several times during the road test. During the road test recreate the following conditions.
1. Normal driving speeds of 20 to 80 km/h (15 to 50 mph) with light acceleration, a moan-ing noise may be heard and possibly a vibra-tion is felt in the front floor pan. It may get worse at a certain engine speed or load. 2. Acceleration/deceleration with slow
accel-eration and decelaccel-eration, a shake is sometimes noticed through the steering wheel seats, front floor pan, front door trim panels, etc.
3. High speed a vibration may be felt in the front floor pan or seats with no visible shake, but with an accompanying sound or rumble, buzz, hum, drone or booming noise. Coast with the clutch pedal down or gear lever in neutral and engine idling. If vibration is still evident, it may be related to wheels, tyres, front brake discs, wheel hubs or wheel bearings.
the vibration. It can be caused by any compon-ent, from the accessory drive belt to the clutch or torque converter, which turns at engine speed when the vehicle is stopped.
5. Noise and vibration while turning clicking, popping or grinding noises may be due to the following: damaged CV joint; loose front wheel half shaft joint boot clamps; another component contacting the half shaft; worn, damaged or incorrectly installed wheel bearing; damaged power train/drive train mounts.
After a road test, it is often useful to do a simi-lar test on a lift. When carrying out the shake and vibration diagnosis or engine accessory vibra-tion diagnosis on a lift, observe the following precautions.
● If only one drive wheel is allowed to rotate, speed must be limited to 55 km/h (35 mph) indicated on the speedometer. This is because the actual wheel speed will be twice that indi-cated on the speedometer.
● The suspension should not be allowed to hang free. If a CV joint were run at a high angle, extra vibration as well as damage to the seals and joints could occur.
Support the front suspension lower arm as far out-board as possible. This will ensure that the vehicle is at its correct ride height. The pro-cedure is outlined by the following steps. 1. Raise and support the vehicle.
2. Explore the speed range of interest using the road test checks as previously discussed. 3. Carry out a coast down (overrun) in neutral. If
the vehicle is free of vibration when operating at a steady indicated speed and behaves very differently in drive and coast, a transmission concern is likely.
Note, however, that a test on the lift may pro-duce different vibrations and noises than a road test because of the effect of the lift. It is not unusual to find a vibration on the lift that was not noticed during the road test. If the condition found on the road can be duplicated on the lift, carrying out experiments on the lift may save a great deal of time.
2.4.6 Engine noises
How do you tell a constant tapping from a rattle? Worse still, how do you describe a noise in a book? I’ll do my best! Try the following table as a non-definitive guide to the source or cause of engine or engine ancillary noises.
Noise description Possible source
Tap Valve clearances out of adjustment, cam followers or cam lobes worn Rattle A loose component, broken piston
ring or component
Light knock Small end bearings worn, cam or cam follower
Deep knock or thud Big end bearings worn Rumble Main bearings worn Slap Worn pistons or bores Vibration Loose or out of balance
components
Clatter Broken rocker shaft or broken piston rings
Hiss Leak from inlet or exhaust manifolds or connections Roar Air intake noise, air filter missing,
exhaust blowing or a seized viscous fan drive
Clunk Loose flywheel, worm thrust bear-ings or a loose front pulley/damper Whine Power steering pump or alternator
bearing
Shriek Dry bearing in an ancillary component
Squeal Slipping drive belt
2.4.7 Sources of engine noise
The following table is a further guide to engine noise. Possible causes are listed together with the necessary repair or further diagnosis action as appropriate.
Sources of engine Possible cause Required action noise
Misfiring/backfiring Fuel in tank has Determine wrong octane/ which type of cetane number, fuel was last put or is wrong type in the tank of fuel
Ignition system Check the faulty ignition system Engine temperature Check the too high engine cooling
system Carbon deposits Remove the in the combustion carbon deposits chamber start to by using fuel glow and cause additives and misfiring driving the
vehicle carefully Timing incorrect, Check the which causes timing misfiring in the
Valve train faulty Valve clearance too Adjust valve large due to faulty clearance if bucket tappets or possible and
incorrect renew faulty
adjustment of valve bucket tappets – clearance check cam
condition Valve timing Check the valve incorrectly adjusted, timing and valves and pistons adjust if are touching necessary Timing belt broken Check timing belt or damaged and check pistons
and valves for damage – renew any faulty parts
Engine Pistons Disassemble the
components Piston rings engine and faulty Cylinder head gasket check
Big end and/or main components bearing journals
Ancillary Engine Check that all components components or components are
ancillary secure, tighten/ components loose adjust as required or broken Renew if broken
2.5 Electrical diagnostic
techniques
2.5.1 Check the obvious first!
Start allhands on diagnostic routines with ‘hand and eye checks’. In other words look over the vehicle for obvious faults. For example, if the bat-tery terminals are loose or corroded then put this right before carrying out complicated voltage readings. Here are some further suggestions that will at some point save you a lot of time.
● A misfire may be caused by a loose plug lead – it is easier to look for this than interpret the ignition waveforms on a scope.
● If the ABS warning light stays on – look to see if the wheel speed sensor(s) are covered in mud or oil.
2.5.2 Test lights and analogue
meters – warning!
A test lamp is ideal for tracing faults in say a lighting circuit because it will cause a current to flow which tests out high resistance connections. However, it is this same property that will dam-age delicate electronic circuits – so don’t use it for any circuit that contains an electronic control unit (ECU). Even an analogue voltmeter can
cause enough current to flow to at best give you a false reading and at worst damage an ECU – so don’t use it!
A digital multimeter is ideal for all forms of testing. Most have an internal resistance in excess of 10 M⍀. This means that the current they draw is almost insignificant. An LED test lamp or a logic probe is also acceptable.
2.5.3 Generic electrical testing
procedure
The following procedure is very generic but with a little adaptation can be applied to any electrical system. Refer to manufacturer’s recom-mendations if in any doubt. The process of check-ing any system circuit is broadly as follows.
Start
Auxiliary systems diagnostic chart
Hand and eye checks (loose wires, loose switches and other obvious faults)–
all connections clean and tight. Check battery
Check motor (including linkages) or actuator or bulb(s) – visual check
Fuse continuity – (do not trust your eyes) check voltage at both sides with a
meter or a test lamp
Voltage supplies at the device/motor/ actuator/
bulb(s) are correct?
If used does the relay click (this means the relay has operated it is not necessarily
making contact)?
Check item with separate fused supply
if possible before condemning
Supply to switch – battery volts
No Yes
Yes No
Supply out of the switch and to the relay –
battery volts
Relay earth connection – note also that the relay may
have a supply and that the control switch may make the
earth connection
End
Supplies to relay (terminal 30 for example) – battery volts
Feed out of the relay (terminal 87 for example) – battery volts)
Voltage supply to the light within 0.5 V of the battery
2.5.4 Volt drop testing
Volt drop is a term used to describe the difference between two points in a circuit. In this way we can talk about a voltage drop across a battery (normally about 12.6 V) or the voltage drop across a closed switch (ideally 0 V but may be 0.1 or 0.2 V).
The first secret to volt drop testing is to remem-ber a basic rule about a series electrical circuit:
The sum of all volt drops around a circuit always adds up to the supply.
The second secret is to ensure that the circuit is switched on and operating – or at least the cir-cuit should be ‘trying to operate’!
In Figure 2.2 this means that V1⫹V2⫹
V3⫽Vs. When electrical testing, therefore, and if the battery voltage measured as say 12 V, a reading of less than 12 V at V2would indicate a volt drop between the terminals of V1and/or V3. Likewise the correct operation of the switch, that is it closes and makes a good connection, would be confirmed by a very low reading on V1.
What is often described as a ‘bad earth’ (when what is meant is a high resistance to earth), could equally be determined by the reading on V3.
To further narrow the cause of a volt drop down a bit, simply measure across a smaller area. The voltmeter V4, for example, would only assess the condition of the switch contacts.
2.5.5 Testing for short circuits
to earth
This fault will normally blow a fuse – or burn out the wiring completely! To trace a short circuit is very different from looking for a high resistance connection or an open circuit. The volt drop testing above will trace an open circuit or a high resistance connection.
My preferred method of tracing a short, after looking for the obvious signs of trapped wires, is
to connect a bulb or test lamp across the blown fuse and switch on the circuit. The bulb will light because on one side it is connected to the supply for the fuse and on the other side it is connected to earth via the fault. Now disconnect small sec-tions of the circuit one at a time until the test lamp goes out. This will indicate the particular circuit section that has shorted out.
2.5.6 On and off load tests
On load means that a circuit is drawing a current. Off load means it is not! One example where this may be an issue is when testing a starter circuit. Battery voltage may be 12 V off load but only 9 V when on load.
A second example is the supply voltage to the positive terminal of an ignition coil via a high resistance connection (corroded switch terminal for example). With the ignition on and the vehicle not running, the reading will almost certainly be battery voltage because the ignition ECU switches off the primary circuit and no volt drop will show up. However, if the circuit were switched on (with a fused jumper lead if necessary) a lower reading would result showing up the fault.
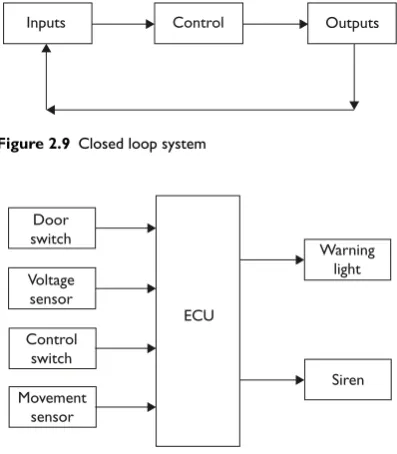
2.5.7 Black box technique
The technique that will be covered here is known as ‘black box faultfinding’. This is an excellent technique and can be applied to many vehicle systems from engine management and ABS to cruise control and instrumentation.
As most systems now revolve around an ECU, the ECU is considered to be a ‘black box’, in other words we know what it should do but how it does it is irrelevant! Any colour, so long as it’s black [Henry Ford (1920s)]. I doubt that he was referring to ECUs though …
Figure 2.3 shows a block diagram that could be used to represent any number of automobile electrical or electronic systems. In reality the arrows from the ‘inputs’ to the ECU and from the ECU to the ‘outputs’ are wires. Treating the ECU as a ‘black box’ allows us to ignore its com-plexity. The theory is that if all the sensors and associated wiring to the ‘black box’ are OK, all the output actuators and their wiring are OK and the supply/earth connections are OK, then the fault must be the ‘black box’. Most ECUs are very reliable, however, and it is far more likely that the fault will be found in the inputs or outputs.
Normal faultfinding or testing techniques can be applied to the sensors and actuators. For exam-ple, if an ABS system uses four inductive type wheel speed sensors, then an easy test is to meas-ure their resistance. Even if the correct value were not known, it would be very unlikely for all four to be wrong at the same time so a comparison can be made. If the same resistance reading is obtained on the end of the sensor wires at the ECU then almost all of the ‘inputs’ have been tested with just a few ohmmeter readings.
The same technique will often work with ‘out-puts’. If the resistance of all the operating wind-ings in say a hydraulic modulator were the same, then it would be reasonable to assume the figure was correct.
Sometimes, however, it is almost an advantage
not to know the manufacturer’s recommended readings. If the ‘book’ says the value should be between 800 and 900⍀, what do you do when your ohmmeter reads 905⍀? Answers on a post-card please … (or see Section 2.3.3).
Finally, don’t forget that no matter how complex the electronics in an ECU, they will not work without a good power supply and an earth!
2.5.8 Sensor to ECU
method
This technique is simple but very useful. Figure 2.4 shows a resistance test being carried out on a component. ⍀1is a direct measure of its
resist-ance whereas ⍀2 includes the condition of the
circuit. If the second reading is the same as the first then the circuit must be in good order.
Warning
The circuit supply must always be off when car-rying out ohmmeter tests.
2.5.9 Flight recorder tests
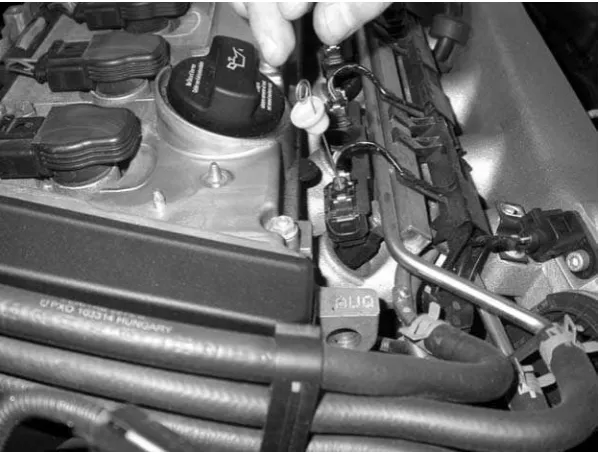
It is said that the best place to sit in an aeroplane is on the black box flight recorder! Well, apart from the black box usually being painted bright orange so it can be found after a crash, my reason for men-tioning it is to illustrate how the flight recorder principle can be applied to automotive diagnostics. Most hand-held scopes now have flight record facilities. This means that they will save the signal from any probe connection in memory for later play back. The time duration will vary depending on the available memory and the sample speed but this is a very useful feature.
As an example, consider an engine with an intermittent misfire that occurs only under load. If a connection is made to the suspected compon-ent (coil HT output for example), and the vehicle is road tested, the waveforms produced can be examined afterwards.
Many engine (and other system) ECUs have built in flight recorders in the form of self-diagnostic circuits. If a wire breaks loose causing a misfire but then reconnects the faulty circuit will be ‘remembered’ by the ECU.
2.5.10 Faultfinding by luck!
Or is it logic? If four electric windows stopped working at the same time, it would be very unlikely that all four motors had burned out. On the other hand if just one electric window stopped working,
Input 1
Figure 2.3System block diagram
Ω1
then it may be reasonable to suspect the motor. It is this type of reasoning that is necessary when faultfinding. However, be warned it is theoretic-ally possible for four motors to apparently burn out all at the same time!
Using this ‘playing the odds’ technique can save time when tracing a fault in a vehicle system. For example, if both stop lights do not work and every-thing else on the vehicle is OK, I would suspect the switch (stages 1 to 3 of the normal process). At this stage though, the fault could be anywhere – even two or three blown bulbs. None-the-less a quick test at the switch with a voltmeter would prove the point. Now, let’s assume the switch is OK and it produces an output when the brake pedal is pushed down. Testing the length of wire from the front to the back of the vehicle further illustrates how ‘luck’ comes into play.
Figure 2.5 represents the main supply wire from the brake switch to the point where the wire ‘divides’ to each individual stop light (the odds say the fault must be in this wire). For the purpose of this illustration we will assume the open circuit is just before point ‘I’. The procedure continues in one of the two following ways. Either:
● guess that the fault is in the first half and test at point F;
● we were wrong! Guess that the fault is in the first half of the second half and test at point I; ● we were right! Check at H and we have the
fault … on test number THREE;
or:
● test from A to K in a logical sequence of tests; ● we would find the fault … On test number
NINE!
You may choose which method you prefer!
2.5.11 Colour codes and
terminal numbers
This section is really more to be used as a refer-ence source. It is useful, however, to become
familiar with a few key wire colours and terminal numbers when diagnosing electrical faults. As seems to be the case for any standardisation a number of colour code systems are in operation! For reference purposes I will just mention two.
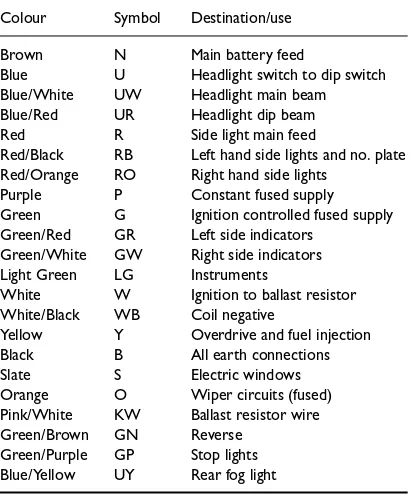
Firstly, the British Standard system (BS AU 7a: 1983): this system uses 12 colours to deter-mine the main purpose of the cable and tracer colours to further refine its use. The main colour uses and some further examples are given in the following table.
Colour Symbol Destination/use Brown N Main battery feed
Blue U Headlight switch to dip switch Blue/White UW Headlight main beam Blue/Red UR Headlight dip beam Red R Side light main feed
Red/Black RB Left hand side lights and no. plate Red/Orange RO Right hand side lights
Purple P Constant fused supply Green G Ignition controlled fused supply Green/Red GR Left side indicators
Green/White GW Right side indicators Light Green LG Instruments
White W Ignition to ballast resistor White/Black WB Coil negative
Yellow Y Overdrive and fuel injection Black B All earth connections Slate S Electric windows Orange O Wiper circuits (fused) Pink/White KW Ballast resistor wire Green/Brown GN Reverse
Green/Purple GP Stop lights Blue/Yellow UY Rear fog light
Secondly there is a ‘European’ system used by a number of manufacturers and based broadly on the following table. Please note there is no correlation between the ‘Euro’ system and the British Standard colour codes. In particular note the use of the colour brown in each system! After some practice with the use of colour code sys-tems the job of the technician is made a lot easier when faultfinding an electrical circuit.
Colour Symbol Destination/use
Red Rt Main battery feed
White/Black Ws/Sw Headlight switch to dip switch
White Ws Headlight main beam
Yellow Ge Headlight dip beam
Grey Gr Side light main feed
Grey/Black Gr/Sw Left hand side lights Grey/Red Gr/Rt Right hand side lights Black/Yellow Sw/Ge Fuel injection
Black/Green Sw/Gn Ignition controlled supply Black/White/Green Sw/Ws/Gn Indicator switch Black/White Sw/Ws Left side indicators Black/Green Sw/Gn Right side indicators Light Green LGn Coil negative
Brown Br Earth
Brown/White Br/Ws Earth connections
Black Sw Reverse
Black/Red Sw/Rt Stop lights Green/Black Gn/Sw Rear fog light
A system now in use almost universally is the terminal designation system in accordance with DIN 72 552. This system is to enable easy and correct connections to be made on the vehicle, particularly in after sales repairs. Note that the designations are not to identify individual wires but to define the terminals of a device. Listed below are some of the most popular numbers.
1 Ignition coil negative 4 Ignition coil high tension
15 Switched positive (ignition switch output) 30 Input from battery positive
31 Earth connection
49 Input to flasher unit 49a Output from flasher unit 50 Starter control (solenoid terminal)
53 Wiper motor input
54 Stop lamps
55 Fog lamps
56 Headlamps
56a Main beam
56b Dip beam
58L Left side lights 58R Right side lights 61 Charge warning light 85 Relay winding out 86 Relay winding input
87 Relay contact input (change over relay) 87a Relay contact output (break) 87b Relay contact output (make) L Left side indicators R Right side indicators
C Indicator warning light (vehicle)
The Ford Motor Company now uses a circuit numbering and wire identification system. This is in use worldwide and is known as Function,
System-Connection (FSC). The system was devel-oped to assist in vehicle development and pro-duction processes. However, it is also very useful in helping the technician with fault finding. Many of the function codes are based on the DIN sys-tem. Note that earth wires are now black! The system works as follows.
31S-AC3A || 1.5 BK/RD
Function:
31⫽ground/earth
S⫽additionally switched circuit
System:
AC⫽headlamp levelling
Connection:
3⫽switch connection A⫽branch
Size:
1.5⫽1.5 mm2
Colour:
BK⫽black (determined by function 31) RD⫽red stripe
The new Ford colour codes table is as follows:
Ford system codes are as follows.
Letter Main system Examples D Distribution systems DE⫽earth A Actuated systems AK⫽wiper/washer B Basic systems BA⫽charging
BB⫽starting C Control systems CE⫽power steering G Gauge systems GA⫽level/pressure/
temperature H Heated systems HC⫽heated seats L Lighting systems LE⫽headlights
M Miscellaneous systems MA⫽air bags P Power train control systems PA⫽engine control W Indicator systems WC⫽bulb failure
(‘indications’ not turn signals)
X Temporary for future XS⫽too much! features
As a final point to this section it must be noted that the colour codes and terminal designations given are for illustration only. Further reference should be made for specific details to the manu-facturer’s information.
2.5.12 Back probing connectors
Just a quick warning! If you are testing for a sup-ply (for example) at an ECU, then use the probes of your digital meter with care. Connect to the back of the terminals; this will not damage the connecting surfaces as long as you do not apply excessive force. Sometimes a pin clamped in the test lead’s crocodile/alligator clip is ideal for connecting ‘through’ the insulation of a wire without having to disconnect it. Figure 2.6 shows the ‘back probing’ technique.
2.6 Fault codes
2.6.1 Fast and slow
Most modern vehicle management systems carry out self-diagnostic checks on the sensors and actuators that connect to the vehicle ECU(s). A
fault in one of the components or its associated circuit causes a code to be stored in the ECU memory.
The codes may be described as ‘fast’ or ‘slow’. Some ECUs produce both types. An LED, dash warning light, scope or even an analogue voltmeter can be used to read slow codes. Normally, slow codes are output as a series of flashes that must then be interpreted by looking up the code in a fault code table. The slow codes are normally initiated by shorting two connections on the diagnostic plug and then switching the ignition on. Refer to detailed data before shorting any pins out!
Fast codes can only be read by using a fault code reader or scanner. Future ECUs will use fast codes. In the same way as we accept that a good digital multimeter is an essential piece of test equipment, it is now necessary to consider a fault code reader in the same way.
If a code reader is attached to the serial port on the vehicle harness, fast and slow codes can be read out from the vehicle computer. These are either displayed in the form of a two, three or four digit output code or in text format if soft-ware is used.
2.6.2 Fault code examples
A number of codes and descriptions are repro-duced below as an example of the detailed infor-mation that is available from a self-diagnosis system. The data relates to the Bosch Motronic 1.7