Curriculum Assessment of Higher Educational Institution using
Segmented-trace Clustering
Satrio Adi Priyambada1, Mahendrawathi Er1, Bernardo Nugroho Yahya2
Abstract: Curriculum mining is a recent research area that applies a data-driven approach to assess students’ learning behavior by discovering the curriculum model and compare it with the curriculum guideline. Some previous works exist to cope with the problem to discover the curriculum model from student database, by utilizing the concept of process mining. However, the challenges of discovering the curriculum model remain due to the different nature of student database from event log in twofold; the level of time granularity and variability of instance attributes. Previous works on curriculum mining that deal with conformance checking of the model between student’s learning behavior and curriculum guideline are related to sequence matching alignment which is insufficient to understand the patterns of a group of students in a particular level of time granularity, i.e., Semester. This study proposes a curriculum mining methodology for curriculum assessment and students’ learning behavior by creating segmented-trace profiles. The segmented-segmented-trace profiles are extracted based on a local alignment of sequences and generated as the input for sequence matching alignment to assess whether the observed students’ learning behavior match with the prior curriculum guideline. The profiles would be the features of the clustering approach. Real curriculum data has been used to test the effectivity of the methodology. The results show that the students can be grouped into various clusters per semester that have different characteristics for their learning behavior and performance. The results can be analyzed further to improve the curriculum guideline.
Keywords: Educational data mining; clustering; students’ learning behavior; curriculum.
Introduction
Educational Process Mining (EPM) is an emerging research area aiming at constructing a complete and compact educational process model that represents students’ learning behavior, checking whether the modeled learning behavior matches the observed be-havior and projecting information from logs onto the model to gain knowledge about the process (Třcka and Pechenizkiy [1]). Some of the applications of EPM in the academic institutions are to predict the drop out (Dekker et al. [2]), to recommend relevant courses to the students (Wang and Zaïane [3]), and to improve the current curriculum (Wong and Lavrencic [4]). The work of EPM related to the curri-culum is called as curricurri-culum mining. Curricurri-culum mining, as a part of EPM, aims to explore and ana-lyze the students’ learning behavior from student database. By utilizing some approaches on data mi-ning and process mimi-ning, curriculum mimi-ning refers to a data-driven approach that consists of three acti-vities, (i) actual curriculum model discovery that
1 Factulty of Information and Communication Technology,
Department of Information System, Institute Teknologi Sepuluh Nopember, Jl. Raya ITS, Keputih, Sukolilo, Surabaya, 60111, INDONESIA.
Email: [email protected]; [email protected]. 2 Industrial and Management Engineering Department, Hankuk University of Foreign Studies, Oedaero 81, Mohyeon-eup, Cheoin-gu, Yongin, 17035, SOUTH KOREA.
Email: [email protected]
* Corresponding author
finds a curriculum model that represents students’ learning behavior, (ii) curriculum model confor-mance checking to look whether observed students’ learning behavior match with curriculum guideline, and (iii) curriculum model extension to gain informa-tion that can be used to improve curriculum guideline or to make better decision (Pechenizkiy
et al. [5]). This approach has many benefits to understand student’s learning behavior in com -parison to the common curriculum assessment such as questionnaire- and/or interview-based methods (CUHK [6]). Besides, the availability of the student database has not been properly used to assess the students' real behavior following the curriculum guideline.
Semester 4). Regarding the type of curriculum, many related works focus on curriculum mining with the non-centralized curriculum (van der Aalst [7], OECD [8]). Those works are irelevant in specific cases of centralized and vertical coherent curriculum. The centralized curriculum refers to a curriculum design whereby a central organization, e.g., the government takes the decisions on the contents (OECD [8]). Meanwhile, coherent vertical curriculum denotes the institution which considers the student's competency at the end of the study by facilitating students’ learn -ing in a sequence such that one course is preceded to prepare them for the next course (Třcka and Peche-nizkiy [1]). The higher academic institutions in countries like Indonesia require to apply the cohe-rent vertical curriculum to set the standard com-petency of the students following the government guideline. All required courses in the centralized-and-coherent-curriculum-based institution should be opened almost every semester so that the students can earn the degree in time. As a consequence, the mining model using student database would be scattered and unstructured.
A study in process mining to reduce the complexity of unstructured (“spaghetti”) model refers to trace clustering. Trace clustering requires features in the form of vectors to seek the similarity among objects. The first work on trace clustering used the perspec-tive of the business process as identity profiles (i.e., activity and resources) whether the attributes exist in the trace or not (Song et al. [9]). Due to the different characteristics of the student database from the event log of process mining, there is a need to develop a specific profile for clustering to assess the curriculum from student database. Several works have introduced the alignment and profiling techni-ques in a centralized curriculum. Bendatu and Yahya [10] developed an approach, called sequence matching alignment, to check alignment between curriculum model and observed students' learning behaviors. Although the research had some interes-ting findings such as overall process effectiveness of curriculum learning model, the results could not show the homogeneity as well as the relevant patterns of particular students during the learning process. For example, it is unable to check the potential risk of drop out of particular students (Bendatu and Yahya [10]). Priyambada et al. [11] used an aggregate profile with sequence matching alignment to categorize students based on their academic profiles using clustering approach. The results show that the students can be grouped into three clusters based on the homogeneity of students’ learning behavior and performances. This research considers the full period of study, and thus the results are used to provide an overall input for the curriculum improvement (Priyambada et al. [11]).
However, it cannot provide detailed analysis on the alignment between the observed learning behaviors with the curriculum guideline for each semester. A segmented period analysis will enable a more pre-ventive intervention from the course designer and manager to help the students who have difficulties in the study.
Methods
Related Works
This section addresses some works on educational process mining and clustering approach in the do-main of process mining. First, educational process mining approaches, including curriculum mining and some alignment and profiling techniques, are discussed. Second, conveys the relevant works on trace clustering.
Educational Process Mining
Pechenizkiy et al. [12] proposed technique for process mining that applied to online assessment data. Va-rious ProM plug-ins were used to understand assess-ment processes like process discovery using heuristic miner or fuzzy miner, dotted chart analysis, perfor-mance analysis and conforperfor-mance checking. The results show that almost all of the students checked their answer before they submitted it and almost all of the students asked for feedback afterwards (Pechenizkiy et al. [12]). Although the research could discover students’ behavior, the results only discover behavior for online assessment data. Cairns et al.
[13] proposed methods to understand students learning behavior and factor that has an impact on their performance. The methods aimed to discover, analyze and provide a visual representation of the educational process. To analyze the process, they used ProM plug-in dotted chart, process modeling, social network mining, and clustering. Social network mining was used to discover interactions between students and another actor in training paths (Cairns et al. [13]). The results of this research could show students learning behavior and factor that has an impact on their performances, but could not show whether the students’ learning behavior conforms with curriculum guideline. This study develops a clustering method based on conformity of students’ learning behavior with curriculum guide -line. Analysis steps aim to see how the correlations between students’ learning behavior and students’ learning performances.
Bendatu and Yahya [10] proposed a method for curriculum assessment, called sequence matching alignment. It used some elements of the matching by considering the courses taken before, after, and the same with the defined semester in the curriculum guideline. Although the work could assess the curriculum based on the observed learning behaviors of the students, the results were limited only to show the matching analysis without exploring the risk of particular students during the learning process and the impact on students’ performances. Priyambada
et al. [11] used trace clustering method to cluster the
students learning behaviors by performing sequence matching alignment. The analysis results showed that students who had high average GPA tend to take courses earlier than the defined semester in the curriculum guidelines. On the other hand, students who have low average GPA not only took courses early but also took many courses after the defined semester in the curriculum guideline. Although the work could assess the curriculum guideline accord-ing to the students' learnaccord-ing behaviors, the results were limited only to a period of study (i.e., four years for bachelor degree) without showing the potential risk of students in each semester (e.g., low GPA could increase the potential of drop out). Hence, this study would cover the limitations of the previous works using the segmented-trace profiles to seek more details of students’ learning behaviors.
Trace Clustering
Process mining algorithms have problems to model highly unstructured process, and the impact of that is spaghetti-like process model that is difficult to analyze. Trace clustering is an approach to obtain results that represent process model by clustering the trace of cases (Bose and van Der Aalst [14]). Song
audits (Accorsi and Stocker [19]). Evermann et al.
[20] proposed trace clustering method based on a local alignment of sequences, subsequent multi-dimensional scaling, and k-means clustering to discover simpler models. This study attempts to contribute in the domain of trace clustering by proposing segmented-trace clustering which is based on the trace profile per semester to categorize students according to the learning behavior of each semester.
Framework
This study proposes a framework to assess students' learning behavior in conformity with curriculum guideline. The framework consists of three major steps, which are data preparation, curriculum as-sessment, and analysis. Figure 1 shows the proposed framework.
Table 1. Example of students’ transcript
Student ID Event ID Semester Course
code
Grade
01 E01 S1 MK1 AB
01 E02 S1 MK2 D
01 E03 S2 MK2 B
01 E04 S2 MK3 B
01 E05 S3 MK4 A
01 E06 S3 MK5 B
01 E07 S4 MK6 B
01 E08 S4 MK7 B
01 E09 S5 MK8 A
02 E10 S1 MK1 A
02 E11 S1 MK2 B
02 E12 S2 MK3 AB
02 E13 S2 MK4 AB
02 E14 S3 MK5 AB
02 E15 S3 MK6 A
02 E16 S4 MK7 B
02 E17 S4 MK8 AB
03 E18 S1 MK1 B
03 E19 S1 MK2 AB
03 E20 S2 MK3 A
03 E21 S2 MK4 A
03 E22 S3 MK5 AB
03 E23 S3 MK6 AB
03 E24 S3 MK7 A
03 E25 S4 MK8 A
Data Preparation
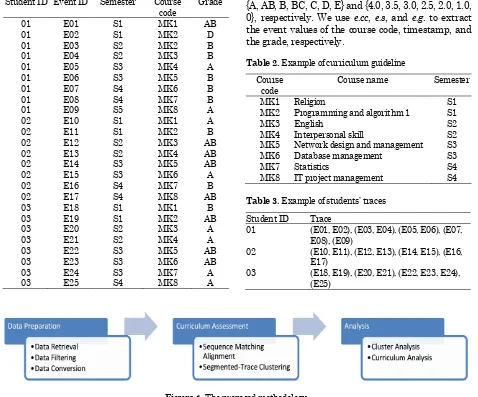
Data preparation aims to obtain students’ learning behavior from academic information systems data-base. This step consists of three parts; data retrieval, data filtering, and data conversion. Data retrieval refers to the extracting the students' transcript into an event log that contains a set of cases required for the analysis. The data retrieved from institution database is students’ performance data such as student id, course id, course name, course credit, course grade and the semester indicating when each course was taken. Student id acts as case id, course name as an activity, semester when the course is taken as timestamp, and grade as another attribute. An event log ( ) is a multiset of traces. Each trace is mapped into a case and consists of a collection of events, which is defined as follows:
is a set of events and where
EID is a set of event ID, is a set of course code, is a set of timestamps (i.e., Semester), and is a set of grades illustrated by letter and number such as {A, AB, B, BC, C, D, E} and {4.0, 3.5, 3.0, 2.5, 2.0, 1.0, 0}, respectively. We use e.cc, e.s, and e.g. to extract the event values of the course code, timestamp, and the grade, respectively.
Table 2. Example of curriculum guideline
Course code
Course name Semester
MK1 Religion S1
MK2 Programming and algorithm 1 S1
MK3 English S2
MK4 Interpersonal skill S2
MK5 Network design and management S3
MK6 Database management S3
MK7 Statistics S4
MK8 IT project management S4
Table 3. Example of students’ traces
Student ID Trace
01 (E01, E02), (E03, E04), (E05, E06), (E07,
E08), (E09)
02 (E10, E11), (E12, E13), (E14, E15), (E16,
E17)
03 (E18, E19), (E20, E21), (E22, E23, E24),
(E25)
A Log ( ) refers to a sequence of events ( ) each of
is the set of possible event sequences.
Table 1 displays a fragment of event log related to educational process from academic information sys-tems database. The database contains three cases, which refer to student ID {01,02,03}. The timestamps denoted by S1, S2, S3, S4, and S5 refer to Semester 1, Semester 2, Semester 3, Semester 4 and Semester 5, respectively. The set of course codes in database refers to the course names as shown in Table 2 Table 2 displays a fragment of curriculum model or guideline. The curriculum model contains a set of course codes, course names and semesters on which the student should take the course.
Data filtering aims to prune some outliers, e.g., outlier data and missing data. In this study, we limit our analysis for only the students who study in the period when there is no change in the curriculum
In this section, we will emphasize the methods that we used in this study; sequence matching alignment and segmented-trace clustering. For clustering, the data is processed using sequence matching align-ment. Sequence matching alignment will check the semester of a course taken by the student and com-pare it with the semester of the course in curriculum guideline. To check the semester of a course taken by the student, we need to analyze the trace of the event log with three steps; match, assign, and aggregate (Priyambada et al. [11]). The “match” step aims to measure the alignment of students’ trace with curriculum guideline. As aforementioned, the trace based on event log is a sequential data which represent the timestamp of the behavior. The curriculum guideline ( ) can be formulized as follows * | + where
refers to the index of -th semester and is the maximum semester allowed, refers to the -th index of course, is the total number of courses, and
is an identity function with values * +. For
example, denotes the course index 1 is in the
semester 1 and since the course index 1 is
not assigned in the semester 2. Let be a trace of a student learning behaviors, refers to student ID, refers to the index of semester and refers to the course index 1 was taken by student 1 in the semes-ter 1. Another example such as means the course index 1 was not in the transcript of student 1 in the semester 1. Hence, the matching analysis of a student c in the semester s ( ( )) is mea-mation from the curriculum guideline. If the student 01 took "Programming and Algorithm 1" in semester 1, as arranged in the curriculum guideline, then it is matched ( ( ) ). Otherwise, it is
unmat-ched ( ( ) ). The step “assign” aims to
measure the number of courses which do not match with the curriculum guideline and assign them in specific categories. There are three categories for these assignments; early-taken courses (before), late-taken courses (after) and relate-taken course. The early-taken course aims to measure the number of courses taken before the designated curriculum guideline meanwhile late-taken course aims to measure the number of courses taken after designated curriculum guideline. For example, student 01 took "Interper-sonal Skill" in Semester 3 represents as late-taken (after) course ( ( ) ) and student 03 took
"Statistics" in Semester 3 represents as early-taken (before) course ( ( ) ). Retaken courses
aim to count the number of courses retaken by stu-dents. Elective courses measure when students take an elective course. Since the elective courses appear differently for each semester, the analysis attempts only to measure the number of courses instead of matching alignment. To detect elective courses, we measure all of the courses. The number of students in the compulsory course must be equal to the num-ber of batch students. Otherwise, it is an elective course.
from summation the variable msc where s = 1 and c = that match designated curriculum guideline in respective semester for each student, CA is number of courses taken after designated curriculum guide-line in the respective semester for each student, CB is number of courses taken before designated curri-culum guideline in the respective semester for each student, CR is number of courses retaken in the research, cluster analysis was used to determine the composition of student learning profile per semester. One of the popular approaches in clustering is k
-Table 5. Example of clusters in semester 2
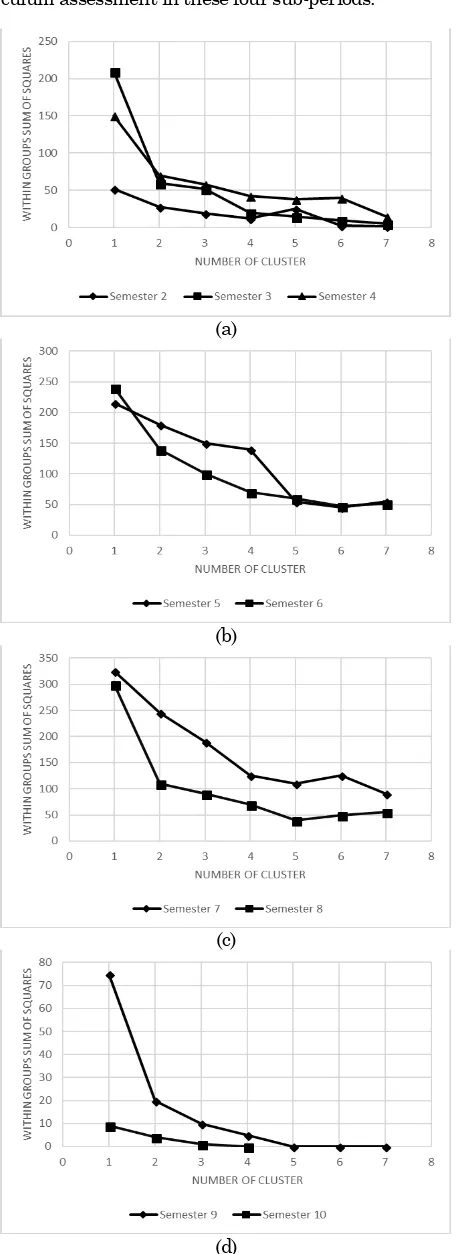
Clus-cluster. This study use elbow method to determine k point. First, conducts clustering using k-means clus-tering for different values of k are conducted. For each of k, calculates the within-cluster sum of square (wss). Plot the curve of wss for each cluster (k). Elbow method determined by the location of a bend in the plot that is generally considered as an indicator of the appropriate number of clusters [22].
Let a set of semesters (S1, S2, …, Sn) where each trace clustering is denoted in Equation (2) as follows: For every semester ∑ ∑ ‖
‖ (2)
Where is the cluster i in semester s, and is the mean point in .
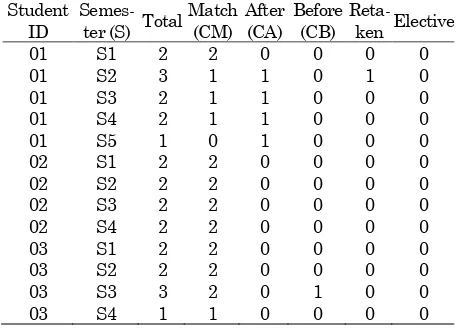
Finally, the segmented-trace clustering aims to group students based on their learning behavior (i.e. total, match, after, before, retaken, elective). This step results in various numbers of clusters for ana-lysis purpose. Table 5 shows the result of clustering phase.
For cluster analysis purposes, we use cluster charac-teristics and instance variables that consist of a number of students, Average Semester GPA (AS-GPA) and Average Cumulative GPA (AC-(AS-GPA). For each student, semester GPA is calculated by dividing the value of the grade earned for the courses by the total credit of courses in that semester. For each student, cumulative GPA is calculated by dividing the value of the grade earned in all courses by the total credit of all courses.
For curriculum analysis purpose, the data is process-ed to gain attributes that can represent all of the cluster members. So, each cluster has its average of each attribute. The average of each attribute is denoted in Equation (3) as follow:
courses (ACE). Specific only for ACT, the value is rounded. To facilitate better analysis, we use percentage from the average of each attribute divided by the average of total courses taken (ACT). The percentage of each attribute is denoted in Equation (4) as follow:
(4)
Where is a percentage of the average match courses taken of average total courses taken in cluster j-th semester i-th. For other attributes i.e.
ACA, ACB, ACR, and ACE the same formula is used to calculate the value of percentage of the average courses taken after designated curriculum (RCA), percentage of the average courses taken before designated curriculum (RCB), percentage of the average courses retaken (RCR) and percentage of elective courses (RCE).
Cluster Analysis aims to analyze the characteristics of clustering results for each semester based on a number of students, average semester GPA, and average cumulative GPA. Curriculum Analysis aims to analyze the students’ learning behavior of clus ter-ing results for each semester based on the alignment of the courses to curriculum guideline (i.e. match, after, before, retaken and elective). It also analyzes the impact of students learning behavior to their per-formances.
Results and Discussions
This section describes the implementation results and discusses some relevant issues of the current work. The approach of this study is implemented using Java Programming Language as a plugin in process mining tool, called ProM. R is used as the tool for clustering per semester, and elbow method is used to determine k point.
The framework is applied to the dataset of a batch of 2009 academic record obtained from Information System department of a public university in Sura-baya, Indonesia. The choice for this dataset is mainly for two reasons. First, the students in the batch of 2009 have not affected by curriculum changes in the respective departments. In another word, there are no curriculum changes during the period of study between 2009 and 2012. Second, the variation of the instances in the batch of 2009 could represent the general students’ learning behavior. This data batch could be the basis to analyze the student’s learning behavior from another batch.
To evaluate the performance of the proposed ap-proach, we categorize the period of study into four sub-periods; early, mid, late, and additional semes-ters. Early semesters refer to semester 2, 3, and 4. Mid semesters denote as semester 5 and 6. Late semesters denote as semester 7, 8. While the additio-nal semesters refer to the semester of the students
when they exceed the regular period of study, which is semester 9 and 10. The analysis will focus on the clusters of students’ learning behaviors and curri -culum assessment in these four sub-periods.
(a)
(b)
(c)
(d)
Each semester is likely to have specific characteris-tics. Therefore, this study begins with analyzing the different values for the clustering. The results of applying the elbow method show that number of clusters are four clusters for semester 2, 3, 4 (Figure 2a), six clusters for semester 5 and 6 (Figure 2b), five clusters for semester 7 and 8 (Figure 2c), four clus-ters for semester 9 and three clusclus-ters for semester 10 (Figure 2d). The next subsection explores the profile characteristics for each cluster as well as the period, i.e., semester.
Early Semesters
Tables 6, 7 and 8 show the students’ learning beha -viors for each cluster in the early semesters. In the
IS department, semester 2 is the first semester where the students learning behavior can vary depending on their performance (GPA). Students with an average GPA higher than 3 are allowed to take more courses.
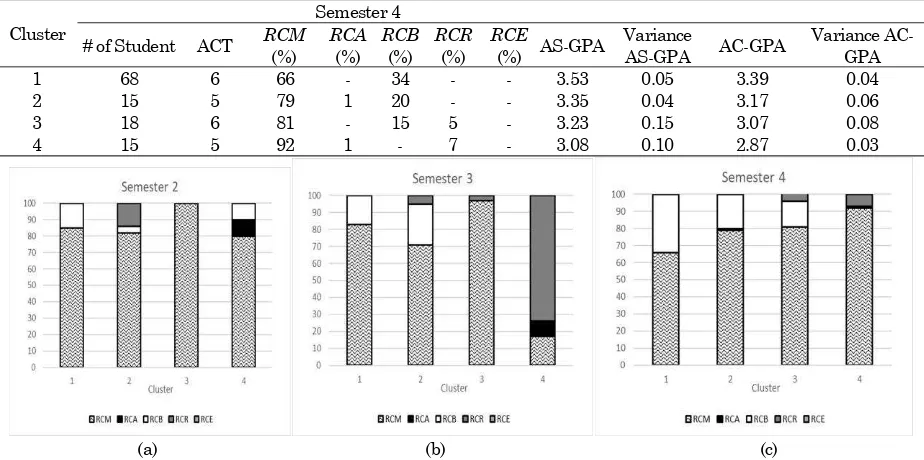
As shown in Figure 3a, semester 2 was the only semester that had a cluster which aligned correctly to the curriculum shown by the value of RCM equals to 100%. The figure shows that most students also take courses before the designated semesters, i.e. courses from later semester. On the contrary, it also shows that a group of students is not performing as well as their batch as they must retake courses from the previous semester or taking courses later than the designated curriculum. In cluster 2, students
Table 6. Students’ learning behavior of each cluster in semester 2
Cluster
Semester 2
# of Student ACT RCM
(%)
RCA
(%)
RCB
(%)
RCR
(%)
RCE
(%) AS-GPA
Variance
AS-GPA AC-GPA
Variance AC-GPA
1 94 7 85 - 15 - - 3.16 0.15 3.20 0.10
2 7 7 82 - 4 14 - 3.08 0.26 3.09 0.12
3 13 6 100 - - - - 2.96 0.28 3.06 0.30
4 2 5 80 10 10 - - 1.20 0.14 1.90 0.03
Table 7. Students’ learning behavior of each cluster in semester 3
Cluster
Semester 3
# of Student ACT RCM
(%)
RCA
(%)
RCB
(%)
RCR
(%)
RCE
(%) AS-GPA
Variance
AS-GPA AC-GPA
Variance AC-GPA
1 79 6 83 - 17 - - 3.28 0.10 3.28 0.05
2 3 7 71 - 24 5 - 3.26 0.25 3.27 0.06
3 29 5 97 - - 3 - 2.90 0.15 3.00 0.11
4 5 5 17 9 - 74 - 2.85 0.03 2.58 0.01
Table 8. Students’ learning behavior of each cluster in semester 4
Cluster
Semester 4
# of Student ACT RCM
(%)
RCA
(%)
RCB
(%)
RCR
(%)
RCE
(%) AS-GPA
Variance
AS-GPA AC-GPA
Variance AC-GPA
1 68 6 66 - 34 - - 3.53 0.05 3.39 0.04
2 15 5 79 1 20 - - 3.35 0.04 3.17 0.06
3 18 6 81 - 15 5 - 3.23 0.15 3.07 0.08
4 15 5 92 1 - 7 - 3.08 0.10 2.87 0.03
(a) (b) (c)
must retake some courses shown from the value of
RCR (14%). Cluster 4 only consists of 2 students who failed their courses in the first semester so must retake the courses in semester 2 (RCA=10%). Although the number of students who “fail” in clus -ter 2 and 4 is relatively small, it must be addressed carefully by the department as these students will potentially lag in their study.
Semester 3 appears to be a potentially challenging period as more students in this semester retake the courses from previous semesters. As shown in Figure 3b, cluster 1 was the only cluster consisting of students that did not retake any courses. Instead, students in this cluster take some courses earlier than the designated curriculum. Students in cluster 2, also take some courses earlier than the designated curriculum (RCB = 24%), but some must retake their courses (RCR = 5%). Cluster 3, consists of 29 students also retake their courses (RCR = 3%). Finding from cluster 4 needs to be addressed further as it consists of students that only had RCM 17%. It means that only 17% of the courses taken by the students in this group match with curriculum
guide-line. The students in cluster 4 took their courses later than the designated curriculum (measured by
RCA) and retook courses from previous semesters (measured by RCR). Again, students in cluster 4 must be given more attention to preventing them from struggling further and even potentially drop-ping out. In semester 4, most students took courses before the designated curriculum. The occurrence of
RCB values in three of four clusters, i.e. 34%, 20% and 15% for cluster 1, 2 and 3, respectively (figure 3c) prove this condition. There are also students in cluster 2 that took the courses later than the desig-nated curriculum, albeit in a small portion (RCA=1%). However, students in cluster 3 must retake their courses while also taking courses from later semesters (RCB=15%). Finally, students in cluster 4 are students that misaligned from the curriculum guide as they took some courses later than the designated curriculum (RCA=1%) and retook some courses (RCR=7%).
Concerning students' performance, semester 2 is the period where the clusters of students with different learning behavior have a big average difference in (a) (b) (c)
Figure 4. Boxplots of students’ performance in semester 2 (a), semester 3 (b) and semester 4 (c)
Table 9. Students’ learning behavior of each cluster in semester 5
Cluster
Semester 5
# of Student ACT RCM
(%)
RCA
(%)
RCB
(%)
RCR
(%)
RCE
(%) AS-GPA
Variance
AS-GPA AC-GPA
Variance AC-GPA
1 3 6 53 - 24 - 24 3.77 0.01 3.59 0.00
2 37 6 75 - 10 - 14 3.54 0.06 3.41 0.06
3 8 5 76 - 24 - - 3.51 0.10 3.44 0.06
4 48 5 82 - - - 18 3.42 0.08 3.30 0.03
5 15 5 90 4 - 6 - 3.08 0.09 3.00 0.03
6 5 6 42 58 - - - 2.76 0.06 2.67 0.02
Table 10. Students’ learning behavior of each cluster in semester 6
Cluster
Semester 6
# of Student ACT RCM
(%)
RCA
(% )
RCB
(%)
RCR
(%)
RCE
(%) AS-GPA
Variance
AS-GPA AC-GPA
Variance AC-GPA
1 50 6 70 - 13 - 17 3.50 0.07 3.35 0.04
2 30 7 51 - 35 - 14 3.49 0.08 3.51 0.03
3 15 6 78 - 21 1 - 3.29 0.04 3.21 0.04
4 4 6 88 12 - - - 2.97 0.12 2.88 0.01
5 4 6 79 4 - 17 - 2.90 0.06 2.79 0.02
their GPA (Figure 4a). Cluster 1 has the best median GPA of 3.20 with a maximum of 3.78, on the other hand, cluster 4 median GPA is only 1.20. The interesting finding found in semester 3 (Figure 4b) shows there are bigger variances in the GPA in certain clusters. Most notably, cluster 3 where the median of GPA is 2.86, but there is a member in this cluster that obtained average GPA of 3.69, while there is also a member that only achieved a GPA of 1.94. This implies that in semester 3, students with similar learning behavior, shown in the way chose their courses relative to the standard curriculum, lead to different performances (measured in their GPA). Different results are found in semester four where there are fewer variances in students’ performance within a cluster, shown by much narrower boxplots in Figure 4c. This means that in higher semesters the learning behaviors tend to bring more homogeneous results.
Mid Semesters
Table 9 and 10 show the students' learning beha-viors for each cluster in semesters 5 and 6. In mid semesters, students started taking elective courses, which coincide with the research laboratory that they will join. This leads to variations in students’ learning behaviors and eventually affects the
num-ber of clusters. It can be seen from Table 9 and 10 that most students take elective courses in both semesters shown from the RCE in three out of 6 clusters.
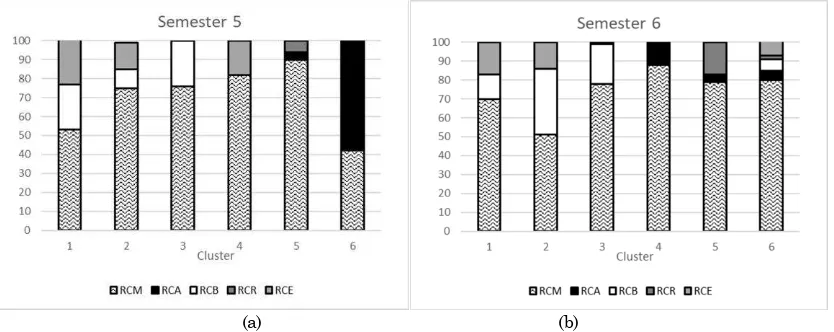
The patterns of student learning behavior and alignment to the curriculum in mid semesters are shown in Figure 5. In addition to the presence of elective courses (RCE), there are a group of students who also took some courses before the curriculum guide shown by values of RCB 24% and 10% for cluster 1 and 2, respectively. Students in cluster 3 only took courses later than the designated curri-culum (RCB=24%) and did not take elective courses. This shows their preferences to finish all the compul-sory courses first before taking an elective course and preparing for their final project. Students in cluster 4 preferred to take elective courses (RCE=18%) rather than courses from later semesters. On the other hand, the problems indicated in the early semesters persist and even are amplified in mid semesters. In semester 5, students in cluster 5 had to take courses later than the designated semester (RCA=4%) and at the same retake some courses (RCR= 6%). In the same semester, students in cluster 6 have RCA indicator as high as 58%, which means that more than half of the courses were taken later than designated curriculum. Some students in
(a) (b)
Figure 5. Patterns of student learning behavior and alignment to the curriculum in semester 5 (a) and semester 6 (b)
(a) (b)
this cluster were left behind up to 3 courses from their batch. Similar patterns found in semester 6 shows that cluster 4 consists of students who took the courses later than the designated curriculum (RCA=12%), and cluster 5 consists of students who took the courses after the designated curriculum
(RCA=4%) and must retake some courses (RCR
equals 17%). Cluster 6 shows a group of students with a lot of misalignments to the curriculum, since these students took courses after and before the curriculum guide, retook some of the courses while also took elective courses.
Table 11. Students’ learning behavior of each cluster in semesters 7
Cluster
Semester 7
# of Student ACT RCM (%) RCA (%) RCB (%) RCR (%) RCE (%) AS-GPA Variance
AS-GPA AC-GPA
Variance AC-GPA
1 48 5 55 - 41 1 3 3.35 0.25 3.39 0.03
2 21 5 55 - 19 1 25 3.26 0.10 3.20 0.05
3 18 6 46 1 30 4 19 3.17 0.21 3.13 0.05
4 13 6 46 - 49 - 5 3.14 0.35 3.31 0.08
5 16 4 19 17 46 9 9 2.99 0.55 3.30 0.18
Table 12. Students’ learning behavior of each cluster in semester 8
Cluster
Semester 8
# of Student ACT RCM (%) RCA (%) RCB (%) RCR (%) RCE (%) AS-GPA Variance
AS-GPA AC-GPA
Variance AC-GPA
1 4 7 35 31 - 15 19 2.88 0.36 2.80 0.00
2 5 4 45 - - 45 10 2.46 0.72 3.04 0.02
3 5 5 48 28 - 24 - 2.18 0.38 2.83 0.03
4 79 1 88 - - 26 1 1.79 2.65 3.27 0.05
5 7 3 62 14 - 14 10 1.43 0.09 2.95 0.01
(a) (b)
Figure 7. Patterns of student learning behavior and alignment to the curriculum in semester 7 (a) and semester 8 (b)
(a) (b)
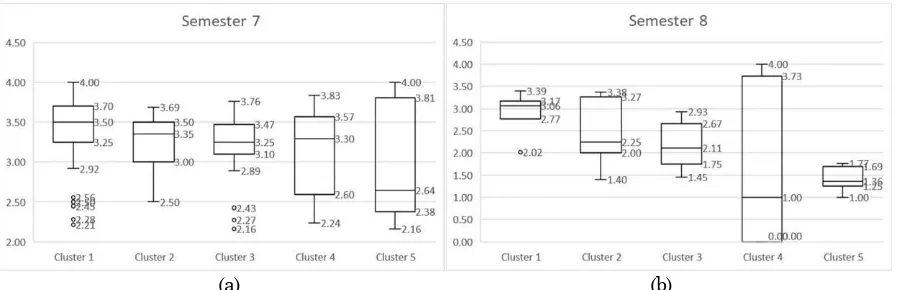
The impact of students’ learning behavior on the performance can be seen in figure 6a and 6b. Students in clusters 1, 2, and 3, who took courses before the designated semesters (RCB) and elective courses (RCE) achieved better performance than the rest of the clusters in semester 5 (Figure 6a). Similar performance obtained by students in these clusters suggest that different preferences in taking courses early and/or elective courses do not affect students’ performance. Students in cluster 4 performed
slight-ly below cluster 1–3 but still obtained relatively good results. On the other hand, students in cluster 5 who retook courses show low performance. Students in cluster 6 who took courses after the designated semester achieved the lowest performance. Similar patterns found in semester 6 (Figure 6b) shows the students who took courses early and elective show high performance. Interestingly, cluster 2 has one outlier, which means students taking the same set of courses can obtain different results. Cluster 6, which Table 13. Students’ learning behavior of each cluster in semester 9
Cluster
Semester 9
# of Student ACT RCM(%) RCA (%) RCB (%) RCR (%) RCE (%) AS-GPA Variance
AS-GPA AC-GPA
Variance AC-GPA
1 2 3 - 100 - - - 2.85 0.02 2.82 0.00
2 63 1 - 2 - 98 - 2.79 3.06 3.23 0.06
3 3 4 - 58 - 17 25 2.27 0.75 2.76 0.04
4 3 2 - - - 100 - 1.04 0.05 3.01 0.04
Table 14. Students’ learning behavior of each cluster in semester 10
Cluster
Semester 10
# of Student ACT RCM
(%) RCA (%) RCB (%) RCR (%) RCE (%) AS-GPA
Variance
AS-GPA AC-GPA
Variance AC-GPA
1 21 1 - - - 100 - 3.76 0.14 3.13 0.04
2 2 2 - - - 75 25 3.70 0.18 3.30 0.00
3 3 1 - 100 - - - 3.50 0.00 2.87 0.00
(a) (b)
Figure 9. Patterns of student learning behavior and alignment to the curriculum in semester 9 (a) and semester 10 (b)
(a) (b)
has a lot of misalignments to the curriculum guide also shows the most significant variance in the performance. As can be seen, cluster 6 has a wide boxplot with highest GPA of 3.44 and lowest value of 2.25.
Late Semesters
In late semesters students are almost finished with all their courses and must complete a final project. Tables 11 and 12 show students’ learning behavior for each cluster in late semesters. As can be seen, the student's learning behaviors vary significantly in these late semesters.
Exciting learning behavior of students in the late semester can be seen in Figures 7a and 7b. In semes-ter 7, all clussemes-ters took courses before the designated semesters (RCB) and elective courses (RCE). In the same semester, only students in cluster 4 who did not retake any courses. Cluster 5 consists of students who misaligned from the curriculum as they took similar courses after and before the designated curri-culum, retook some courses and took elective cours-es. In semester 8, all clusters have students who retook courses (RCR). Clusters 2 and 4 consist of students who retook courses while also took elective courses.
Clusters 1 and 5 consist of students who take the courses after the designated curriculum, retook some courses and took elective courses. Further perusal of the data indicates that most of the students took the final project in semester 7 while it is placed in semes-ter 8 in the curriculum guideline. The fact that the high number of students retook the course in semes-ter 8 means that the students have not finished their final project. Cluster 3 in semester 8 is the only cluster that did not take the elective course because students of this cluster must take courses after designated curriculum (RCA=28%) and retake cours-es from previous semcours-esters (RCR = 24%).
The boxplots in Figure 8a show that in semester 7 there is a significant difference in the students’ performance within a cluster. With many outliers in three clusters, semester 7 has the highest number of outliers compared to other semesters. This shows that during this semester, students who have similar learning behavior, thus are grouped in the same cluster, can have very different results. Interestingly, cluster 5 which has the broadest range of GPA, is the cluster of students who took courses after designated curriculum. The number of students has decreased in semester 8, as 16 students graduated at the end of semester 7. In semester 8, cluster 4 has the broadest range of GPA (0–4). This cluster consists of 79 students who only took one course (ACT = 1), i.e.
final project. Those that obtained maximum GPA (4) are students that graduated in that semester (29 students), while those who obtained minimum GPA (0) are students who did not complete their final project.
Additional Semesters
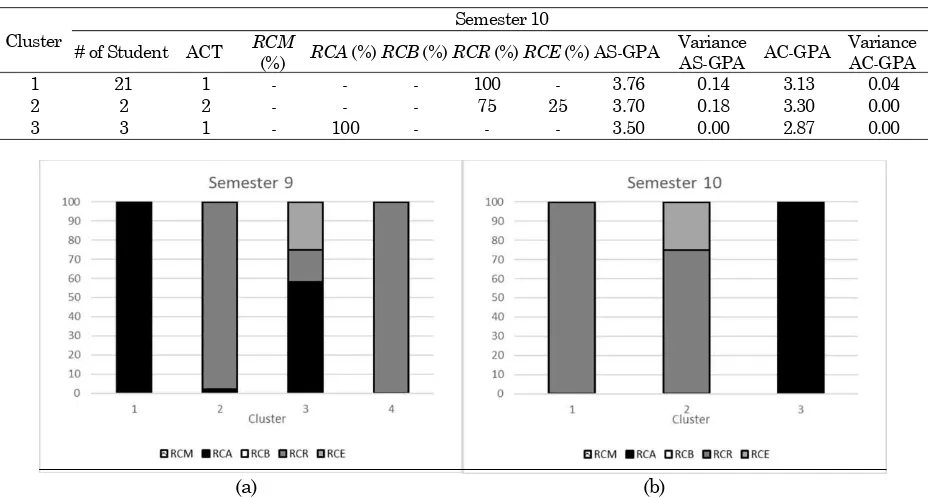
Students’ learning behavior for each cluster in additional semesters is shown in tables 13 and 14. The number of students has decreased to 71 stu-dents. In additional semesters, no courses matches the curriculum guideline which is only designed until semester 8.
As shown in Figures 9a and 9b, both in semester 9 and 10, there were no RCM indicators. Instead, some clusters had RCA 100% as well as the cluster that had RCR 100%. Interestingly, even in these additio-nal semesters, there were students in clusters that still took elective courses (RCE).
Boxplot in figure 10a shows that cluster 2 in semes-ter 9 has the highest average cumulative GPA. It consists of students who only retook final project while other clusters took courses after designated curriculum or elective courses. There were only 26 students that extended to semester 10. In this semester all clusters show similar performances. Students who retook courses in additional semesters usually wanted to improve their GPA.
Discussion
This section addresses three essential points from the results of the segmented-trace analysis; curri-culum model, students’ learning behavior, and some issues for further works.
courses before the designated curriculum which can lead them to finish their study earlier or in time. On the other hand, negative misalignments are when students must take courses after the designated curriculum or must retake their courses.
The presence of positive misalignment relates closely to the rule of the institution that allows students students experienced decreasing performance when they took more courses. Figure 3a shows that in semester 2 students in clusters 1, 2 and 3 took courses from later semesters. Then in semester 3, students in clusters 2, 3 and 4 must retake the courses (figure 3b). This finding implies that both students and departments must understand the typical workload for students to obtain good performance.
In this study, we apply segmented-trace profile to cluster students based on their learning behavior in each semester. The insights from the clusters have at least two valuable meanings; cluster-related curri-culum and related GPA. In the cluster-related curriculum, we could figure out the bottle-neck of the study which refers to the retaking courses during the study period.
Overall the students’ learning behavior can be iden -tified in four different phases: early, mid, late and additional. In the early period, particularly in semes-ter 2, the percentage of students that retook courses is quite high. This is because, at the end of semester 2, students will be monitored. Students who satisfy the required performance are stated to pass the preparation stage. If not, they are given until semes-ter 4 to achieve the required credits. A group of students who struggled in their study can be observed in the early periods. These students failed or achieved low grades in the courses and must retake some of the courses. They tended to fall behind their cohort and had low performance. The department stakeholders need to give more attention to help these students to improve their performance. Because the results also suggest that there are a group of students who carried on struggling all the way to late semesters. It could be seen that some of the students who achieved lower GPA, i.e. lower than 2.75, which is the standard entry requirement in most jobs-were included in the additional semes-ters.
Mid and late semesters are a vital period to ensure that students can finish in time. During this period
student may start to take an elective course, decide their laboratory and eventually choose the topic for their final project. As stated previously, the most significant misalignment in the curriculum is the presence of students who cannot finish within 8 semesters. The most significant bottleneck appears to be a final project. Some students took it in semes-ter 7 rather than semessemes-ter 8 designated in the curriculum. However, a lot of them cannot finish within the semester and must retake it in the next semester(s).
The cluster-related GPA relates students’ learning behavior with their performance in the different phases of the study. Students with the same learning behavior, thus were grouped in one cluster, performed differently. On the other hand, students with different learning behavior can achieve similar results. This means, there are other factors in addi-tion to the adherence to curriculum guideline that influences students' performance. In the early period, a wide range of variations in students' GPA is found. Figure 4 shows that some students who had almost the same GPA were in different clusters. There are at least two reasons. First, students were not aware of their study in the early semesters. The result shown in the Semester 2 (see Figure 4a) could represent that some students were in the lowest performance (i.e., Cluster 4 with average GPA ≈ 1.20) but there is no such case after Semester 2. As denoted in Table 6, the matching ratio is the lowest (i.e., 80%) and the curriculum misalignment is more than the other clusters. This case could be one of the insights for the curriculum designer and depart-ment's stakeholder to take more attention to the students who are in the clusters which belong to the low performance and misaligned with the curricu-lum guideline. As students enter mid-period, GPAs stabilize and are more homogenous within the same clusters. However, in late semesters, especially in semester 7, the performance of students differs again. Semester 7 has the highest outliers compared to other semesters.
Therefore, including the concept drift, which attempts to see the effect of changes, in the curriculum mining study would be one of the options to cover the current limitation. The sequence behavior would be another issue for our future work. It is important to see the students' learning behavior following the semester and trace whether students experience a change in the learning behavior from one semester to the next over the course of the study. Finally, multiple departments’ data would be ano -ther important issue to see the impact of this propos-ed approach. The result using multiple department’s data could show whether students from different departments show similar learning behavior. The analysis results could be the input for stakeholders, i.e., governments.
Conclusion
This study proposed a methodology for both curri-culum assessment and students’ learning behavior analysis using segmented-trace profiles. The curri-culum assessment showed the alignment between students’ learning behavior with the curriculum guideline according to the segmented-trace profiles. To analyze the students' learning behavior in the time-basis, we applied clustering technique (i.e., k-means) to group the students according to the seg-mented-trace profiles. The segseg-mented-trace profiles were an extension of sequence matching alignment in the domain of curriculum assessment.
The methodology had been tested to analyze the curriculum using a real dataset from an institutional database. The results show that students can be grouped into several clusters for each semester that have diverse characteristics with respect to their learning behavior and performance. The attributes of students’ learning behavior, which referred to the segmented-trace profiles, also represent instance attributes, i.e. the GPAs of the students on the respective semester. As the dataset follows a centra-lized-curriculum, then the students learning beha-viors are typically homogenous. However, mis-alignment from the curriculum can be found both with positive and expected or negative and unwanted results. The most notable negative misalignment is the fact that some students could not finish within the eight semesters designated in the curriculum. Even from early semesters, results indicate that there are groups of students who per-form well and those who are lagging. High perfor-ming students represent positive misalignment as they consistently obtain higher than average GPA, taking more credits (courses) and eventually finished earlier than the normal time. However, there are a group of students, albeit much less than the high performer, who is lagging from the batch and
perform below average. These provide several insights for the department stakeholders. Department stake-holders must: in the early period of study help students settle their study and identify students who are lagging and help them to catch up; in the mid-period, provide guidance on the choice of elective courses and on choosing topic for final project based on students’ capability and preference; in the late Driven Educational Process Mining, ISDA 2009 - 9th International Conference on Intelligent Sys-tems Design and Applications, pp. 1114–1119, 2009.
2. Dekker, G.W., Pechenizkiy, M., and Vleeshou-wers, J.M., Predicting Students Drop Out: A Case Study, EDM’09 - Educational Data Mining 2009: 2nd International Conference on Educa-tional Data Mining, pp. 41–50, 2009.
3. Wang, R., and Zaïane, O. R., Discovering Process in Curriculum Data to Provide Recommendation,
Proceedings of the 8th International Conference on Educational Data Mining, pp. 580–581, 2015. 4. Wong, W.Y., and Lavrencic, M., Using a Risk
Management Approach in Analytics for Curri-culum and Program Quality Improvement, Pro-ceedings of the 1st Learning Analytics Curricu-lum and Program Quality Improvement (PCLA)
2016, 1(1), 2016, pp. 10–14.
5. Pechenizkiy, M., Trcka, N., De Bra, P., and Toledo, P., Curri, M., Curriculum Mining, Procee-dings of the 5th International Conference on Educational Data Mining, i, 2012, pp. 1–4. 6. CUHK, The Chinese University of Hong Kong,
The Development of an Outcomes-based Appro-ach to TeAppro-aching and Learning at The Chinese 8. OECD/Asian Development Bank, Education in
Indonesia, 20(15), OECD Publishing, 2015. 9. Song, M., Günther, C.W., and van Der Aalst, W.
M. P., Trace Clustering in Process Mining, Lec-ture Notes in Business Information Processing, LNBIP, 17, 2009, pp. 109–120.
10.Bendatu, L. Y., and Yahya, B. N., Sequence Matching Analysis for Curriculum Development,
Jurnal Teknik Industri, 17(1), 2015, pp. 47–52. 11.Priyambada, S. A., Er, Mahendrawati., and
12.Pechenizkiy, M., Trcka, N., Vasilyeva, E.., van der Aalst, W. M. P., and de Bra, P.., Process Mining Online Assessment Data, Proceedings of the 2nd International Conference on Educational Data Mining, 2009, pp. 279–288.
13.Hicheur, C. A., Gueni, B., Hafdi, H., Joubert, C., and Khelifa, N., Towards a Distributed Compu-tation Platform Tailored for Educational Process Discovery and Analysis, International Conference on Protocol Engineering, ICPE 2015 and Inter-national Conference on New Technologies of Dis-tributed Systems, NTDS 2015 - Proceedings, pp. 1–8.
14.Bose, R., and van Der Aalst, W., Context-Aware Trace Clustering: Towards Improving Process Mining Results., Proceeding of the 2009, SIAM Ingenational Conference on Data Mining, 2009, pp. 401–412.
15.Hompes, B. F. A., Buijs, J., van der Aalst, W. M. P., Dixit, P. M., and Buurman, J., Discovering Deviating Cases and Process Variants Using Trace Clustering, Proceedings of the 27th Benelux Conference on Artificial Intelligence (BNAIC), November, 2015, pp. 5–6.
van Oirschot, Y., Using Trace Clustering for Con-figurable Process Discovery Explained by Event Log Data, Mater Thesis, Eindhoven University of Technology, Eindhoven, The Nedherland, 2014.
16.de Weerdt, J., van den Broucke, S., Vanthienen, J., and Baesens, B., Active Trace Clustering for Improved Process Discovery, IEEE Transactions on Knowledge and Data Engineering, 25(12), 2013, pp. 2708–2720.
17.Ha, Q. T., Bui, H. N., and Nguyen, T. T., A Trace Clustering Solution Based on Using the Distance Graph Model, in Lecture Notes in Computer Science (including subseries Lecture Notes in Arti-ficial Intelligence and Lecture Notes in Bioin-formatics), 9875 LNCS, 2016, pp. 313–322. 18.Accorsi, R., and Stocker, T., Discovering
Work-flow Changes with Time-based Trace Clustering,
Lecture Notes in Business Information Process-ing, 116 LNBIP, 2012, pp. 154–168.
19.Evermann, J., Thaler, T., and Fettke, P., Clus-tering Traces Using Sequence Alignment, Lecture Notes in Business Information Processing, 256, 2016, pp. 179–190.
20.Hartigan, J. A., and Wong, M. A., Algorithm AS 136: A K-Means Clustering Algorithm, Applied Statistics, 28(1), 1979, p. 100.
21.Charrad, M., Ghazzali, N., Boiteau, V., and Nik-nafs, A., NbClust : An R Package for Determining the Relevant Number of Clusters in a Data Set,