*Corresponding author:
E-mail: [email protected]
Strengthening No: 36b/E/KPT/2016 Available online at http://medpet.journal.ipb.ac.id/
Nutrient Changes and
in Vitro
Digestibility in Generative Stage of M10-BMR
Sorghum Mutant Lines
R. Sriagtulaa, P. D. M. H. Kartib,*, L. Abdullahb, Supriyantoc, & D. A. Astutib aDepartment of Nutrition and Feed Science, Faculty of Animal Science, Andalas University
Limau Manis, Padang, Sumatera Barat, Indonesia
bDepartment of Nutrition and Feed Technology, Faculty of Animal Science, Bogor Agricultural University cDepartment of Silviculture, Faculty of Forestry, Bogor Agricultural University
Jalan Agatis, Kampus IPB Darmaga Bogor 16680, Indonesia
(Received 19-04-2017; Reviewed 08-06-2017; Accepted 18-07-2017)
ABSTRACT
The objective of this research was to investigate the influences of generative stage on crude pro -tein, crude fiber, ash, and crude fat contents as well as in-vitro dry matter and organic matter digest -ibilities of M-10 BMR sorghum mutant lines. This research was arranged into a randomized block design with 2 factors. The first factor was M-10 BMR sorghum mutant lines (Patir 3.1, Patir 3.2 and Patir 3.7) and the second factor was generative stages (flowering, soft dough and hard dough phase). The observed variables were proximate contents of stem, leaves and panicle of sorghum plant and in-vitro digestibility of whole plant. The results showed that leaves crude protein (CP) was more influenced by M-10 BMR sorghum mutant lines. Stems and panicles CP were influenced by the interaction between M-10 BMR sorghum mutant lines and generative stages. Further generative stage reduced stems CP but increased panicles CP. Crude fiber (CF), ash, and ether extract (EE) in leaves were not influenced by generative stages. Stems CF was influenced by M-10 BMR sorghum mutant lines and generative stages, while stems EE was more influenced by generative stages. Stems ash content was influenced by the interaction between M-10 BMR sorghum mutant lines and generative stages while panicles ash content was more influenced by generative stages. M-10 BMR sorghum mutant lines and hard dough phase increased in-vitro dry matter and organic matter digestibilities. Based on those findings, it can be
concluded that the increased maturity reduces CP and CF contents so it increases in-vitro digestibilities.
Keywords: brown midrib sorghum, in vitro digestibility, generative stage, sorghum mutant lines
ABSTRAK
Penelitian ini bertujuan untuk menganalisis pengaruh fase generatif pada kandungan protein kasar, serat kasar, abu, dan lemak kasar, serta kecernaan bahan kering dan bahan organik galur sor-gum mutan BMR secara in vitro. Penelitian ini menggunakan rancangan acak kelompok pola faktorial dengan 2 faktor. Faktor pertama adalah galur sorgum BMR (Patir 3.1, Patir 3.2, dan Patir 3.7) dan faktor kedua adalah fase generatif (berbunga, soft dough, dan hard dough). Peubah yang diamati adalah kan-dungan proksimat batang, daun dan malai tanaman sorgum, serta kecernaan bahan kering dan bahan organik tebon sorgum. Hasil penelitian menunjukkan bahwa kandungan protein kasar pada daun dipengaruhi oleh galur sorgum mutan BMR M-10 (P<0,01). Kandungan protein kasar pada batang dan malai dipengaruhi oleh interaksi antara galur sorgum mutan M-10 dan fase generatif. Fase generatif lanjut menurunkan kandungan protein kasar pada batang, namun meningkatkan kandungan protein kasar pada malai. Kandungan serat kasar, abu dan lemak kasar pada daun tidak dipengaruhi oleh fase generatif, sedangkan kandungan serat kasar pada batang dipengaruhi oleh galur sorgum mutan BMR M-10 dan fase generatif. Kandungan lemak kasar pada batang dipengaruhi oleh fase generatif. Kandungan abu batang dipengaruhi oleh interaksi galur sorgum BMR M-10 dan fase generatif, se-dangkan kandungan abu malai dipengaruhi oleh fase generatif. Galur sorgum BMR M-10 dan fase
hard dough meningkatkan kecernaan bahan kering dan bahan organik secara in vitro. Kesimpulan penelitian adalah semakin tua umur tanaman maka semakin menurun kandungan PK dan SK, serta meningkatnya kecernaan secara in vitro.
INTRODUCTION
In general, forage is the main feed for ruminants with a daily consumption rate reaches 70% of the total ration. Besides of this huge amount, forage also plays a role as the main nutrition source for ruminants, there-fore its availability is absolutely necessary. Forages should be maintained in ruminant diets because the production costs for forages are lower than for concen-trate and more environmentally friendly, so it is more suitable for the development of sustainable livestock industry. Forage in diets helps maintain rumen function, reduces the risk of acidosis, and improves intake (Sari et al., 2015).
The development of sustainable forage is a chal-lenge in running livestock business. The classical prob-lem in the supply of forage in Indonesia is the lack of fertile land and low production in the dry season. To overcome those conditions, forage with high biomass production and more adaptive to marginal land such as sorghum is needed to be developed. Sorghum (Sorghum bicolor) is one of important crops and ranks at the fifth
world’s widest spread after wheat, rice, maize, and barley (Dahir et al., 2015). Sorghum is one of cereal
crops consisting of forage and grains which potential to be used for fodder. Sorghum is also used to substitute maize (Zea mays) which is very potential to be cultivated
in Indonesia. Sorghum has a good adaptation, tolerant to drought, and relatively produces higher biomass in less suitable climate and soil condition (Abdelhadi &
Tricarico, 2009).
However, forage is limited in supplying energy demand of ruminant due to the low digestibility and high content of cell wall. The lignin content of the maize plant is less than that of forage sorghums, so it also lim-its the consumption of sorghum by ruminants (Dann et al., 2008). This condition is caused by the reality that the sorghum used as forage is conventional varieties that
are not designed to be used as a feed. Genetic modifi -cation of the source of forage is absolutely necessary to increase the availability of energy in the forage.
Recently, genetic modification through induced
mutation using gamma rays irradiation has been developed in plant breeding technology. Mutation can expand plant genetic diversity to produce several sorghum mutant lines which designed for feed as brown
midrib sorghum mutant lines (BMR). BMR usually has
lower lignin content (Dann et al., 2008; Astigarraga et al., 2014). A structure modification in cell wall during mutation process decreases lignin content and increases
cellulose content, fiber content in forage (cellulose and hemicellulose) as energy sources for livestock. The de -crease in lignin content in BMR sorghum in-creases the
efficiency of energy conversion and nutrition content (Gressel, 2008).
Forage quantity and quality are directly related with harvest times. Optimum harvest time correlates with optimum nutrition content and maximum yield.
Maturity stages of forage define the quality of forage, further maturity stage will increase fiber content while
crude protein content and digestibility are reduced. It
indicates that the low quality of forages will influence
the productivity of livestock (Beck et al., 2013). Based on those mentioned ideas, the best maturity stage of M-10 BMR sorghum mutant lines should be found. In addi-tion, it is necessary to investigate the changes of nutrient content in stems, leaves and panicles and in-vitro dry
matter and organic matter digestibilities in different
generative stages of sorghum mutant lines.
MATERIALS AND METHODS
This research was arranged into a randomized
block design with 2 factors. The first factor was M-10
BMR sorghum mutant lines (Patir 3.1, Patir 3.2, and Patir
3.7) and the second factor was generative stages (flower
-ing, soft dough and hard dough phase). Data were ana
-lyzed by using analysis of variance (ANOVA) by using
the SPSS 16 software program. Duncan Multiple Range
Test was conducted if significant difference occurred (Steel & Torrie, 1997).
The culture technique and sample preparation of sorghum mutant line refered to Sriagtula et al. (2016a).
Seeds were sown in 20 x 60 cm planting area at 5 cm
depth. At 14 days post planting, fertilizers (urea, tri
sodium phosphate, and potassium chloride) were ap
-plied in a ratio of 4:3:2 (g/g/g) at 270 kg/ha. Second fertil
-izer application was performed at 50 days post-planting with a ratio of 2:4:2 (g/g/g) at 200 kg/ha. Harvesting was done after the plant entered the flowering (74 days after sowing/das), soft dough (90 das) and hard dough (110 das) phases. To determine dry weight, stems, leaves and
panicles were placed into individual paper bags and dried at 60°C for 48 h. Samples were then grinded at <1 mm mash and prepared for nutritional analysis.
In vitro digestibility test was carried out by using
Tilley & Terry (1963) method. 0.5 g of each sample was
weighed and incubated for 48 h with a mixture of 40 mL
of McDougall buffer solution and 10 mL of rumen fluid
with CO2. At the end of the first fermentation, microbial activity was stopped with 2-3 drops of HgCl2. This was followed by the inoculation period of 48 h with the
ad-dition of 50 g pepsin HCl. This method was employed with rumen liquor obtained from three rumen-fistulated adult Bali cattle that were fed ad libitum with the ratio of roughage : concentrate was 60:40.
The observed parameters were crude protein (CP), crude fiber (CF), ash, and crude fat (EE) contents in
leaves, stems, and panicles. Sugar Brix was measured on sorghum stem. The in vitro dry matter digestibil
-ity (DMD) and organic matter digestibil-ity (OMD) of
the whole plant of sorghum mutant lines were also measured.
The quality of the mutant sorghum plant was
mea-sured by proximate analysis with AOAC method (1980) to obtain the crude protein, crude fiber, ash, crude fat
content and Brix sugar was measured using a
refrac-tometer. Nitrogen Free Extract (NFE) was calculated
from moisture, CP, CF, EE, and ash with formula NFE= 100- (moisture + ash + crude fat + Crude protein + crude
RESULTS
Crude Protein, Crude Fiber, Ash, and Crude Fat Contents of M-10 Sorghum Mutant Lines
The magnitude of CP contained in stems, leaves,
and panicles at three different generative stages are
shown in Table 1. The interaction between sorghum
mutant lines and generative stages had significant ef
-fect (P<0.05) on crude protein in stems. Among of three
generative stages, the highest CP content of all sorghum
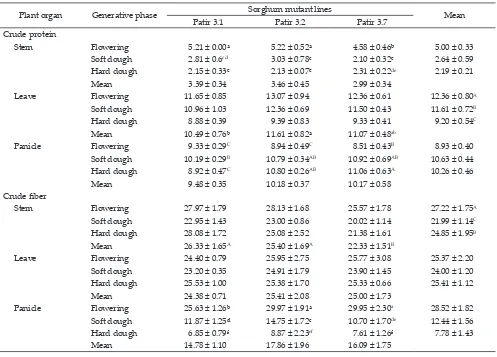
mutant lines was produced at the flowering phase i.e., 4.58%-5.22%. At the soft dough phase, the stems CP con -tent reduced to 2.10%-3.03% and continually reduced to 2.13%-2.31% at the hard dough phase. The leaves CP
content was significantly influenced (P<0.05) by sor -ghum mutant lines. BMR sor-ghum mutant lines Patir 3.2 and Patir 3.7 had higher leaves CP contents compared with non-BMR sorghum mutant lines Patir 3.1 i.e.,
11.61%, 11.07%, and 10.49%, respectively. The leaves CP content was also significantly influenced (P<0.05)
by generative stages. The highest leaves CP content
was produced at the flowering phase and continually
reduced at the soft dough and hard dough phase i.e.,
12.36%, 11.61%, and 9.20% respectively.
Crude fiber (CF) contents of leaves, stems, and
panicles of sorghum mutant which observed at three
different generative stages are shown in Table 1. Crude fiber content of stems was significantly influenced by sorghum mutant lines or generative stage (P<0.01) but no interaction effect of both parameters. Non-BMR sorghum mutant lines (Patir 3.1) and BMR sorghum mutant lines (Patir 3.2) produced higher CF content compared with Patir 3.7 i.e., 26.33%, 25.40%, and 22.33%,
respectively. In leaves, sorghum mutant lines or
genera-tive stage had no significant effect on CF content as well
as the interaction between both parameters. The crude
fiber content in stems ranged between 23.20%-25.95%.
Meanwhile, the interaction between sorghum mutant
lines and harvest times influenced the content of leaves CF (P<0.05). In all sorghum mutant lines, the highest CF content was produced during the flowering phase and
decrease during the soft dough phase. The lowest con-tent was produced during the hard dough phase.
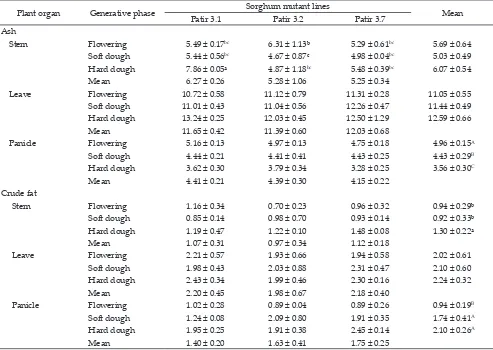
Ash contents in stems, leaves, and panicles are pre-sented in Table 2. The result showed that an interaction between sorghum mutant lines and generative stages
in-fluenced the stems ash content (P<0.05). The highest ash content was produced during hard dough phase (7.86%) by non-BMR sorghum mutant lines (Patir 3.1) and the
Note: Means with different superscripts in uppercase and lowercase differ significantly at P<0.01 and P<0.05, respectively. Patir 3.1= non-BMR sor -ghum mutant line; Patir 3.2-Patir 3.7= BMR sor-ghum mutant lines.
Plant organ Generative phase Sorghum mutant lines Mean
Patir 3.1 Patir 3.2 Patir 3.7
Crude protein
Stem Flowering 5.21 ± 0.00ᵃ 5.22 ± 0.52ᵃ 4.58 ± 0.46ᵇ 5.00 ± 0.33
Soft dough 2.81 ± 0.6cd 3.03 ± 0.78c 2.10 ± 0.32ᵉ 2.64 ± 0.59
Hard dough 2.15 ± 0.33ᵉ 2.13 ± 0.07ᵉ 2.31 ± 0.22de 2.19 ± 0.21
Mean 3.39 ± 0.34 3.46 ± 0.45 2.99 ± 0.34
Leave Flowering 11.65 ± 0.85 13.07 ± 0.94 12.36 ± 0.61 12.36 ± 0.80A
Soft dough 10.96 ± 1.03 12.36 ± 0.69 11.50 ± 0.43 11.61 ± 0.72B
Hard dough 8.88 ± 0.39 9.39 ± 0.83 9.33 ± 0.41 9.20 ± 0.54C
Mean 10.49 ± 0.76ᵇ 11.61 ± 0.82ᵃ 11.07 ± 0.48ab
Panicle Flowering 9.33 ± 0.29C 8.94 ± 0.49C 8.51 ± 0.43B 8.93 ± 0.40
Soft dough 10.19 ± 0.29B 10.79 ± 0.34AB 10.92 ± 0.69AB 10.63 ± 0.44
Hard dough 8.92 ± 0.47C 10.80 ± 0.26AB 11.06 ± 0.63A 10.26 ± 0.46
Mean 9.48 ± 0.35 10.18 ± 0.37 10.17 ± 0.58
Crude fiber
Stem Flowering 27.97 ± 1.79 28.13 ± 1.68 25.57 ± 1.78 27.22 ± 1.75A
Soft dough 22.95 ± 1.43 23.00 ± 0.86 20.02 ± 1.14 21.99 ± 1.14C
Hard dough 28.08 ± 1.72 25.08 ± 2.52 21.38 ± 1.61 24.85 ± 1.95B
Mean 26.33 ± 1.65A 25.40 ± 1.69A 22.33 ± 1.51B
Leave Flowering 24.40 ± 0.79 25.95 ± 2.75 25.77 ± 3.08 25.37 ± 2.20
Soft dough 23.20 ± 0.35 24.91 ± 1.79 23.90 ± 1.45 24.00 ± 1.20
Hard dough 25.53 ± 1.00 25.38 ± 1.70 25.33 ± 0.66 25.41 ± 1.12
Mean 24.38 ± 0.71 25.41 ± 2.08 25.00 ± 1.73
Panicle Flowering 25.63 ± 1.26ᵇ 29.97 ± 1.91ᵃ 29.95 ± 2.30a 28.52 ± 1.82
Soft dough 11.87 ± 1.25ᵈ 14.75 ± 1.72c 10.70 ± 1.70de 12.44 ± 1.56
Hard dough 6.85 ± 0.79f 8.87 ± 2.23ef 7.61 ± 1.26f 7.78 ± 1.43
Mean 14.78 ± 1.10 17.86 ± 1.96 16.09 ± 1.75
lowest ash content was produced during soft dough
phase (4.67%) by BMR sorghum mutant lines (Patir 3.2).
Sorghum mutant lines or generative stage had no
sig-nificant effect on ash content in leaves. The ash content in panicles was influenced by generative stage (P<0.01)
and it decreased with the increased generative stage.
The crude fat (EE) contents in stems, leaves, and
panicles are shown in Table 2. The result showed
that EE in stems was influenced by generative stage (P<0.05). The EE content in stems during hard dough phase was higher than flowering and hard dough phase i.e., 1.30%, 0.94%, and 0.92% respectively. The EE in panicles was also significantly influenced by generative stage (P<0.01). The hard dough and soft dough phase produced the higher EE content (2.10% and 1.74%) com
-pared to flowering phase (0.94%).
Brix Sugar of Stems of M-10 Sorghum Mutant Lines
The stem sugar in the study is present in Table 3. Studies have shown that sorghum stem sugar was af-fected by the interaction between sorghum mutant lines
and maturity stages (P<0.01). BMR sorghum mutant
lines produce higher stem sugar content
(13.37%-13.93% Brix) compared to non-BMR sorghum mutant
line (11.58% Brix). Sugar content in the sorghum stem
increased with the increased maturity stage (hard dough
stage) in this study. Stem sugar contents from flowering,
soft dough, and hard dough phase were 12.01%, 13.68%, and 14.81% Brix, respectively.
In Vitro Digestibilities of Dry Matter and Organic
Material of M-10 Sorghum Mutant Lines
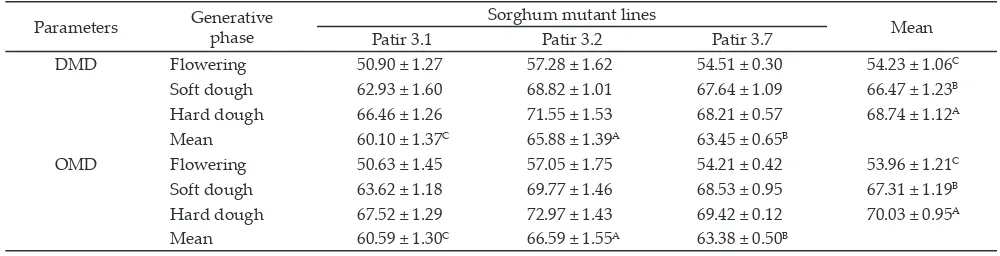
The DMD and OMD are presented in Table 4. There is no interaction between sorghum mutant lines
Note: Means with different superscripts in uppercase and lowercase differ significantly at P<0.01 and P<0.05, respectively. Patir 3.1= non-BMR sor -ghum mutant line; Patir 3.2-Patir 3.7= BMR sor-ghum mutant lines.
Plant organ Generative phase Sorghum mutant lines Mean
Patir 3.1 Patir 3.2 Patir 3.7
Ash
Stem Flowering 5.49 ± 0.17bc 6.31 ± 1.13ᵇ 5.29 ± 0.61bc 5.69 ± 0.64
Soft dough 5.44 ± 0.56bc 4.67 ± 0.87c 4.98 ± 0.04bc 5.03 ± 0.49
Hard dough 7.86 ± 0.05ᵃ 4.87 ± 1.18bc 5.48 ± 0.39bc 6.07 ± 0.54
Mean 6.27 ± 0.26 5.28 ± 1.06 5.25 ± 0.34
Leave Flowering 10.72 ± 0.58 11.12 ± 0.79 11.31 ± 0.28 11.05 ± 0.55
Soft dough 11.01 ± 0.43 11.04 ± 0.56 12.26 ± 0.47 11.44 ± 0.49
Hard dough 13.24 ± 0.25 12.03 ± 0.45 12.50 ± 1.29 12.59 ± 0.66
Mean 11.65 ± 0.42 11.39 ± 0.60 12.03 ± 0.68
Panicle Flowering 5.16 ± 0.13 4.97 ± 0.13 4.75 ± 0.18 4.96 ± 0.15A
Soft dough 4.44 ± 0.21 4.41 ± 0.41 4.43 ± 0.25 4.43 ± 0.29B
Hard dough 3.62 ± 0.30 3.79 ± 0.34 3.28 ± 0.25 3.56 ± 0.30C
Mean 4.41 ± 0.21 4.39 ± 0.30 4.15 ± 0.22
Crude fat
Stem Flowering 1.16 ± 0.34 0.70 ± 0.23 0.96 ± 0.32 0.94 ± 0.29ᵇ
Soft dough 0.85 ± 0.14 0.98 ± 0.70 0.93 ± 0.14 0.92 ± 0.33ᵇ
Hard dough 1.19 ± 0.47 1.22 ± 0.10 1.48 ± 0.08 1.30 ± 0.22ᵃ
Mean 1.07 ± 0.31 0.97 ± 0.34 1.12 ± 0.18
Leave Flowering 2.21 ± 0.57 1.93 ± 0.66 1.94 ± 0.58 2.02 ± 0.61
Soft dough 1.98 ± 0.43 2.03 ± 0.88 2.31 ± 0.47 2.10 ± 0.60
Hard dough 2.43 ± 0.34 1.99 ± 0.46 2.30 ± 0.16 2.24 ± 0.32
Mean 2.20 ± 0.45 1.98 ± 0.67 2.18 ± 0.40
Panicle Flowering 1.02 ± 0.28 0.89 ± 0.04 0.89 ± 0.26 0.94 ± 0.19B
Soft dough 1.24 ± 0.08 2.09 ± 0.80 1.91 ± 0.35 1.74 ± 0.41A
Hard dough 1.95 ± 0.25 1.91 ± 0.38 2.45 ± 0.14 2.10 ± 0.26A
Mean 1.40 ± 0.20 1.63 ± 0.41 1.75 ± 0.25
Table 2. Ash dan crude fat contents of sorghum mutant lines (based on 100% dry matter)
Note: Means with different superscripts in uppercase differ signifi -cantly (P<0.01). Patir 3.1= non-BMR sorghum mutant line; Patir 3.2-Patir 3.7= BMR sorghum mutant lines.
Table 3. The mean of stems sugar contents of sorghum mutant
lines (% brix)
Sorghum mutant
lines
Generative stage
Mean Flowering Soft dough Hard dough
Patir 3.1 10.67 ± 0.72C 12.37 ± 0.49B 11.63 ± 2.30BC 11.56 ± 0.86B
Patir 3.2 11.28 ± 0.60BC 14.77 ± 0.42A 15.80 ± 0.61A 13.95 ± 0.54A
Patir 3.7 12.27 ± 1.17BC 12.60 ± 0.10B 15.23 ± 1.44A 13.37 ± 0.90A
and generative stage on dry matter digestibility (DMD). However, DMD was influenced by sorghum mutant lines (P<0.01). The highest digestibility (65.88%) was found in BMR sorghum mutant lines (Patir 3.2) and the lowest digestibility (60.10%) was found in non-BMR (Patir 3.1). Dry matter digestibility was also influenced by generative stage (P<0.01). The highest dry mat -ter digestibility was obtained at hard dough phase
(68.74%) and the lowest was obtained at flowering phase (54.23%).
Organic matter digestibility was influenced by sor
-ghum mutant lines (P<0.01). The highest organic matter digestibility (66.59%) was produced by BMR sorghum mutant lines (Patir 3.2) while the lowest organic matter digestibility (60.59%) was produced by non-BMR (Patir 3.1). The OMD was also influenced by generative stage (P<0.01). The highest OMD was obtained at hard dough phase (70.037% ) and the lowest was obtained at flower
-ing phase (53.69%).
DISCUSSION
The declining trend of stems and leaves CP con-tents during further generative stage (soft dough and
hard dough phase) could be related to the inhibition of
protein synthesis in the aging plant (Baloyi et al., 2013).
In contrast to the stems and leaves, panicles experienced an increasing trend of CP. This trend can be due to the movement of nutrient content from stems and leaves to grain which associates with the increased maturity of the plant (Atis et al., 2012; Fernandes et al., 2014). In this
research it was found that CP content at BMR sorghum mutant lines was higher than non-BMR sorghum mu-tant line. This result is in agreement with the report of de Aquilar et al. (2014) who also stated that CP content
of BMR lines was 0.6% higher than non-BMR which harvested at soft dough stage.
In this study, the stems CF content was decrease with the increased generative stage, because of Sorghum bicolor is sweet sorghum that has two sinks: stems and grains. Low CF content in stems is due to the less por-tion of structural carbohydrate as sugar accumulates in
stems and for grain development. Grain filling occurs at
the soft dough and hard dough phase, therefore, carbo-hydrate proportion will be trans-located from stems to
panicles and at the same time sugar accumulates in the stems (Carmi et al., 2006; Qu et al., 2014). Low CF content
in panicles at the further generative stage is due to the increasing content of starch in grains. This is in
agree-ment with the findings of Marsalis et al. (2009) who
stated that the increased non-fiber carbohydrate and decreased fiber fractions during the increased generative
stage are due to the increased starch content in grains. In this study, it was found that the CF deacreased in stem and panicle at soft dough and hard dough phases while the stem sugar were higher at the same phases (Table 1
and Table 3).
Ash content represents mineral content. There is no
different in ash contents of leaves related to the mobile
characteristic of nutrient at leaves which will be
trans-located to other parts of the plant to fill the grain (Atis
et al., 2012; Fernandes et al., 2014). The ash content in
this study was decreased with the increased generative stage. The same trends were also found by Koten et al.
(2014) that sorghum harvested at the stage of initiation
of grain development had higher ash content compared with those harvested at further maturity (soft dough
phase). This result was due to the increased starch con -tent of grains during further generative stage (Marsalis
et al., 2009) and the increased organic content such as
starch in grain and sugar in the stem as an accumulation
result of photosynthesis so that the inorganic matter (ash) was measured lower (Rosser, 2013).
Sorghum leaves have high EE content due to the presence of a wax coating on leaves surfaces. This coating material may prevent water loss during transpiration. Wax material is insoluble in ether lead-ing to a higher crude fat contained in forage material
(Buschhaus & Jetter, 2012). The general result showed
that EE increased with the increased generative stage. The hard dough and soft dough phases result in a higher crude fat contents of panicles than others, due to the high starch content in this phase. In seeds, lipids are positively correlated with starch and is an integral
part of starch in the form of lysophospholipid (LPL) and free fatty Acids (FFA) as a starch-lipid complex (Tang & Copeland, 2007). Sorghum leaves have abusive fat
content which is quite large because of the wax coating on the leaf surface. Layers of wax in plants inhibit water loss due to transpiration. The wax is soluble in ether and
Note: Means with different superscripts in uppercase differ significantly (P<0.01). Patir 3.1= non-BMR sorghum mutant line; Patir 3.2-Patir 3.7= BMR sorghum mutant lines; DMD= dry matter digestibility, OMD= organic matter digestibility
Table 4. In vitro dry matter and organic matter digestibilities of sorghum mutant lines (%)
Parameters Generative
phase
Sorghum mutant lines
Mean
Patir 3.1 Patir 3.2 Patir 3.7
DMD Flowering 50.90 ± 1.27 57.28 ± 1.62 54.51 ± 0.30 54.23 ± 1.06C
Soft dough 62.93 ± 1.60 68.82 ± 1.01 67.64 ± 1.09 66.47 ± 1.23B
Hard dough 66.46 ± 1.26 71.55 ± 1.53 68.21 ± 0.57 68.74 ± 1.12A
Mean 60.10 ± 1.37C 65.88 ± 1.39A 63.45 ± 0.65B
OMD Flowering 50.63 ± 1.45 57.05 ± 1.75 54.21 ± 0.42 53.96 ± 1.21C
Soft dough 63.62 ± 1.18 69.77 ± 1.46 68.53 ± 0.95 67.31 ± 1.19B
Hard dough 67.52 ± 1.29 72.97 ± 1.43 69.42 ± 0.12 70.03 ± 0.95A
116 August 2017
included into the ether extract so that the crude fat value in forage fodder has a higher value (Tillman et al., 1998).
The EE content in leaves found in this research was
1.98%-2.20%, that was lower than the result reported by Koten et al. (2014) i.e., 3.99%-6.96%.
In general, sugar levels in the sorghum stem increased with the increased maturity stage (hard
dough phase) that was a seed maturation period. The sugar content of sorghum stem was influenced by stem
maturity of sorghum. Increase in stems maturity will increase sugar content. The maturity of the sorghum stem due to the maximum sugar content is achieved at physiological maturity of sorghum seed. This result is in accordance with the results reported by Almodares
et al. (2007) that the highest sugar content of sorghum
stem was found when the plant enters the physiological maturity of seed at 120 das. A similar statement was also expressed by Long et al. (2006) that the sugar contents of
two sweet sorghum varieties were lower at early flow -ering phase then gradually increased from the milky phase to seed maturation. The low sugar content in the
flowering phase was caused by the translocation of pho -tosynthesis materials into the seeds, and a part of the sugar in sorghum stem was used as energy to support
plant physiological process (Sucipto, 2010). Low lignin
content in BMR mutant lines is caused by the sugar con-tent of the stem was higher than a non-BMR mutant line (Scully et al., 2016).
The DMD is in line with the OMD. At this study, the highest in vitro digestibility was found at BMR
sor-ghum mutant lines (Patir 3.2 and Patir 3.7) compared with non-BMR sorghum mutant lines (Patir 3.1). This finding corresponds to Puteri et al. (2015) that in vitro
DMD and OMD of sorghum mutant lines (Patir 3.5, Patir 3.6, and Patir 3.7) were higher than Samurai (M-17) (non-BMR sorghum mutant line). The increased digest -ibility was caused by the gene mutation in BMR which
reduces lignin content (Ledgerwood, 2009; Tesso & Ejeta, 2011; Rao et al. 2012; Sattler, 2014). Our previous
research (Sriagtula et al., 2016a) reported the decrease in
stem lignin in Patir 3.2 and Patir 3.7 BMR sorghum mu-tant lines that were 3.03% and 3.28%. Based on genera-tive stage, the higher in vitro digestibility was obtained during hard dough compared to during the soft dough
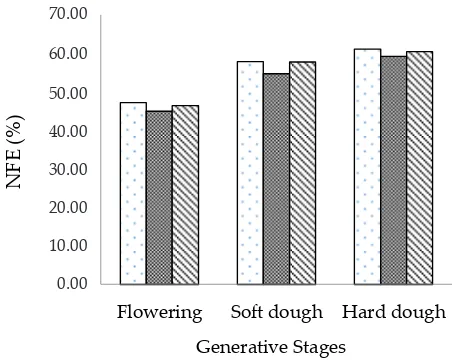
and flowering. This result is due to the decreased con
-tent of crude fiber, and the increased con-tent of sugar in
stem and NFE in sorghum at further maturity (Table 3
and Figure 1). Crude fiber was reflected as ADF, NDF,
and lignin. Refer to Carmi et al. (2006); Sriagtula et al.
(2016a) that decreasing of ADF, NDF, and lignin during
hard dough stage and increasing the content of sugar in
stems and grain proportion eventually affected in vitro
digestibility. Refer to Sriagtula et al. (2016b) the highest
panicle proportion produced by all sorghum mutant lines was at the hard dough phase. Qu et al. (2014) stated
that the decrease in plant fiber content at soft dough
phase would increase in vitro DMD. However, Rosser et
al. (2013) stated that further maturity of forage crops did
not reduce in vitro OMD.
In this research, in vitro DMD at the flowering
phase was 54.23% and at soft dough phase was 66.47%. Those values were slightly different from the result
found by Carmi et al. (2006) who stated that the ranges
of in vitro DMD of sorghum at flowering phase was 61%-70% and soft dough phase was 61%-65%.
CONCLUSION
BMR sorghum mutant lines produced higher CP and lower CF compared with non-BMR sorghum
mu-tant lines (Patir 3.1). The increasing generative stage de -creased CP, CF, and ash contents meanwhile in-creased EE. BMR sorghum mutant lines produced higher digestibility compared to non-BMR sorghum mutant lines. The maturity stage at hard dough stage increased
in vitro digestibility. The highest in-vitro DMD and OMD were produced at Patir 3.2 and hard dough phase.
ACKNOWLEDGEMENT
We would like to express our gratitude to Ministry of Research, Technology and Higher Education of
Indonesia for financial support through competitive
grants (Doctoral Grant-Programs), Project ID No:
01/H.16/DD/LPPM/2016.
REFERENCES
Abdelhadi L. O, & J. M. Tricarico. 2009. Effects of stage of ma -turity and microbial inoculation at harvest on nutritive quality and degradability of grain sorghum whole-plant
and head-chop silages. Anim. Feed Sci. Tech. 152:175–185. https://doi.org/10.1016/j.anifeedsci.2009.04.014
Almodares, A.,M.R. Hadi., M. Ranjbar, & R. Taheri. 2007.
The effects of nitrogen treatments, cultivars and harvest
stages on stlak yield and sugar content in sweet sorghum. Asian J. Plant Sci. 6: 423-426. https://doi.org/10.3923/
ajps.2007.423.426
AOAC. 1980. Official Methods of Analysis. 13th Edition. Association of Official Analytical Chemist, Washington
DC.
Astigarraga, L., A. Bianco., R. Mello, & D. Montedónico. 2014. Comparison of brown midrib sorghum with conventional sorghum forage for grazing dairy cows. Am. J. Plant Sci. 5:
955-962.https://doi.org/10.4236/ajps.2014.57108
Figure 1. Nitrogen Free Extract of sorghum mutant lines, Patir 3.1 (
Flowering Soft dough Hard dough
N
Flowering Soft dough Hard dough
N
Flowering Soft dough Hard dough
N
Flowering Soft dough Hard dough
Atis, I., O. Konuskan., M. Duru., H. Gozubenli, & S. Yilmaz. 2012. Effect of harvesting time on yield, composition and
forage quality of some forage sorghum cultivars. Int. J.
Agric. Biol. 14: 879‒886.
Baloyi, B.M., V. I. Ayodele, & A. Addo-Bediako. 2013. Effects
of leaf harvest on crude protein and mineral contents of selected early maturing lines of lablab (Lablab purpureus). Afr. J. Agric. Res.Vol. 8: 449-453.
Beck, P., K. Poe., B. Stewart, P. Capps, & H. Gray. 2013. Effect
of brown midrib gene and maturity at harvest on for-age yield and nutritive quality of sudangrass. Grassland
Science 59: 52–58. https://doi.org/10.1111/grs.12007 Buschhaus, C., & R. Jetter. 2012. Composition and
physiologi-cal function of the wax layers coating arabidopsis leaves:
b-Amyrin negatively affects the intracuticular water bar
-rier. Plant Physiol. 160: 449-453. https://doi.org/10.1104/ pp.112.198473
Carmi, A., Y. Aharoni, M. Edelstein, N. Umiel., A. Hagiladi, E. Yosef, M. Nikbachat, A. Zenou, & J. Miron. 2006. Effects
of irrigation and plant density on yield, composition and
in vitro digestibility of a new forage sorghum variety, Tal,
at two maturity stages. Anim. Feed Sci. Technol. 131: 120–
132. https://doi.org/10.1016/j.anifeedsci.2006.02.005
Dann, H.M., R. J. Grant, K. W. Cotanch, E. D. Thomas, C. S. Ballard, & R. Rice. 2008. Comparison of brown midrib sor-ghum-sudangrass with corn silage on lactational perfor-mance and nutrient digestibility in Holstein Dairy Cows. J. Dairy Sci. 91:663–672. https://doi.org/10.3168/jds.2007-0521
Dahir, M., K. X. Zhu., X. N. Guo., W. Aboshora, & W. Peng. 2015. Possibility to Utilize Sorghum Flour in a Modern Bread Making Industry. JAIR 4:128-135.
de Aguilar, P.B., D. A de Assis Pires, B. C. B. Frota, J. A. S. Rodrigues, S. T dos Reis, & V. R. R. Júnior. 2014. Nutritional characteristics of BMR mutant and normal
sorghum genotypes used for cutting and grazing. Acta Scientiarum, Anim. Sci. Maringá 36:259-264. https://doi. org/10.4025/actascianimsci.v36i3.21284
Fernandes, G., T. G. Braga, J. Fischer, R. A. C. Parrella., M. M. de Resende, & V. L. Cardoso. 2014. Evaluation of poten-tial ethanol production and nutrients for four varieties of sweet sorghum during maturation. Renewable Energy 71:
518-524. https://doi.org/10.1016/j.renene.2014.05.033 Gressel, J. 2008. Transgenics are imperative for biofuel crops
(Review). Plant Sci. 174: 246 –263. https://doi.org/10.1016/j. plantsci.2007.11.009
Koten, B. B., R. D. Soetrisno., N. Ngadiyono, & B Soewignyo. 2014. Perubahan nilai nutrient tanaman sorgum (Sorghum
bicolor (L.) Moench) varietas lokal rote sebagai hijauan
pakan ruminansia pada berbagai umur panen dan dosis
pupuk urea. Pastura 3: 55 – 60.
Ledgerwood, D. N., E. J. DePeters., P. H. Robinson., S. J. Taylor,
& J. M. Heguy. 2009. Assessment of a brown midrib (BMR)
mutant gene on the nutritive value of sudangrass using in vitro and in vivo techniques. Anim. Feed Sci. Tech. 150:207– 222. https://doi.org/10.1016/j.anifeedsci.2008.10.001
Long, B. Y., Y. Seiji, I. Maiko, & C. H. Wei. 2006. QTLs for sug-ar content of stalk in sweet sorghum (Sorghum bicolor L.
Moench). Agricultural Sciences in China 5: 736-744. https:// doi.org/10.1016/S1671-2927(06)60118-1
Marsalis, M. A., S. Angadi., F. E. Contreras-Govea, & R. E. Kirksey. 2009. Harvest timing and by product addition effects on corn and forage Sorghum silage grown under water stress. Bull. 799. NMSU Agric. Exp. Stn., Las Cruces,
NM.
Puteri, R.E., P. D. M. H. Karti., L. Abdullah, & Supriyanto. 2015. Productivity and nutrient quality of some sorghum
mutant lines at different cutting ages. Med Pet. 38:132-137.
https://doi.org/10.5398/medpet.2015.38.2.132
Qu, H., X. Bao Liu., C.F Dong., X. Y Lu, & Y. X. Shen. 2014. Field performance and nutritive value of sweet sorghum
in eastern China. Field Crops Res. 157: 84–88. https://doi. org/10.1016/j.fcr.2013.12.010
Rao, P. S., S. Deshpande., M. Blümmel., B. V. S. Reddy, & T. Hash. 2012. Characterization of Brown Midrib Mutants of Sorghum (Sorghum bicolor (L.) Moench). The European J. Plant Sci. Biotech. 6:71-75.
Rosser, C. L., P. Gorka., A. D. Beattie., H. C. Block., J. J. Mckinnon., H. A. Lardner, & G. B. Penner. 2013. Effect
of maturity at harvest on yield, chemical composition, and in situ degradability for annual cereals used for swath
grazing. J. Anim. Sci. 91:3815-3826. https://doi.org/10.2527/ jas.2012-5677
Sari, M., A.Ferret, & S. Calsamiglia. 2015. Effect of pH on
in vitro microbial fermentation and nutrient flow indi
-ets containing barley straw or non-forage fiber sources. Anim. Feed Sci. Tech. 200:17–24. https://doi.org/10.1016/j.
anifeedsci.2014.11.011
Sattler, SE., A. Saballos, Z. Xin, D. L. F. Harris, W. Vermerris, & J. F. Pedersen. 2014. Characterization of novel sorghum brown midrib mutants from an EMS-mutagenized popu-lation. G3 (Bethesda) 4: 2115–2124. https://doi.org/10.1534/ g3.114.014001
Scully, E.D., T. Gries, D. L. Funnell-Harris, Z. Xin, F. A. Kovacs,
W. Vermerris, & S.E. Sattler. 2016. Characterization of
novel Brown midrib 6 mutations affecting lignin biosyn
-thesis in sorghum. J. Integr. Plant Biol. 58:136-49. https:// doi.org/10.1111/jipb.12375
Steel, R. G. D., & J. H. Torri. 1997. Prinsip dan Prosedur Statistika:
Suatu Pendekatan Biometrik. Edisi II. Terjemahan: B.
Sumantri. PT. gramedia Pustaka Utama Jakarta.
Sriagtula, R., P. D. M. H. Karti, L. Abdullah, Supriyanto, & D. A. Astuti. 2016a. Dynamics of fiber fraction in genera
-tive stage of M10-BMR sorghum mutant lines. IJSBAR 25: 58-69.
Sriagtula, R., P. D. M. H. Karti, L. Abdullah, Supriyanto, & D. A. Astuti. 2016b. Growth, biomass and nutrient pro-duction of brown midrib sorghum mutant lines at
dif-ferent harvest times. Pak. J. Nutr. 15: 524-531. https://doi. org/10.3923/pjn.2016.524.531
Sucipto. 2010. Efektivitas cara pemupukan terhadap pertumbu-han dan hasil beberapa varietas sorgum manis (Sorghum bicolor L.Moench). Embryo 7:67-74.
Tang, M. C. & L. Copeland. 2007. Analysis of complexes be-tween lipids and wheat starch. Carbohydr. Polym.
67:80-85.https://doi.org/10.1016/j.carbpol.2006.04.016
Tesso, T., & G. Ejeta. 2011. Stalk strength and reaction to in-fection by Macrophomina phaseolina of brown midrib maize (Zea mays) and sorghum (Sorghum bicolor). Field Crops Res. 120:271–275. https://doi.org/10.1016/j.fcr.2010.10.015 Tilley, J. M. A. & R. A. Terry. 1963. A two stage technique for
the in vitro digestion of forage crop. Grass Forage Sci. 18: 104-111. https://doi.org/10.1111/j.1365-2494.1963.tb00335.x